Article Information
- Digital Object Identifier (DOI): 10.47982/cgc.8.406
- This article is part of the Challenging Glass Conference Proceedings, Volume 8, 2022, Belis, Bos & Louter (Eds.)
- Published by Challenging Glass, on behalf of the author(s), at Stichting OpenAccess Platforms
- This article is licensed under a Creative Commons Attribution 4.0 International License (CC BY 4.0)
- Copyright © 2022 with the author(s)
Authors:
- Davide Maccariello - Saint-Gobain Research Paris
- Romain Hivet - Saint-Gobain Research Paris
Abstract
During tempering process, the non-homogenous heating or rapid cooling can induce localized strain in the glass leading to birefringence (or optical anisotropy) phenomenon, a result of the photoelastic effect. Since transmission and reflection coefficients of interfaces at high angles can be quite different with the polarization, in homogeneous birefringence may manifest as peculiar geometric patterns of bright or darkish shadows or iridescence effects in given polarized observation conditions. The patterns appearance may be at the origin of dispute between the client and the glass manufacturer. Each party may have a different perception, how strong the anisotropies are and what is permissible. With the use of an in-line scanner for the optical retardation, it is possible to control and optimise the tempering process homogeneity and thus reduce the visibility of the patterns.
However, the presence of low emissivity coatings on the façades windows can alter the visibility of the quench marks: depending on the coating nature, the quench pattern visibility can be magnified or reduced. Here, we show the calculation of σQM, as a parameter representing the coating sensitivity to quench marks, i.e., the capability of a coating to reveal or hinder the iridescence pattern of tempered glass. Thanks to the angular measurements of the transmission and reflection in s and p polarization we compute the quench mark sensitivity by estimating a color contrast gradient with regard to the phase delay.
1. Introduction
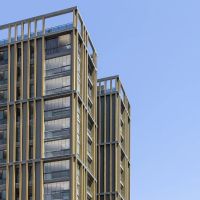
Nowadays the building envelopes are façades where the glazing plays a central role for both aesthetic and architectural concerns. Thereby, the highest quality-look and lowest level of aesthetic defects are required during the design.
The thermal tempering is the most employed technique for the glass toughening in buildings’ façade. Despite the continuous glass industry efforts in opt imising the process (Dix 2022, Monnoyer 2008, Mikkonen 2017), the tempering unintentionally produces minor differences in residual stress distribution in the glass panel due to non-uniform heat exposure and transfer making the glass birefringent. Due to its photo-elasticity, glass shows optical anisotropic behaviour since the optical index locally varies according to the different embedded stress (Dix 2022, Illguth 2015).
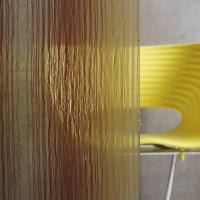
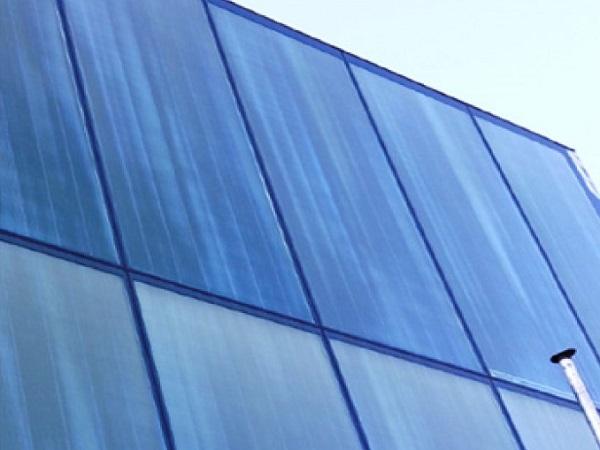
This leads to birefringence phenomena which are more or less visible according to the observation conditions. The polarization of the light obtainable under different environmental conditions can highlight in different ways peculiar geometric patterns of bright or darkish shadows or iridescence effects. These patterns,known also as quench marks, can be unsightly and disruptive from the architectural point of view.
For a given optical anisotropy, besides the environment, the background, the observation conditionsand the spatial distribution of the marks, the addition of a coating on the glass pane can alter the visibility in revealing or hindering the quench patterns of tempered glass as well (Spiss 2019). According to this, a universal specification of the glazing coatings to be taken into account during the architectural design is crucial. Actually, the optical retardation measurements used in order to optimise the tempering process is not sufficient to enlighten the capability of a given coating to reveal the quench marks (Illguth 2015, Spiss 2019).
In this paper, we present the development of an intrinsic parameter σQM characterizing the sensitivity of a coating (or configuration) to the quench marks. As a result, for a tempered glass pane with a given retardation we can estimate the pattern visibility σ (color difference between the panel with anisotropy and without anisotropy) as
![]()
were δ is the optical retardance. From the angular measurements of the transmission and reflection in s and p polarization we compute the coating driven quench mark sensitivity by estimating a color contrast gradient with regard to the phase delay.
By means of a visual evaluation protocol carried out on different silver-based coatings, normally employed in the façade products, we also compare the sensitivity factor σQM with the quench marks visibility on the different products.
2. Thermal tempering and anisotropy
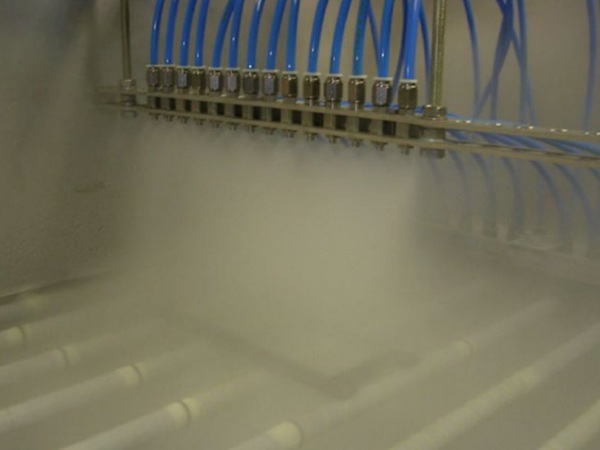
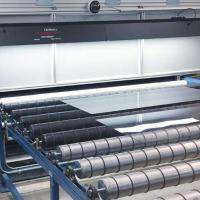
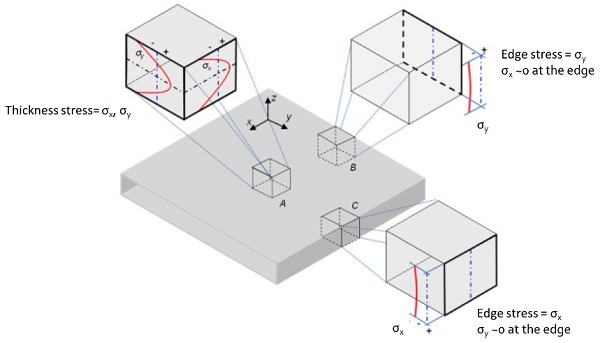
During the thermal tempering the glass is heated above the transition temperature then rapidly cooled by quenching with air. This generates a residual stress profile across the thickness with compression stresses at the glass surface as shown in the Figure 1. High mechanical and optical performances can be achieved only after the fine optimization of the cooling process. Despite of effort in having the lowest degree of imperfections, the contact with the rollers or the turbulence in the nozzle air flow can be still a source of inhomogeneity of the heat transfer to the glass surface. This gives rise to anisotropic stresses which are revealed thanks to the photo elasticity (Monnoyer 2008).
The birefringence of the tempered glass is due to its photoelasticity: stress anisotropy induces an optical index anisotropy. A photelastic material resolves the electromagnetic wave components of a transmitted ray of light along the two main stress directions and each component experiences a different refractive index. This difference leads to a relative phase retardation between the two components. The law of photoelasticity is the following:
![]()
where n0 is the refractive index in the absence of stress and C the stress-optical factor, which depends on the material and 𝜎𝑎 the anisotropic stress. For tempered glass, the stress-optical factor lies in the 2-4 TPa-1 range. Thus, the refractive index variation is proportional to the stress variation.
The retardation changes the polarization of transmitted light. In the case of normal incident light, the retardance can be described as
![]()
where d is the glass thickness and λ is the wavelength of the light.
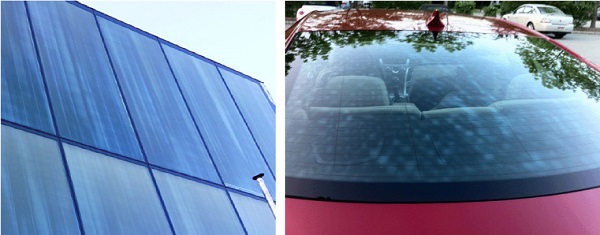
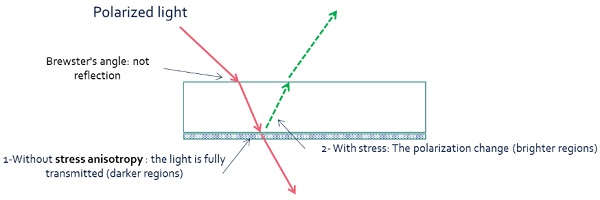
The daylight can be polarised under particular environmental circumstances such as under a blue sky, with incident light reflected on water or on another glass panel, etc... This conditions makes reveal the quench marks even at naked eyes. Looking at the Figure 1, different darker and brighter regions characterising the anisotropy patterns can be noticed in reflection. According to what described above, this can be qualitatively understood thanks to the illustration shown in Figure 3. The darker regions are due to a higher transmission of the polarised light in the areas without stress anisotropy. While the brighter patterns are led by the enhancement of the reflected light due to the change of the polarization led by the birefringence of the glass.
Here, the Brewster’s angle was chosen since at this angle of incidence (near 58° for glass) the light with a particular polarization is perfectly transmitted through a transparent dielectric surface, with no reflection. So, in this configuration the quench marks revelation is expected to be the highest. More generally, the impact of birefringence is minimal if the axis of birefringence is in the p-polarization of s-polarization direction.
2.1. Retardation characterization
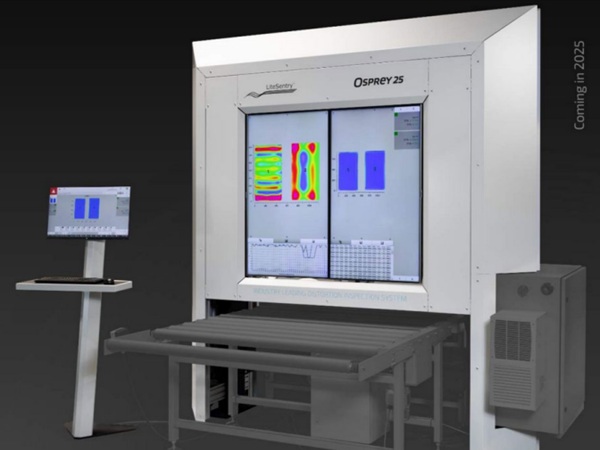
In the last decades, we have assisted to the rapid advancement in glass stress analysis using the photoelasticity and a large number of technique of characterization have been developed (Ramesh 2016). This allowed a faster optimization of the tempering process.
Using in-line scanner for the optical retardation mapping, during the last few yearswe acquired a lot of data on the retardation of glass samples at the output of tempering furnaces. These systematic measurements revealed that glass samples end up usually with retards Γ below 100 nm, the vast majority of them have retards below 50 nm and well-tempered glasses have retards below 20 nm. When speaking of phase delays 𝛿=2𝜋Γ/𝜆 , we obtain delays ranging from 𝜋/13 (20 nm) to 𝜋/5 (50 nm) (unpublished data). Then, it is meaningful to have this in mind for the development of the coating quench mark sensitivity.
3. Quench marks sensitivity
Let us call S(φ,θ,α,λ,Г0) the spectrum where:
- S is either transmission or reflection, i.e., T1, T2, R1 or R2,
- φ is the incident angle,
- θ is the angle of the direction of the birefringence,
- α is the direction of polarization (0° = s-polarized),
- Г0 is the retardation
- λ is the wavelength.
The quench marks visibility can be related to the color difference:
![]()
Meaning that ∆𝐸𝑄M(φ,θ,α,λ, Г0) is the color difference between the sample with or without birefringence obtained for s or p-polarized with an incident angle θ.
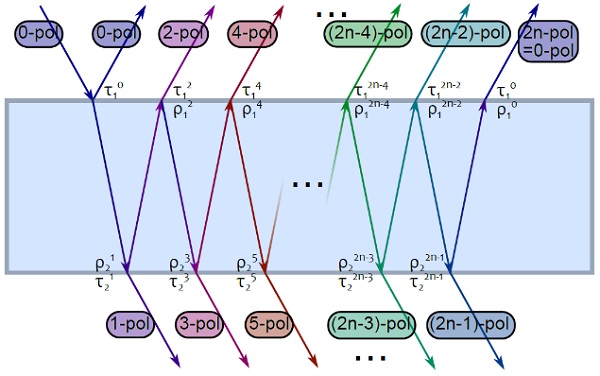
In general, every time the incident beam crosses through the substrate (after internal reflections), the polarization state is modified due to the birefringence. We define the k-polarization state as the polarization of the incident beam that crossed k times the substrate (then after k successive internal reflections), as illustrated by Figure 4. It is worth recalling at this stage that polarization modifications brought by reflections on internal interfaces are not taken into account.
Transmission and internal reflection coefficients
![]()
and
![]()
of the interfaces (i = 1 or 2) in thek-polarization state can be then expressed as linear combinations of transmission and reflection coefficients in polarizations s and p:
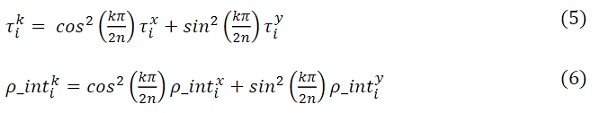
where x is the incident light polarization and y is the linear polarization orthogonal to x ([x, y] = [s,p] or [p, s]). It can be noted that
![]()
and the internal reflection
![]()
With these definitions, we can then formally express the optical response in transmission and in reflection of a d mm glass panel with phase delay δ=π/n, with n an integer greater than 1, and absorbency α, at the angle θ under x-polarized light:
From these spectra, and by comparing them respectively with
![]()
we can compute the color differences between the sample with or without birefringence expressed in the Equation (4). The color difference has been computed with the ∆E defined by the CIEDE2000 (Sharma 2002) in order to better adapt the definition of the color difference with the issue of the "perceptual uniformity”.
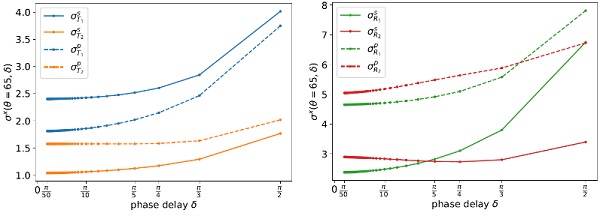
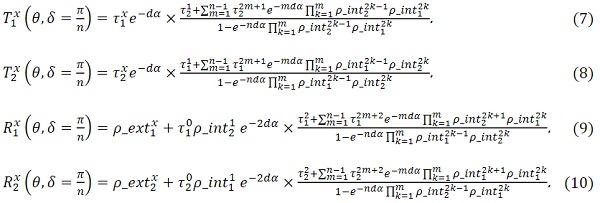
In the Figure 5, we show the calculated pattern visibility σ in transmission and reflection for a typical solar control coating including 3 silver-based functional layers (Ding 2013) on a 10 mm glass panel. Empirically we observed that for small phase delay, 𝜎/𝑠²(𝛿) is constant. Thus, recalling the Equation (1) and with the observation that small phase delays are usually recorded in mind (section 2.1), we finally define the quench mark sensitivity σQM as:
![]()
3.1. Quench marks sensitivity calculation
The quench marks are normally observed on the façade when the skylight is reflected. So, for the estimation of the quench mark sensitivity σQM shown in this paper hereafter we used mainly the spectra of the reflection from glass side under polarized light. We have taken the reflection spectra at 60° since close to the Brewster’s angle the quench marks visibility might be the highest.
By finely characterizing the glass substrate we can compute the transmission and reflection coefficients
![]()
and
![]()
defined above. As a consequence, from the measurements on the coated samples we can determine
![]()
and finally compute the color difference of equation (11).
4. Quench marks observation
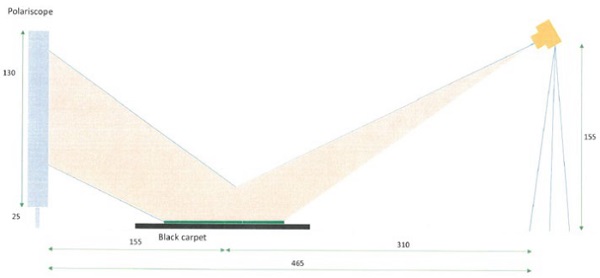
We have established a protocol of observation in order to qualitatively validate the outcomes of the quench mark sensitivity σQM for different solar controls glazing from SAINT-GOBAIN Glass. For these silver-based solar control coatings, we have chosen two categories of stacks including 2 or 3 functional silver layers. The tempered samples placed over a black carpet were taken in photo under controlled conditions of illumination by means of a Nikon-D3300 photo-camera placed at a distance of 3.1m from the center of the sample. The photos acquisition was made with fixed exposition time and white balance. The incident light was p-polarized at 70%. In the Figure 5, we show the configuration of photo acquisition. It was chosen to visualize the collection of pictures on an I-pad tablet since these devices are known to have calibrated and uniform screens which may allow a more reliable visualization with respect to the real scene.
The set of observers (about 30 people), after a short introduction on the principles of the origin of the anisotropy and a first review of the ensemble of the photo, have classified the visibility of the anisotropy quench mark in a range between 1 and 5: 1 not visible; 5 obvious/troublesome marks.
This observation protocol might be not optimal even though the pictures have been taken under controlled and reproducible conditions. Actually, the detector sensitivity, tone mapping, polarization through lens, observation condition (angle, pol, etc...) might alter the reality and lead in wrong perception for some condition. However, we believe that the outcomes are reliable for a qualitative evaluation of the quench mark visibility of the different products.
The 8 products chosen for the observation poll have been classified as follow:
- 2Ag#1 2Ag#2, 2Ag#3, 2Ag#4
- 3Ag#1, 3Ag#2, 3Ag#3, 3Ag#4
for stacks with 2 or 3 functional silver layers, respectively. Each product underwent tempering process with different levels of homogeneity. Each tempering level is labelled by a number from 1 to 5, the homogeneity decreasing with the number. This can be translated as an enhancement of the mean optical retardation accordingly to the levels of tempering strength.
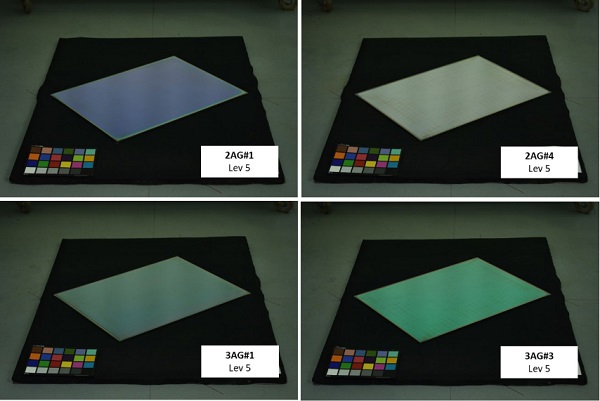
An example of the photos taken for the observation is shown in the Figure 7. At first, by comparing the pictures, we can remark that a high quench marks visibility is not the prerogative of three silver based stacks as argued in the reference (Spiss 2019).
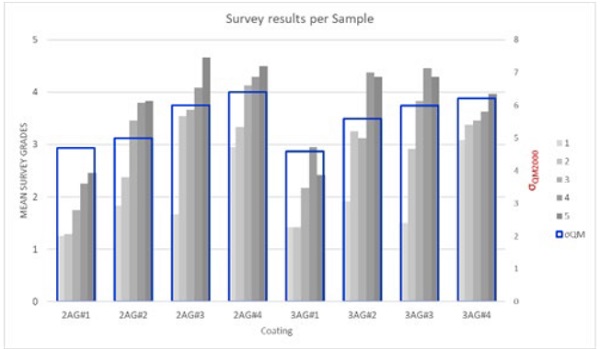
The results of the observation poll for the 8 samples and 5 level of tempering are shown in the Figure 8. On the same graph, we show the σQM determined for the different products as well. From this graph we can retain two main pieces of information. First, the observers are globally sensitive to the strength degree of the tempering. Actually, for a given product, the visibility increases with the tempering strength. The second main conclusion concerns the quench mark sensitivity factor σQM. We notice that the global tendency of detection of the defects from the observers matches with a good level of accuracy the trend of the σQM. So, the global trend suggests a good reliability of the estimated quench mark sensitivity factors.
5. Conclusions
In this paper we have presented a method for the calculation of the capability of a general coating in revealing the quench marks due to the anisotropic stress embedded in tempered glass panes. This is related to the color difference between the sample with or without birefringence expressed as an integral quantity characterizing the coating. The quench marks sensitivity σQM so defined is independent on the glass substrate and it is a property of the coating.
Though it depends on the optical retardation it does not take into account the spatial distribution of the quench marks strongly linked with the tempering method. By means of an observation poll on different solar controls we have validated the reliability of the σQM in evaluating the coating sensitivity to the optical anisotropy.We believe that the σQM described in this paper can be successfully used to define a further coatings specification to be used in the coatings development and it might be very valuable on the architectural point of view being used during the buildings’ façade design.
References
Dix S, Schuler C., Kolling S. In Optics and Lasers in Engineering 153 106998. doi: 10.1016/j.optlaseng.2016.03.017. (2022)
G. Ding, C. Clavero, Silver-based low-emissivity coating technology for energy-saving window applications, in: Modern technologies for creating the thin-film systems and coating pp. 409–431. http://dx.doi.org/10.5772/67085. (2013)
Illguth M, Schulera C, Bucak Ö. Frontiers of Architectural Research 4, 119–126. doi: 10.1016/j.foar.2015.01.004. (2015)
Monnoyer F, Lochegnies D. Heat transfer and flow characteristics of the cooling sys- tem of an industrial glass tempering unit. Appl Therm Eng; 28(17–18):2167–77. doi: 10.1016/j.applthermaleng.2007.12.014. (2008)
Mikkonen A, Aronen A, Rantala M, Karvinen R. Effects of non-uniform heat transfer in a tempering process on glass quality. In: Glass performing days; p. 161–5. (2017)
Ramesh K, VivekRamakrishnan. Digital photoelasticity of glass: A comprehensive review. Optics and Lasers in Engineering 87 59–74. (2016)
Sharma G. Digital Color Imaging Handbook. CRC Press, Inc., Boca Raton, FL, USA, (2002)
Spiss H. Colour of Glass in a Facade, Technology vs Reality & Overcoming the Misunderstanding. Glass Performance Days (2019)