
This paper was first presented at GPD 2025.

Authors:
- Alex Falcon
- Lisa Rammig
Eckersley O’Callaghan, United States of America
Article Information
- Published by Glass Performance Days, on behalf of the author(s)
- Published as part of the Glass Performance Days Conference Proceedings, June 2025
- Editors: Jan Belis, Christian Louter & Marko Mökkönen
- This work is licensed under a Creative Commons Attribution 4.0 International (CC BY 4.0) license.
- Copyright © 2025 with the author(s)
Abstract
The visual impact of architectural glass facades is significantly influenced by the colour perception of coated glass. While glass selection is primarily driven by performance factors such as solar control and thermal properties, aesthetic attributes such as colour are also critical in architectural design. Despite their significance, these aspects remain largely subjective, leading to variations in perceived colour depending on the observer and the lighting conditions under which the glass is evaluated. Factors such as daylight variations and viewing angles further complicate colour assessment, making it difficult to accurately predict the true appearance of coated glass. Conventional selection methods rely on visual inspection and qualitative descriptions, which lack precision and may introduce misleading expectations for architects and designers. This study presents a systematic approach to coated glass selection through colorimetry analysis based on the CIE Lab* colour space, a standardized model for quantifying colour perception. By analysing both reflected and transmitted light properties, this method provides an objective framework for assessing glass colour. The integration of spectral data into the selection process enhances accuracy in colour quantification, enabling architects and designers to make informed, data-driven decisions in architectural glass facade design. The application of colorimetry streamlines the glass selection process by minimizing the impact of perceptual discrepancies and ensuring consistency in the assessment of coated glass. This study emphasises the importance of transitioning from subjective evaluation methods to a physics-based approach for achieving more precise and reliable evaluations of coated glass colour.
1.Introduction – Problem statement
Coated glass in architectural facades plays a significant role in contemporary architectural design, serving not only as a functional element for solar and thermal control but also as a key contributor to the visual character of the building envelope and therefore its appearance. With the increasing demand for high-performance building skins, advancements in glass coating technologies have enabled manufacturers to develop products that balance energy efficiency with aesthetic appeal. However, while performance metrics such as U-value, solar heat gain coefficient (SHGC), and visible light transmittance (VLT) are standardized and well-documented, the evaluation of visual attributes - particularly colour- remains largely subjective.
Architects and designers often evaluate glass through visual inspection of sample mock-ups. This process is typically followed by qualitative descriptions of the perception of glass that lack precision and are largely subjective. Typically, a level of transparency is described as well as tonality; i.e blueish, greenish, greyish, and well as a level of neutrality and reflectivity.
Additional factors like ambient conditions such as daylight variations, viewing angles, and individual perception of colour, further complicate the assessment, making it difficult to accurately compare different glazing make-ups and coatings. Limited sizes used for the comparable reviews and the difficulty to duplicate the spatial and ambient conditions of a building, make it challenging to predict the true appearance of coated glass when installed on the completed building.
As a result, architects, designers and owners may develop expectations that do not align with the glass appearance achievable in its final application.
This paper investigates the integration of colorimetric analysis into the architectural glass selection process, with a focus on utilizing spectral data to quantitatively characterize colour attributes. The objective is to establish a systematic framework that enables a shift from conventional, perceptionbased evaluation methods toward a numerical approach grounded in the physics of light and material interaction. By integrating this colour evaluation method into the standard workflow for selecting coated glass, the study seeks to enhance consistency, reduce subjectivity, and support more informed aesthetic decisions in glass facade design.
2. Human perception - Transparency and colour
Transparency is defined as the physical property of a material that allows light to pass through it without significant scattering. Light interacts with different materials in various ways: metals appear shiny due to surface reflection, whilst water and float glass appear clear because they transmit light with minimal distortion. Stained glass and gemstones, on the other hand, selectively transmit certain wavelengths (colours) while absorbing or reflecting others. Materials like milk or acid-etched glass appear white because they scatter light in all directions (Fox, 2001).
The optical behaviour of most solid-state materials can be understood through a few fundamental phenomena: reflection, absorption, and transmission. These processes determine how light interacts with a material (Figure 1). When light strikes an optical surface, some of it is reflected off the external surface. The rest enters the material, where part of it is absorbed (or internally reflected), and the remaining portion is transmitted through the medium (Rammig, 2022).
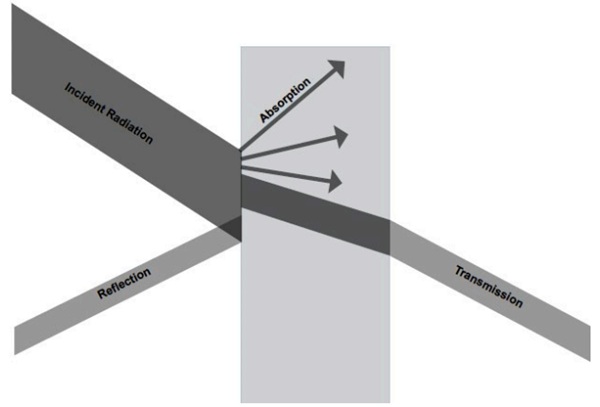
When light passes through a medium (like glass), several key optical phenomena must be considered in addition to transmission, and reflection: refraction, absorption, scattering, and the perception of light and color.
2.1. Refraction
Refraction is the change in direction of light as it passes from one medium to another due to a change in its velocity. This bending of light rays is governed by Snell’s Law, which states that the ratio of the sines of the angles of incidence (θ1θ1) and refraction (θ2θ2) is equal to the inverse ratio of the refractive indices (ηη) of the two media:

This principle is fundamental in determining how light propagates through transparent and translucent materials (Reinhart, 2014).
2.2. Absorption
Absorption occurs when the frequency of the incident light matches the natural resonant frequency of the atoms or molecules in the material. In such cases, the energy of the light is absorbed and converted to other forms (e.g., heat). Absorption is intrinsically linked to transmission; only the light that is not absorbed will continue to propagate through the material. In glass, selective absorption contributes to the observed body color and influences the color of transmitted light (Shelby, 2005).
3. Perception of light and colour in relation to ‘transparency’
The concept of transparency, as used in architectural discourse, often diverges from its strict physical definition. In many cases, terms such as neutrality or clarity more accurately capture what is implied by "transparency" in architectural descriptions of glass appearance. This perceived transparency is significantly influenced by both the body color of the glass and the color of the transmitted light, which together shape our visual experience of glass surfaces, glazed façades, and windows.
Understanding how we perceive these effects requires insight into the fundamentals of human vision. Unlike most mammals, which exhibit dichromatic vision—and can perceive primarily blue and green wavelengths—humans possess trichromatic vision. This allows us to distinguish between blue, green, and red light, forming the basis for our rich color perception. The way glass interacts with and modifies these wavelengths has a direct impact on how transparent or colored a surface appears to the human eye.
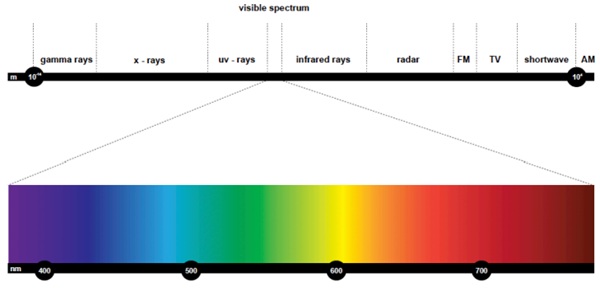
The visible light spectrum lies between the ultraviolet (UV) and infrared (IR) regions of the electromagnetic spectrum (Reinhart, 2014). While we commonly refer to light as being "coloured," it is important to note that light itself is not inherently coloured. Colour is a perceptual phenomenon, created in the human brain as a response to light entering the eye. Consequently, color perception can vary significantly between individuals.
The human eye contains three types of cone photoreceptors, each sensitive to specific ranges of wavelengths. These cones are often referred to as short (S), medium (M), and long (L) wavelength receptors, roughly corresponding to blue, green, and red light sensitivity, respectively. When light enters the eye, it stimulates these cones to varying degrees depending on its spectral composition. The signals generated by the cones are then processed by retinal neurons and subsequently interpreted by the brain, where the experience of colour is formed.
For example, light with a wavelength of approximately 570 nanometres (nm) stimulates both the red and green cones. The brain integrates this input and perceives the resulting color as yellow. The human visual system is sensitive only to electromagnetic radiation within the wavelength range of approximately 380 to 780 nm (Reinhart, 2014) (Figure 2).
Glass is transparent, but it is not inherently colourless. Its slight coloration is primarily attributed to the presence of metal oxides in its chemical composition (Shelby, 2005). In conventional soda-lime float glass, a faint green tint is typically observed, resulting from the iron content in the raw materials, particularly silica sand.
To address this inherent coloration, low iron and semi-low iron glass products have been developed and are commercially available. These variants significantly reduce the green hue associated with standard float glass. For example, traditional float glass contains approximately 800 parts per million (ppm) of iron, whereas low iron glass reduces this to around 200 ppm.
The green tint in conventional float glass becomes especially noticeable when sunlight interacts with the material and is most pronounced at the edges of the glass, where the light path is longest. This is due to the path length effect: the thicker the glass, the more iron ions the light must pass through, thereby increasing the intensity of the observed color.
Understanding these optical characteristics is critical in architectural design, especially in applications where visual neutrality, clarity, or color consistency are essential.
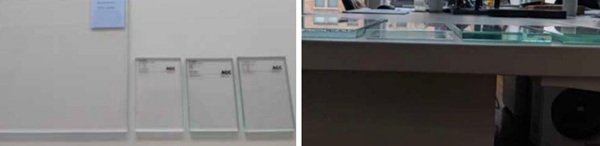
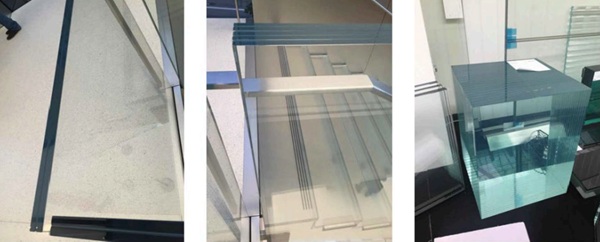
Figure 3 illustrate the impact of iron content on the visual appearance of glass, most notably at the material’s edge. Even glass that appears clear when viewed face-on may reveal a distinct coloration—typically green—along its edge. This edge coloration becomes more prominent in standard float glass due to its higher iron content.
As a result, low iron glass is often the material of choice for structural glazing applications, especially where multi-ply laminates are used, and the edges remain exposed. In contrast, for fenestration systems or curtain wall assemblies, where the edges are usually concealed by frames or silicone joints, the need for low iron glass is less critical (Rammig, 2022).
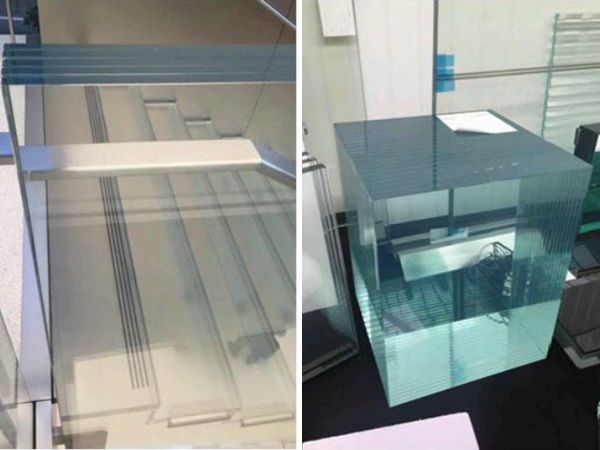
While edge coloration is the most noticeable manifestation, the green tint caused by iron content is also visible through the plane of the glass, particularly in thicker sections (Figure 4). This is due to the increased light path length, which enhances the absorption of specific wavelengths and amplifies the perceived tint. The relationship between material thickness and visual appearance is quantitatively expressed through Visible Light Transmission (VLT) measurements: as thickness increases, more light is absorbed, and the greenish hue becomes more apparent.
This optical behaviour has significant implications in architectural applications where clarity, color neutrality, or aesthetic precision is critical, such as in museum cases, glass staircases, or high-end retail storefronts (Rammig, 2022) however it also plays a critical role in the appearance of coated glass, as a slight increase in tint within the substrate can shift the perception of the appearance of a coating.
While VLT can be an indication for an increase in colour saturation in the substrate, based on the concept of the relationship between reflection, absorption and transmission equaling 1, contemporary high-performance coatings are highly selective and therefore the appearance of colour cannot be directly correlated with VLT.
To be able to identify the colour range, saturation and lightness, colorimetry using spectral data can be employed.
4. Colorimetry
Colorimetry offers a physics-based approach to addressing some of these limitations by quantifying colour tendencies and intensity using numerical values and comparing on this basis in addition to the traditional comparative review of glass panels. The CIE Lab* colour space, recognized for its perceptual consistency, enables accurate representation of both reflected and transmitted colours.
It was created by the Commission Internationale de l'Éclairageas as part of an effort to provide a perceptually uniform colour space, meaning that the same amount of numerical change in the values defined through Lab*, corresponds to about the same amount of visually perceived change. This made it particularly useful for applications like colour difference calculations (ΔE), colour management, and digital imaging.
In glass, this can be achieved through the use of spectral transmittance and reflectance data, which is already widely available from glass manufacturers for assessing solar and thermal performance of coated glass.
The spectral data is typically recorded across a broad wavelength range—approximately 300 to 2500 nm—to support energy performance calculations, including SHGC and VLT. Within this range, the visible light spectrum (approximately 380 to 780 nm) is particularly relevant for colour analysis. These spectral datasets can also be used to calculate chromatic attributes by analyzing how much light is reflected and transmitted at different wavelengths of visible light. By applying standardized methods that simulate how the human eye perceives colour under specific lighting conditions, this approach helps identify the main colour tones of coated glass based on the reflected and transmitted light waves.
The dual use of spectral data not only leverages information already available from manufacturers but also establishes a framework for the objective assessment of colour appearance. Integrating this method into the glass selection process enhances the accuracy of colour quantification and supports more informed aesthetic decisions in architectural glass facade design.
4.1. CIE Lab* colour space
When assessing the uniformity of other cladding materials like stone, terracotta or metal panels in buildings—especially for aesthetic consistency across panels, tiles, or batches—ΔE (Delta E) is used to quantify colour differences between material samples. This ensures that different pieces of stone or terracotta match closely enough in color to meet design or quality requirements.
For uniformity in glass coatings, the same criteria is typically used to specify a ΔE limit, based on ASTM 1072, but it is typically only verified through testing if large visible differences occur and adherence to specification criteria is questioned. It is not commonly part of the assessment of glass coatings in the design process.
Typically, only the ΔE is determined based on the following equation:
![]()
Where:
- L*: Lightness.
- a*: Red-green axis.
- b*: Yellow-blue axis.
Facade performance specifications will be based on a maximum ΔE, which defines the difference in variation overall, rather than specifically identifying where in the colour space the sample is located.
4.2. Spectral Data
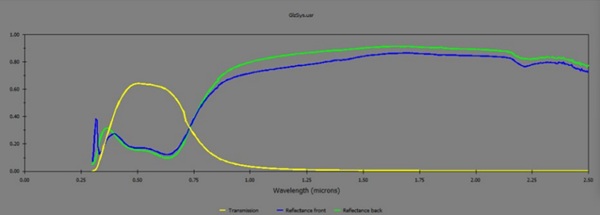
Spectral data is a set of values that describe how a material—such as coated glass—interacts with light across different wavelengths. Spectral data is obtained by measuring how much light is transmitted and reflected after a beam of light is split into its component wavelengths. These optical interactions vary depending on the wavelength, and spectral data captures this variation by providing wavelength-specific numerical values for transmittance and reflectance. Typically, spectral measurements span from 300 to 2500 nm, a range that includes ultraviolet (UV), visible, and nearinfrared (IR) regions of the electromagnetic spectrum. The data is usually recorded as normalized values between 0 and 1, where 1 represents 100% transmission or reflection at a given wavelength. Figure 6 shows an example of a spectral distribution curve for a coated insulated glazing unit (IGU), showing how its optical performance changes across the spectrum. The graph shows that light between approximately 300 and 740 nm is predominantly transmitted, with a peak transmittance of about 69% occurring near 500 nm. Around 740 nm, the relationship between transmitted and reflected light reverses: reflected light begins to increase while transmitted light decreases. In other words, the coated IGU allows most visible light (approximately 380 to 740 nm) to pass through, whilst reflecting a significant portion of the near-infrared (NIR) spectrum, which results in high VLT and low SHGC, making it effective for daylight while minimizing solar heat gain.
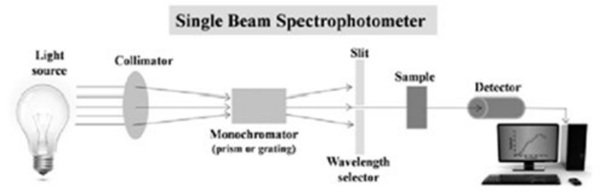
Spectral data is typically measured using an optical spectrometer, a laboratory instrument that analyses the interaction of light with a material—such as coated glass—across a specific portion of the electromagnetic spectrum. A typical spectrometer setup consists of the following components:
- Light source: A broad-spectrum light source emits light covering the UV, visible, and IR regions, typically spanning from 300 to 2500 nm.
- Wavelength dispersion element: The emitted light passes through a monochromator or diffraction grating that separates the light into narrow, single-wavelength bands. • Sample interaction chamber: The monochromatic light is directed toward the glass sample. Three measurements are typically taken:
o Transmittance: A detector placed directly opposite the light source captures the amount of light that passes though the sample.
o Front reflectance: A detector positioned at a specific angle (often neat 8° from the incident beam) measures the light reflected off the exterior (exposed) surface of the sample.
o Back reflectance back: The sample is typically reversed or placed on a second measurement position so that the coated or interior surface now faces the incident light. A second reflectance measurement is taken, analogous to the front reflectance procedure, capturing how light is reflected off the inner face of the glass.
- Detector and calibration: This instrument compares the measured intensities to those from a known reference material (such as a calibrated mirror). This step ensures that the transmittance plus reflectance values are less than 1 (or 100%) for accurate measurements.
The resulting spectral dataset contains a list of discrete wavelengths—often recorded in 5 nm increments—alongside their corresponding transmittance and reflectance values.
Beyond performance analysis, spectral data can also be used to calculate chromatic attributes by weighting the transmitted and reflected light intensities across the visible wavelengths according to standard observer functions and illuminants (standardised methods for human vision and lighting conditions). This process enables the derivation of dominant wavelengths and overall colour characteristics of coated glass under defined lighting conditions.
4.3. Calculation of color properties
CIE Lab* colour values for coated glass can be calculated in LBNL’s Window software, provided that each glazing layer has an associated spectral data file. These calculations follow the recommendations outlined in ASTM E308 Standard Practice for Computing Colors of Objects by Using CIE System, and require three additional data files that define the conditions for colour evaluation:
- CIE64T.DAT: This file contains the spectral colour matching functions X10, Y10, Z10 for the CIE 1964 Supplementary Standard Observer with 10° field of view. These functions define how a standard human observer perceives different wavelengths of light and are used to convert spectral data into chromaticity coordinates.
- CIE64C.DAT: This file contains the coordinates of the spectrum locus, which is the boundary of all perceivable colours in the chromaticity diagram. It is used for plotting colour positions and determining the dominant wavelength and purity of the resulting colour.
- ILLD65.DAT: This file contains the spectral power distribution of Illuminant D65, a standardized representation of average daylight. These functions define the light source under which colour perception is simulated, so that colour calculations reflect typical daylight viewing conditions.
The CIE Lab* colour properties are derived from chromaticity coordinates, which represent the colour appearance of the glazing system under the defined light source. These coordinates are calculated using spectral values for transmittance and reflectance, weighted by the colour matching functions and the illuminant distribution. The color values based on transmittance are of interest for color perception of an observer located inside a building. The colour values based on reflectance are of interest for colour perception of an observer located outside the building.
4.4. Chromaticity coordinates
The chromaticity coordinates x, y, and z are calculated using the total tristimulus values X, Y, and Z, as per the equations below:
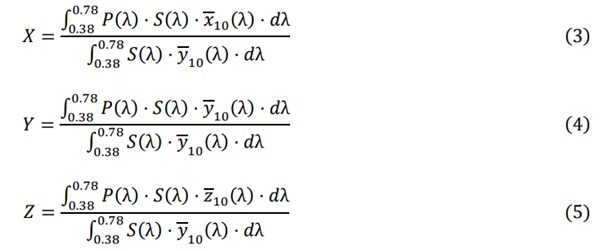
Where λ is the wavelength in microns (0.37-0.78, visible spectrum), P(λ) is the spectral value of the property under consideration (transmittance or reflectance, depending on which is being calculated), S(λ) is the spectral power distribution of the illuminant (D65, representing average daylight), X10(λ) and Y10(λ) are the CIE 1964 10° standard observer colour matching functions for the X and Y channels (red and green/lightness channels, how sensitive human eyes are to different wavelengths in terms of “redness” and “greenness/lightness”). The spectral weighting functions of the illuminant are given every 5 nm. Both the illuminant values and the standard observer functions are fixed values given by ILLD65.DAT and CIE64T.DAT files, defining average daylight and how the average human eye responds to each wavelength.
Tristimulus values (X, Y, and Z) quantify how the human eye perceives color by simulating the response of the three types of cone cells in the human eye, each sensitive to different regions of the visible spectrum. The CIE system defines X, Y and Z as mathematical integrals that combine the spectral distribution of the light source (i.e., daylight), the spectral properties of the material (i.e., transmittance or reflectance of glass), and the colour matching functions that model the eye’s sensitivity to red, green, and blue regions of the spectrum. In other words, the numerator in the formula is a weighted sum of the light that passes through the glass (or is reflected), comes from the light source (the sun in a sunny day), and that contributes to the perception of red, green/lightness, or blue (𝑥⁻10 , 𝑦⁻10 , 𝑧⁻10 respectively). The denominator is a normalization factor that calculates the total perceived brightness of the light source (Y tristimulus) without the material being measured.
Each tristimulus value corresponds to a specific perceptual dimension:
- X: Broadly represents sensitivity to the red region.
- Y: Weighted towards the green region and corresponds to luminance (perceived brightness).
- Z: Captures sensitivity in the blue region.
Together, tristimulus values describe the full colour stimulus and are used as a reference point to derive additional colour metrics such as chromaticity coordinates and CIE Lab* values.
The chromaticity coordinates (x, y) are obtained by normalizing the tristimulus values calculated following the formulas above.
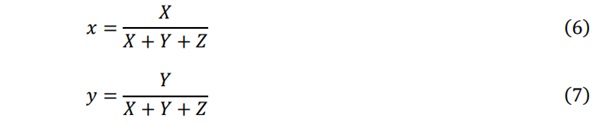
Once the chromaticity coordinates of the sample are known (x, y), the colour property values can be calculated.
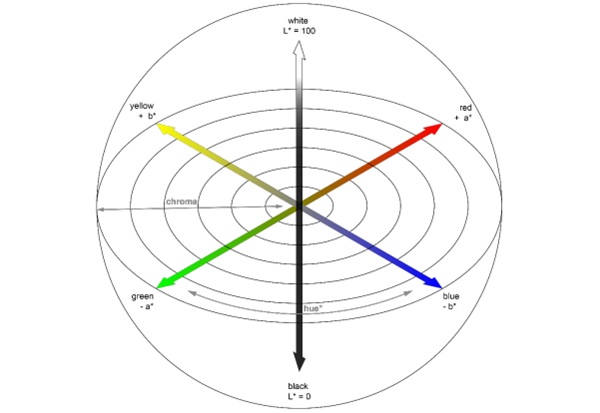
4.5. Calculation of the CIE Lab values
CIE Lab values can be calculated in LBNL’s Window software when the glazing layers include appropriate spectral data. These values define the colour of a sample within the CIE Lab uniform colour space, which is designed to approximate human visual perception of colour differences. The colour space is structured around three perpendicular axes:
- The L* axis represents lightness, ranging from 0 (black) to +100 (white). The L* axis passes through the intersection 0,0 of the a* and b* axis.
- The a* axis represents the green-red component, ranging from -150 (green) to +150 (red).
- The b* axis represents the blue-yellow component, ranging from -150 (blue) to +150 (yellow).
Unlike RGB colour models, the CIE Lab colour space is intended to be perceptually uniform, which means that the same amount of numerical change in these values corresponds to roughly the same amount of perceived visual colour difference.
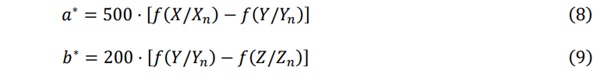
The Lab* coordinates are mathematically derived from the normalized tristimulus values X/Xn, Y/Yn, and Z/Zn. X, Y, and Z are the normalized tristimulus values of the sample, and Xn, Yn, and Zn are the tristimulus values of a reference white point, which defines what “white” means under a specific lighting condition and is based on the standard illuminant D65 (typical daylight). Equations 8 and 9 define how a* and b* coordinates are determined. The constant multipliers (500 and 200) serve to scale the colour differences into perceptually uniform values and have been empirically determined based on experimental psychophysical studies of human colour perception. These constants amplify the redgreen and blue-yellow differences to match and balance human perception. The a* and b* ratios are then transformed through a non-linear function to model the non-linear response of the human vision.
For 𝑌/𝑌𝑛 > 0.008856:
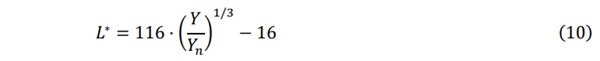
For 𝑌/𝑌𝑛 ≤ 0.008856:

where:
![]()
and:
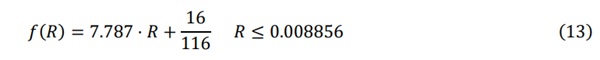
Two separate forms of the transformation function are used based on whether the ratio exceeds a threshold (0.008856). This ensures that the transition between dark and bright colours is smooth.
5. Colorimetry visualization – in-house approach
Eckersley O’Callaghan has developed an in-house approach to utilize available spectral data of coated glass products and translate it into a quantitative colour map based on the CIE Lab* colour space. This method supports the evaluation of both transmitted and reflected colour characteristics under standard illuminants and observer conditions, following the previously explained principles of colorimetry. By converting spectral transmittance and reflectance into Lab* coordinates, the approach offers a framework to interpret colour appearance.
To implement this colorimetry approach, a multi-step workflow was developed combining spectral data analysis with spatial visualization. First, spectral data files for each individual glass layer are imported into LBNL Optics 6, where the overall spectral transmittance and reflectance of the glazing assembly is calculated using the physical equations previously outlined. From this spectral profile, CIE Lab* values are extracted for both transmitted and front-reflected light—whilst back reflectance values can also be computed, this paper focuses on the front reflectance to demonstrate the method and its relevance for facade applications—.
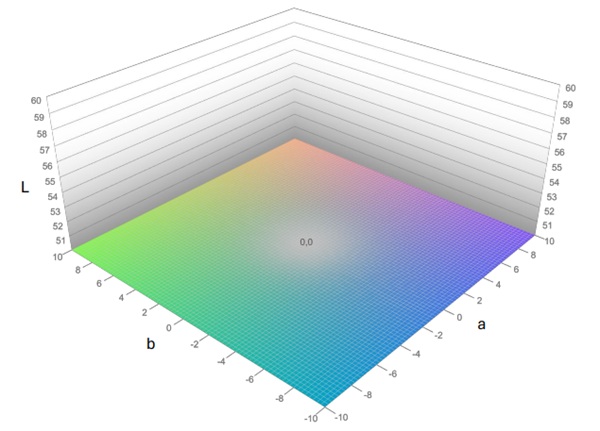
In a second step, the calculated CIE Lab* values are imported into Rhino Grasshopper, where a custom code was developed to map each colorimetric data point onto a three-dimensional spatial model. Each set of values (L*, a*, b*) is interpreted as a coordinate (x, y, z) in the 3D space: the a* and b* chromaticity values define the point’s location on the XY plane, while the L* value (lightness) is assigned to the Z-axis of the graph. The chromatic structure of the mesh is informed by the a* and b* values, with gradient colorations across the XY domain corresponding to the perceptual organization of the CIE Lab* colour space. Colour transitions converge smoothly toward grey at the origin (0,0), representing chromatic neutrality. These transitions are implemented using Gaussian fade functions to reflect the non-linear perceptual scaling inherent to the CIE Lab* space. Figure 8 depicts the empty three-dimensional spatial mesh onto which the sample points are subsequently mapped.
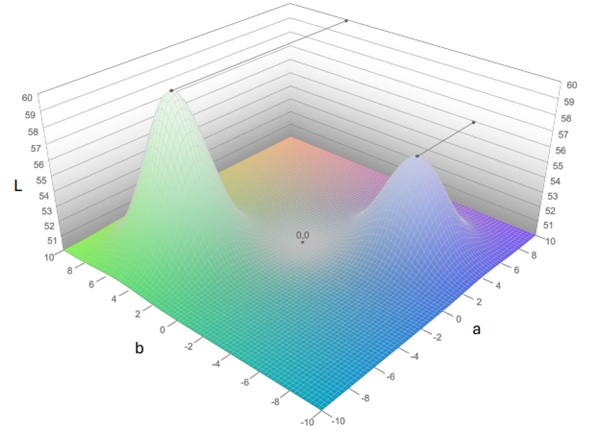
L* values define the vertical position of each sample point within the spatial mesh. Each point acts as an attractor that displaces vertically adjacent mesh vertices, with the influence diminishing gradually with distance, following a Gaussian decay function. This produces a continuous surface deformation that relates directly to the sample’s lightness. Just as the chromatic transitions across the XY plane fade smoothly toward grey at the origin (0,0), the vertical deformation also incorporates a fading effect in colour: as height increases, the colour gradually shifts toward white, representing higher lightness values. Near the XY plane, colours appear more saturated, while the tips of the deformations— corresponding to higher L* values—are visually blended with white. This approach results in a topographic mesh in which both chromaticity and lightness are spatially encoded, using Gaussian functions to reflect the non-linear perceptual structure of the CIE Lab* colour space.
Figure 9 depicts a deformed three-dimensional spatial mesh generated from the L* values of the sample points. The projection of the L* values on either of the adjacent vertical meshes facilitates the visual comparison of the relative lightness across the sample points.
While these graphs are often presented as static images in documentation, the 3D mesh is in practice, an interactive model within Rhinoceros. This allows architects and designers to explore the spatial distribution of colour data by rotating, zooming, and evaluating the relationships between coated glass samples in the perceptual colour space. Such interaction facilitates the understanding of how individual samples compare to one another, particularly with respect to the chromatic neutrality point at the origin (a*=0, b*0), and the lightness, which represents achromatic neutral colours, and mix with white, respectively.
The position of each sample point within the quantitative 3D graph can be directly correlated with physical glass samples, providing a numerical representation of their chromatic tendency and lightness (L*). This approach supports a more informed, data-driven evaluation of reflected and transmitted colour appearance of coated glass products, bridging the gap between spectral data and visual perception of glass in architectural applications.
5.1. Tool validation – Case studies
To validate the colorimetry approach, three groups of glass products were analyzed.
- The first group included uncoated monolithic substrates low-iron, mid-iron, and standard clear glass substrates.
- The second group comprised commercially available coated IGUs.
- The third group focused on more complex glazing assemblies combining laminated IGUs with embedded solar coatings plus low-e coatings facing the IGU gap.
Uncoated monolithic substrates
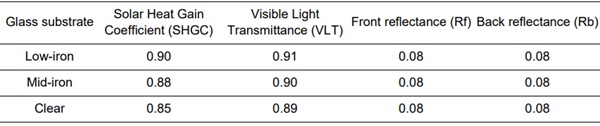
The first group analyzed included monolithic, uncoated glass substrates—specifically low-iron, midiron, and standard clear float glass—. This initial comparison was selected as a starting point due to its familiarity and relevance within the architectural glass industry. Low-iron glass is widely recognized for its increased transparency and more colour-neutral appearance, resulting from a reduced iron content in its mix. In contrast, mid-iron and clear glass exhibit a characteristic green hue than intensifies with thickness, attributed to higher iron content compared to low-iron glass. Since these samples were uncoated, their optical behaviour is driven solely by the material properties of the glass itself—primarily its spectral transmission characteristics—without the additional complexity introduced by spectrally selective coatings. Table 1 presents the optical properties of the glass analyzed, which were calculated following the NFRC 100 standard method.
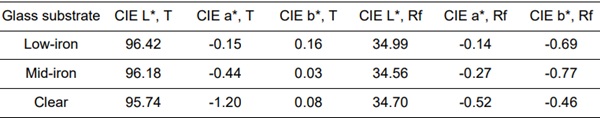
Table 1: Optical properties of substrates analyzed.
Spectral data files for each glass substrate were imported into LBNL Optics 6 to calculate their overall spectral transmittance and reflectance characteristics. CIE Lab* values were calculated for both transmitted and front-reflected light. These values represent the perceived colour of each glass type under standard illuminant and observer functions. Table 2 summarizes the resulting CIE Lab* values for transmission and front reflectance for the glass substrates analyzed.
Table 2: CIE Lab* values for each substrate.
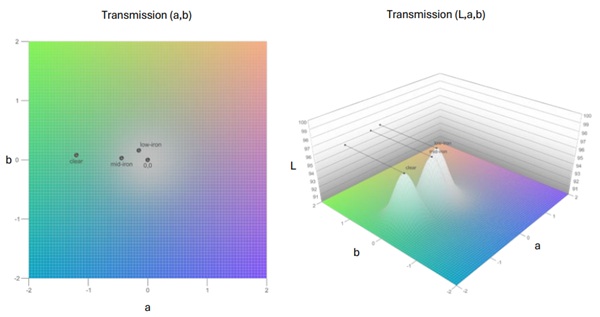
The calculated CIE Lab* values were imported into the custom code in Rhino Grasshopper, where each data point was mapped onto the three-dimensional spatial model. Figure 10 illustrates the spatial distribution of the transmitted light colour for the three glass substrates analyzed. The graph on the left represents the top-down view (XY plane) of the CIE Lab* chromaticity space, allowing direct comparison of the hue and chroma between the samples. The graph on the right incorporates the L* value (lightness) as a Z-axis displacement of the topographic mesh. As shown, low-iron glass transmits a light colour closer to the chromatic neutrality origin (a*=0, b*=0), indicating a more desaturated appearance, while mid-iron and clear glass tend toward the green region of the colour space, with higher chroma values. The addition of the Z-axis visualization confirms that low-iron glass not only exhibits a less saturated coloration but also has a higher lightness value (L* = 96.42), corresponding to a visually brighter and whiter appearance. The side-by-side display of the 2D and 3D graphs facilitates an integrated analysis of hue, chroma, and lightness.
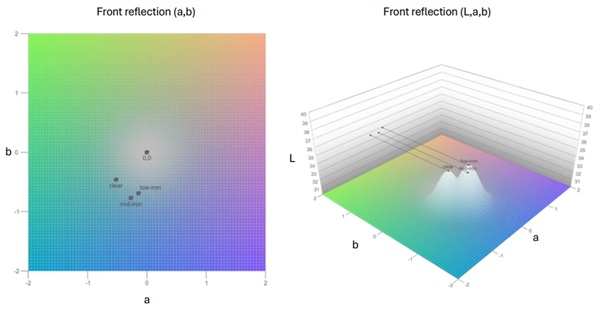
A similar graphical analysis of the spatial distribution of the front-reflected light colour is presented in Figure 11. As shown, low-iron glass reflects a slightly blue hue, mid-iron glass reflects a slightly more saturated blue tone, while clear glass reflects a hue shifted toward green. Despite these hue variations, all three substrates exhibit comparable chroma levels, with a chromatic distance (ΔE*) values ranging between 0.7 and 0.8 from the neutral origin (a*=0, b*=0). However, differences in lightness are observed in the 3D graph: low-iron demonstrates a higher lightness value (L* = 34.99), indicating a brighter and whiter reflected colour in comparison to mid-iron and clear glass.
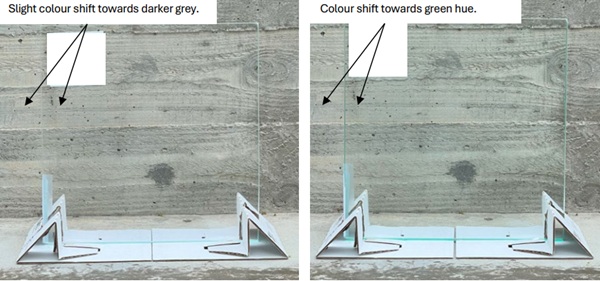
The results of the colorimetry analysis were compared with physical glass samples of low-iron and clear glass substrates of identical thicknesses. Figure 12 presents photographs of the samples under daylight conditions. The transmitted colour differences are particularly evident when observing the background materials—particularly the concrete wall and the white section of the sample holder— through each glass type. Behind the low-iron sample, the colour of the concrete wall appears of a slightly darker grey compared to the uncovered area, while the white sample holder has a slight grey, near-neutral tone. In contrast, the clear glass sample has a noticeable green tint to both background materials. These visual comparisons of physical samples are consistent with the results of the CIE Lab* analysis.
Insulated glazing units with low-e coatings on surface #2.
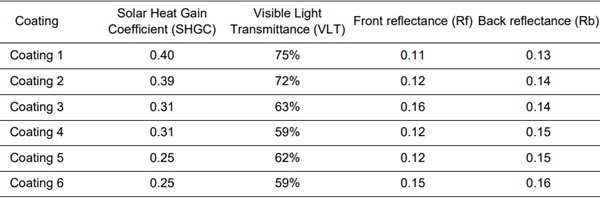
The second group of samples analyzed consisted of insulating glass units (IGUs) with low-e coatings facing the IGU gap. This group included six commercially available coated glass products, selected to represent a range of SHGC and VLT values. The coatings were organized into three subsets—SHGC ~0.40, SHGC ~0.30, and SHGC ~0.25—allowing for a comparative analysis of how different spectral selectivity influence the perceived colour of transmitted and reflected light. Unlike uncoated monolithic glass substrates, low-e coatings selectively reflect IR and, to various extends, visible wavelengths, which introduces additional complexity in colour perception. Table 3 presents the optical properties of the coated IGUs analyzed, which were calculated following the NFRC 100 standard method.
All IGUs have the same make-up, from exterior to interior: 6mm low-iron glass with low-e coating on surface #2 – 12mm cavity filled with argon at 90% - 6mm low-iron glass.
Table 3: Optical properties of coatings analyzed.
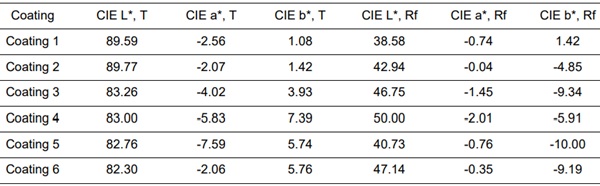
Similarly to the colorimetry analysis of uncoated monolithic substrates, spectral files for each glazing layer were imported into LBNL Optics 6 to build the glazing assemblies for analysis. CIE Lab* values were calculated for both transmitted and front-reflected light. Table 4 summarizes the resulting CIE Lab* values for transmission and front reflectance for the coated IGUs analyzed.
Table 4: CIE Lab* values for coated IGUs.
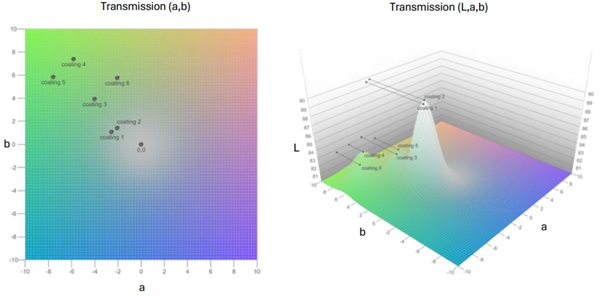
The calculated CIE Lab* values were imported into the custom code in Rhino Grasshopper, where each data point was mapped onto the three-dimensional spatial model. Figure 13 illustrates the spatial distribution of the transmitted light colour for the coated IGUs analyzed. Coatings 1 and 2, corresponding to the highest SHGC values, exhibit transmitted colours located near the chromatic neutrality origin (a*=0, b*=0), indicating a relatively desaturated appearance. In contrast, Coatings 3 and 4, tend toward green-yellow hues, with Coating 4 positioned farther away from the origin, suggesting a higher chroma value and this, a more saturated appearance than Coating 3. Among all samples, Coating 5 is positioned farthest away from the chromatic neutrality point, reflecting the highest saturation of transmitted colour. The 3D mesh additionally displays the differences in lightness of the coatings: Coatings 1 and 2 not only appear less saturates, but also exhibit higher L* values, corresponding to a brighter or visually whiter transmitted light appearance. A general trend can be observed across the graphs: Coatings with higher SHGC values also exhibit higher L* values, whereas coatings with lower SHGC tend to exhibit darker transmitted colour.
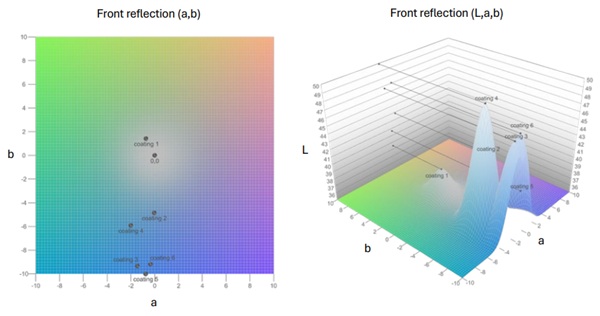
A similar spatial analysis of the front-reflected light colour is presented in Figure 14. Coating 1 is positioned closest to the chromatic neutrality point, but with a relatively low lightness value (L* = 38.58), resulting in a neutral yet darker reflected appearance. Coatings 3 and 4 exhibit blue hues reflected colours with a moderate to high saturation. Coating 4 has the highest lightness value among all coatings analyzed (L* = 50.78), an indication that the reflected blue hue is mixed with a large component of white. Coating 3 follows a similar patter with a lightness value of (L* = 46.75). Coating 5 reflects a highly saturated blue hue, located far from the origin in the chromatic plane, and with a lower lightness value (L* = 40.73), indicating a darker, more intense reflected colour.
The results of the colorimetry analysis were compared with physical samples of coated IGUs. Figure 15 presents photographs of one representative sample for each SHGC range analyzed—Coating 1, Coating 3, and Coating 5—.
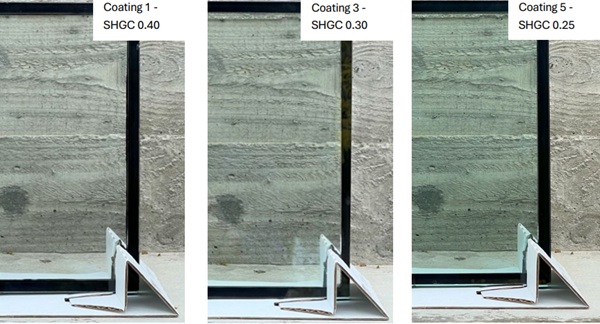
The results of the colorimetry analysis were compared with physical glass samples. Differences in the transmitted colour are clearly seen when observing the background materials behind the samples. Behing Coating 1 sample, the concrete wall appears as a slightly darker grey relative to the portion of the wall that is uncovered, while the white sample holder shows a subtle grey-green, near-neutral tone. In contrast, Coating 3 and Coating 5 introduce a more saturated green hue to both the concrete wall and the sample holder, with Coating 5 showing the strongest green hue. This visual comparison aligns with the colorimetry analysis results, where Coating 5 chromatic sample point is the farthest from the chromatic neutrality point (a*=0, b*=0). Differences in lightness (L*) are also evident in the photographs: Coatings 3 and 5 display not only higher colour saturation but also lower lightness values, resulting in a darker appearance. This contrast is particularly evident when comparing Coating 1 and Coating 3, where Coating 3 appears both greener and darker, whereas Coating 1 maintains a near-neutral tone with the highest L* value among the samples.
These visual comparisons of physical samples are consistent with the results of the CIE Lab* analysis.
Laminated insulated glazing units with embedded solar coatings plus low-e coatings on surface #4.
The third group analyzed consisted of laminated IGUs that combined solar control coatings embedded adjacent to the interlayer with additional low-e coatings applied adjacent to the IGU gap. This third comparison was performed to introduce the increased complexity that arises from combining multiple coating types, each with distinct spectral performance, and to quantify the resulting shifts in the perceived colour compared to single-coating configurations. Unlike the previous groups, where coatings were applied individually, this configuration involved layered spectral effects as solar coatings primarily affect the shorter visible and IR wavelengths, while low-e coatings balance thermal performance and selectively reflect portions of the solar spectrum. This combination of coatings can produce non-intuitive changes in both the transmitted and reflected light colour. The analysis also aimed to assess how the combination of coatings shift the chromatic coordinates and lightness values relative to a more simple single-coating configuration.
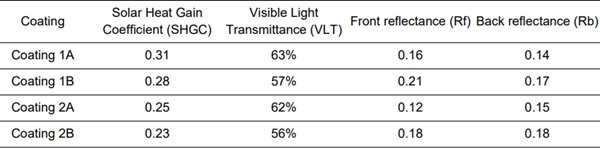
For this part of the study, Coating 3 and Coating 5 were selected from the previous analysis due to their relatively high colour saturation, making them suitable reference points for assessing colour shifts introduced by multi-coating configurations. In this section, these coatings are referred to as Coating 1A and Coating 2A, respectively. Coating 1B and Coating 2B are identical to 1A and 2A in terms of their base low-e coating but include an additional solar control coating embedded adjacent to the interlayer within the laminated glass package. These configurations enable a focused comparison of how the addition of a solar coating alters the colour of coated glass, particularly in terms of chromatic shift and lightness, when combined with a base low-e coating. Table 5 presents the optical properties of the laminated IGUs analyzed, which were calculated following the NFRC 100 standard method.
All IGUs have the same make-up, from exterior to interior: 2x6mm low-iron glass with solar coating on surface #3 and low-e coating on surface #4 – 12mm cavity filled with argon at 90% - 6mm low-iron glass.
Table 5: Optical properties of glazing assemblies analyzed.
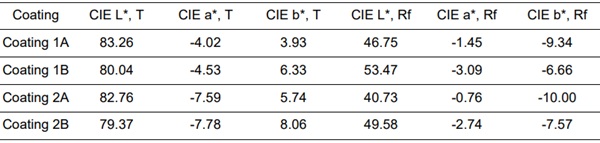
Spectral files for each glazing layer were imported into LBNL Optics 6 to build the glazing assemblies for analysis. CIE Lab* values were calculated for both transmitted and front-reflected light. Table 6 summarizes the resulting CIE Lab* values for transmission and front reflectance for the laminated IGUs analyzed.
Table 6: CIE Lab* values for laminated IGUs.
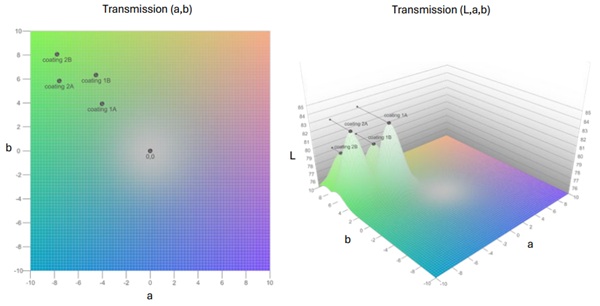
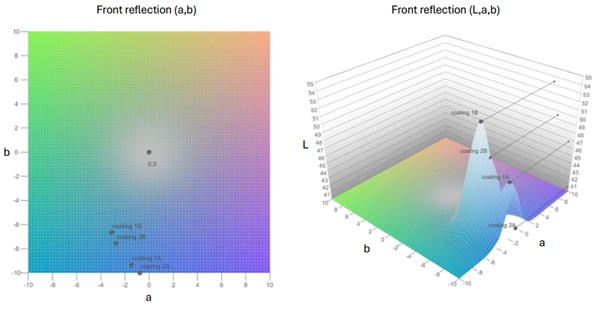
The calculated CIE Lab* values were imported into the custom code in Rhino Grasshopper, where each data point was mapped onto the three-dimensional spatial model. Figure 16 illustrates the spatial distribution of the transmitted light colour for the laminated IGUs analyzed. Both Coatings 1A and 2A tend toward green-yellow hues, with coating 2A displaying a higher chroma, indicating a more saturated transmitted colour. When an additional solar control coating is introduced—Coatings 1B and 2B—the sample points move further away from the chromatic neutrality origin (a*=0, b*=0), indicating an increase in colour saturation. However, such increase in chroma is accompanied by a reduction in lightness (L*), resulting in a darker overall colour appearance when compared to their corresponding base configurations (1A and 2A).
A similar spatial analysis of the front-reflected light colour is presented in Figure 17. In contrast to the behaviour observed in transmitted light, the addition of the solar control coating causes the reflected sample points to shift slightly closer to the chromatic neutrality origin (a*=0, b*=0), with the hue transitioning from blue toward green. This shift is also accompanied by an increase in lightness (L*), indicating that the reflected colour becomes brighter.
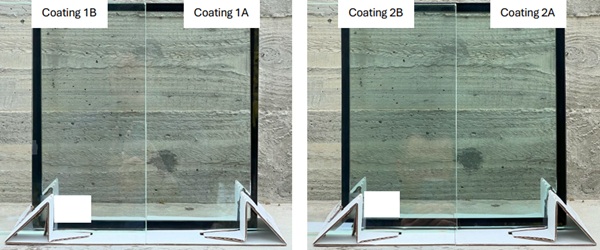
The results of the colorimetry analysis were compared with physical samples of laminated IGUs. Figure 18 presents photographs of the laminated glass samples, where differences in transmitted colour are clearly visible by observing the background materials behind each sample. Behind Coating 1B, the concrete wall appears darker compared to the area behind Coating 1A. Similarly, the white sample holder behind Coating 1B has a darker tone, while the same element behind Coating 1A appears brighter with a more noticeable green hue. A similar behaviour can be observed when comparing Coatings 2A and 2B, where the concrete wall behind Coating 2A displays a saturated green-yellow hue, while the area behind Coating 2B is visibly darker. The white sample holder behind Coating 2A also shows a relatively saturated green-yellow tone, whereas the one behind Coating 2B appears darker.
These visual comparisons of physical samples are consistent with the results of the CIE Lab* analysis.
6. Conclusions and recommendations
This study presents a systematic approach to quantifying and visualizing the colour tendencies of architectural glass through spectral data analysis and spatial mapping in the CIE Lab* colour space. By analysing both reflected and transmitted light properties, this method provides an objective framework for assessing glass colour. The integration of spectral data enhances precision in colour quantification, allowing architects and designers to incorporate colorimetry studies into the glass selection process. This physics-based approach reduces perceptual discrepancies and ensures consistency in the assessment of coated glass colour.
By applying this workflow across three glass groups—uncoated monolithic substrates, coated IGUs, and laminated IGUs with embedded solar control coatings— this study demonstrates how spectral transmission and reflectance characteristics of glass correlate with perceived colour tendencies. The use of 3D spatial visualizations in Rhinoceros Grasshopper enabled effective comparative analysis that revealed consistent trends such as increased desaturation and lightness in low-iron glass, as well as higher colour saturation with reduced lightness in coatings with lower SHGC.
Despite the consistency of the method, several limitations must be discussed. First, while spectral data is widely available for standard commercial glass products, it is not always accessible when evaluating atypical configurations, such as laminated glass with embedded coatings. Second, the colour calculations are based on standard illuminant simulating average sunny conditions. However, this assumption does not fully capture the variability of natural daylight conditions specific to geographic location, glass orientation, and seasonal and hourly light changes. Finally, while the CIE Lab* space enables a robust numerical analysis, its wide coordinate range (from -150 to +150 for a* and b*) compresses subtle colour differences. This means that small chromatic variations, such as the ones shown in this paper, may appear visually clustered in the plots. As a result, the visual representation captures the tendency of colour and lightness rather than an exact match of the perceived colour, which must be kept in mind when interpreting the plots.
Future steps of this colorimetry analysis approach include the direct measurement of CIE Lab* values for the physical glass samples analyzed in this study. The measured values will provide a third data source—in addition to visual inspection and spectral analysis—to cross-validate the accuracy of the method. Incorporating physical colour measurements will help confirm the predicted colour tendencies and refine the application of the method for real-world architectural glass design decision-making.
In conclusion, this study highlights the value of transitioning from subjective colour assessment methods toward a data-driven, physics-based approach for achieving more precise and reliable evaluations of coated glass colour.


Comments
Fascinating research — integrating colorimetric analysis into facade design is such a smart move toward objective color evaluation. It’s interesting how the study parallels precision work in fields like automotive basecoat technology, where spectral data also defines visual accuracy and consistency.