Source: Glass Structures & Engineering
Authors: Michael A. Kraus, Rafael Bischof, Henrik Riedel, Leon Schmeiser, Alexander Pauli, Ingo Stelzer & Michael Drass
DOI: https://doi.org/10.1007/s40940-024-00277-w
Abstract
The demand for transparent building envelopes, particularly glass facades, is rising in modern architecture. These facades are expected to meet multiple objectives, including aesthetic appeal, durability, quick installation, transparency, and both economic and ecological efficiency. At the heart of facade design, particularly for structural glass elements, lies the assurance of structural integrity for ultimate and serviceability limit states with a requisite level of reliability. However, current structural engineering assessments for glass and glass laminate designs, especially in the geometrically non-linear setting, are time-consuming and require significant expertise. This study develops a customized Mixture-of-Experts (MoE) neural network architecture to overcome current limitations. It calibrates it on synthetically generated stress and deformation data obtained via parametrized Finite-Element-Analysis (FEA) of glass and glass laminate structures under both geometrically linear and nonlinear conditions for several joint support and loading conditions. Our findings reveal that the MoE model outperforms baseline models in predicting laminate deflections and stresses, offering a substantial increase in computational efficiency, compared to traditional linear and non-linear FEA, at high accuracy. The MoE is integrated within a novel web-based glass design and verification tool called Strength Lab AI and provided to the engineering public for future use. These results have profound implications for advancing engineering practice, offering a robust tool for the intricate structural design and analysis of glass and glass laminate structures.
1 Introduction
In modern architecture, structures composed of glass and glass laminates have emerged as quintessential materials for facades, epitomising the synthesis of aesthetic elegance and structural functionality. The transparency and versatility of glass allow for the infusion of natural light, creating vibrant interior spaces while offering panoramic views of the exterior world. Laminated glass, in particular, enhances this synergy by adding safety, acoustic insulation, and energy efficiency layers to the architectural canvas. The design choices for the facades significantly influence structural performance and the environmental footprint of a building’s envelope. A well-engineered glass facade supports the weight and forces imposed by ecological conditions and contributes to the building’s acoustic and thermal performance, reducing energy consumption for heating and cooling. This dual role places a premium on innovative facade designs harmonising structural integrity with environmental stewardship.
While the sustainability evaluation of a facade design is of great significance, this paper deals with the structural analysis and design of glass components of facades. Computational analysis has become indispensable in the evaluation and optimization of glass structures for ultimate (ULS) and serviceability limit states (SLS) with a requisite level of reliability, especially in the context of regions on the globe, where rigorous standards set forth by German (DIN), European (EN), and US (ASTM) norms have to be applied during the glass performance evaluation process. Current structural engineering assessments for glass and glass laminate designs employ different methods, such as beam, plate or laminate theories, along with analytical, semi-analytical or numerical procedures (such as Finite Element Analysis (FEA)) for solving the equations provided by the respective theory. In engineering practice, the application of numerical solvers for advanced laminate and plate theories, particularly within geometrically non-linear FEA settings, is hardly observed. This underutilization can be attributed to the considerable time investment and specialized expertise required for their execution compared to analytical approaches. However, these approaches can yield more efficient glass configurations in numerous instances by leveraging the membrane effect or increased shear transfer due to larger strains. Additionally, they offer a more realistic assessment of stress distribution, especially in scenarios where edge strength predominates.
This raises the question of whether it is possible to develop a robust prediction tool using artificial intelligence (AI), machine (ML), and deep learning (DL) to achieve accelerated member design and verification responses at an identical level of reliability as state-of-the-art approaches. Based on prior experience and expertise of the authors in the field of Scientific Machine Learning in civil engineering under academic and industry-related perspectives (cf. Kraus and Taras 2020; Kraus and Drass 2020a; Kraus 2019, 2022; Kraus and Drass 2020b; Bischof and Kraus 2021; Bischof et al. 2023; Fisch et al. 2023; Balmer et al. 2024; Kraus et al. 2022 etc.), a project between Kuraray Europe GmbH and M &M Network-Ing UG (haftungsbeschränkt) was initiated to conceptualise, develop and implement the Strength Lab AI tool.
Artificial neural networks have gained widespread popularity as a powerful tool for tackling regression tasks, especially in Machine Learning (ML). However, using these models for regression on data that exhibits an exponential distribution with a long-tailed characteristic poses various challenges. The presence of extreme outliers in such data renders the use of traditional loss functions, such as the Mean Squared Error (MSE), ineffective, as the errors associated with these outliers disproportionately skew predictions towards them, thereby making the model neglect the majority of data points in smaller regions. Researchers have proposed various solutions to mitigate these issues, such as transforming the data into log-scale by utilizing loss functions like the Mean Squared Logarithmic Error (MSLE) , which places greater emphasis on smaller values. However, this approach can lead to even more pronounced errors when it comes to outliers. Other alternatives, such as using the Huber loss function, offer a compromise but may still produce suboptimal results.
Consequently, the question arises as to whether there exists a method that can effectively combine the advantageous attributes of all these approaches. Given the ubiquity of long-tailed distributions in real-world data, the ability to handle them effectively is of great importance in enhancing the performance of neural networks. In light of this, the present study aims to explore the use of artificial neural networks for regression on data with long-tailed exponential distributions. To this end, we propose a novel approach which integrates the utilization of a Mixture-of-Experts (MoE) with a gating network. Specifically, the proposed method involves using multiple experts, each of which can be designed with custom architectures and loss functions specifically tailored to the different regions of the exponential distribution that should be covered. For example, one expert may utilize an MSLE to focus on small values, while another expert may utilize an MSE to concentrate on large values (i.e. the outliers in the tail of the distribution), and a third expert may utilize a Huber loss to cover the values in-between. By leveraging the diverse expertise of these experts, the proposed approach aims to capture the nuances of the data and accurately predict the smaller values within the bulk of the distribution while still capturing the outliers with a reasonable degree of accuracy. To effectively aggregate these experts’ contributions, they are employed in conjunction with a gating network, which assigns weights to each expert’s contributions based on their relevance to the input data. The gating network outputs are passed through a softmax function to turn them into a probability distribution and perform the weight assignment. Then, they are multiplied by the experts’ outputs and aggregated for the final result.
The main scientific background and building blocks of Strength Lab AI are provided in the remainder of this paper, which is organised as follows: Sect. 2 recovers the state-of-the-art in computational design and analysis as well as international standardisation efforts towards monolithic and laminated glass structures. Section 3 introduces the overall concept of Strength Lab AI along with the approach for synthetic data generation and the investigated machine and deep learning algorithms and our development of a customized Mixture-of-Experts architecture comprising of regression neural network. Section 4 reports the training and validation results of the AI models for all cases. Section 5 provides a brief discussion of the findings of this research, while Sect. 6 concludes this paper with suggestions for future directions for applications and research.
2 State-of-the-Art and literature review
This section covers the state of the literature for glass structures composed of monolithic and laminated glasses towards computational analysis as well as standardisation and AI-based surrogate modelling for regression.
2.1 Glass design: computational approaches and current standards
Several methods can be used to calculate the stress and deflection present in glass panes under loading, with varying degrees of accuracy:
- Linear plate theory
- Non-linear plate theory
- Linear Finite Element Analysis
- Geometrically non-linear Finite Element Analysis
While the computation and design of monolithic glasses is an established problem, the engineering of layered composites, particularly in response to out-of-plane bending, hinges on the crucial role of the interlayer in augmenting bending capacity via shear coupling between external glass plies, a phenomenon extensively investigated for its complex assessment challenges. The interlayer’s shear modulus G is a key feature in glass laminate design due to the shear coupling of the glass planes. The degree of shear coupling depends on the dimensions of the glass system, the laminate setup, loading conditions, and support conditions (Kraus 2019). For glass systems in practice, glass stresses decrease for interlayer shear modulus values G>=0.1 MPa and full shear coupling is reached for G∈[1;10] MPa. Experimental procedures to obtain interlayer shear moduli together with computational modelling approaches can be found in Kraus et al. (2017), Kraus (2019).
The analysis and design of sandwich structures rely on numerical or approximate methods. Wölfel (1987) provides an approximation for uniaxial simply supported systems, which has been adapted to laminated glass and integrated into standards like the ASTM E1300-16 (Standard 2016), illustrating a nuanced understanding of shear transfer in glass laminates. Another approach uses the concept of ’effective thickness’, which stands out for its variational approach to mimic equivalent bending properties of a single monolithic glass pane instead of the glass laminate. Yet, these methods lack validity and accuracy for large deformations.
Numerical simulations have become integral in designing laminated glass structures, offering reduced costs and enhanced safety. Various theories, such as First-Order Shear Deformation (FSDT), Higher-Order Shear Deformation (HSDT), and Classical Lamination (CLT), among others, cater to specific aspects of laminate analysis. Altenbach (1998) and others have reviewed these theories, focusing on their application to shear deformation and layered laminate structures. Reddy and Robbins (1994) and collaborators have explored layer-wise theories, while (Liu and Li 1996; Li and Liu 1997) have developed techniques for enhancing displacement assumptions in laminate theories. FEA and its evolution in laminate analysis have been scrutinized by Zhang and Yang (2009), and Khandan et al. (2012) have emphasized modelling methods, particularly for stress and shear analysis.
Insulating Glass Units (IGUs), comprising two or more glass panes separated by air or noble gas-filled spaces, play a crucial role in thermal insulation within building envelopes. The interaction between glass panes and the gas under external loads leads to a phenomenon known as load sharing, influenced by pane stiffness and gas compressibility. While Double and Triple Glazing Units (DGUs and TGUs) are standard, research on TGUs and more complex IGUs is limited, with some engineers often overlooking the middle pane’s load-sharing contribution. Various methods, including the ’thickness cubed’ method from ASTM E1300 and the European Norm EN 16612’s (2019) approach considering gas compressibility, offer ways to evaluate load sharing. Still, they have their limitations, particularly for non-rectangular or more complex IGUs. This work employs the approach of Feldmeier (2006), which provides a more flexible method, accommodating an arbitrary number of glass panes and different geometries, complemented by iterative numerical methods. More recently, Galuppi and Royer-Carfagni (2020) derived Green’s functions derived from Betti’s Analytical Method (BAM), which offers a novel approach to assess load sharing in DGUs modelled as Kirchhoff-Love plates, with the potential to extend to multiple IGUs.
The design and analysis of glass structures composed of monolithic or laminated glasses are currently covered by national and international standards. A global review of current approaches for glass design is provided by Kuntsche et al. (2019). The DIN 18008 (2020) standard is pivotal for glass design within the German construction industry. As per DIN 18008-1, when establishing general design and construction guidelines, designers are instructed not to consider a shear bond that could be advantageous to the glass structure’s design. This exclusion only lifts when the shear bond is detrimental, such as in the case of deformation-induced stresses from climatic loads on insulating glass units, where the scenario of complete shear transfer must be considered. Thus, the standard only contemplates the extreme scenarios of either full shear or no shear transfer. The rationale for disregarding a beneficial shear transfer in glass dimensioning lies in the time and temperature-sensitive behaviour of the material.
Nevertheless, for certain products, manufacturers have secured general building authority approvals (abZ in Germany), which allow for considering a beneficial shear modulus in glass dimensioning for specific design cases, which is the case, e.g. for Kuraray products (2016a, b, c). These approvals also extend to using linear viscoelastic material models in the current regulatory environment. Unlike the German standards, other national guidelines and the European EN 16612 acknowledge a degree of shear transfer by the interlayer in laminated glass design. This acknowledgement is operationalized by calculating an adequate thickness of the entire laminate, derived from a shear transfer factor ranging from 0 (no shear transfer) to 1 (full shear transfer), influencing stress calculations.
The European EN 16612 employ a methodology for determining the effective thickness of glass laminates that accounts for shear transfer coefficients, denoted as ω. These coefficients are classified based on ’stiffness families,’ which group a wide array of interlayer products by similar mechanical properties. To assign an interlayer to a stiffness family under EN 16612, one must evaluate shear modulus-temperature curves over various load durations and temperatures. The assignment to stiffness families 0, 1, or 2 is based on the interlayer’s lowest shear modulus under the relevant load conditions, with higher families indicating a more significant composite effect and family 2 reaching ω values up to 0.7 for wind gust scenarios. These ω-values are established through FEA that correlate the load-deflection behaviour of laminates, which integrate experimental viscoelastic data with equivalent monolithic glass thicknesses. Nonetheless, the authors caution against reliance on the ω-method, arguing that unlike the shear modulus G, the ω coefficient is not an intrinsic material property. Instead, ω is influenced by various factors such as the type of loading, structural system specifics, and the interlayer material, making it an insufficiently reliable metric for designing laminated glass according to Galuppi and Royer-Carfagni (2013).
The ASTM E1300 standard from the United States outlines methodologies for considering shear transfer in glass design, allowing nonfactored load charts or an effective thickness approach. Unlike the tabulated ω-values seen in some standards, ASTM provides a calculation method for the shear transfer coefficient using the interlayer shear modulus. This formula, rooted in Wölfel’s research, enables customization for a range of temperature conditions and load durations, enhancing its applicability to various design scenarios. However, this formula is designed for specific support conditions and load types, mainly for structurally deterministic systems. It assigns a constant factor (A=9.6) for calculating the shear transfer coefficient, regardless of load type. This simplification deviates from Wölfel’s original work, which specifies different A values for various load types (e.g., A=9.6 for uniformly distributed loads versus A=12.0 for single midspan loads on a simply-supported beam). Nonetheless, ASTM E1300 applies this factor uniformly, where geometry is considered, yet load type or support conditions are ignored. Thus, the formula’s accuracy is limiting in diverse practical applications.
2.2 AI-based surrogate modelling
An overview of AI methods and applications in the glass industry can be found in Kraus and Drass (2020a). As the main target of this project was to conceptualize and implement an AI-based regression surrogate for (non-linear) FEA towards stresses and deflections of glass structures, we chose a DL architecture over ’classic’ ML algorithms such as decision trees for the reasons of additional properties such as analytically available gradients of the network for future tasks of the tool such as uncertainty quantification, sensitivity analyses or design optimizations.
Handling outliers in datasets has been a subject of significant research within machine learning, with various methods proposed for their identification and treatment. One commonly employed strategy is to detect and remove outliers from the dataset prior to training the machine learning model, as they may not be considered relevant to the final product in many applications (Chuang and Lee 2011; Wager et al. 2005; Diakonikolas et al. 2019). Several techniques have been proposed for this purpose, including density-based methods (Breunig et al. 2000; Jin et al. 2006), statistical-based approaches (Satman 2013; Yang et al. 2009), and distance-based methods (Dang et al. 2015; Knorr and Ng 1998).
Instead of removing outliers prior to training, other works developed regression methods and models that are inherently robust under the presence of outliers (Chen 2002; Meer et al. 1991; Rousseeuw and Leroy 2005). In the context of deep learning, these efforts have manifested in techniques such as the utilisation of Tukey’s biweight M-estimator as a minimising loss function (Belagiannis et al. 2015), or the derivation of a robust deep regressor via the unfolding of a gradient descent method for a generalised least trimmed squares objective (Diskin et al. 2017). Furthermore, several alternative loss functions have been proposed, such as the Mean Squared Logarithmic Loss (Jadon et al. 2022) and the Huber loss (Tsakonas et al. 2014), which demonstrated being less sensitive to outliers than the standard least squares loss function, commonly employed in deep learning-based regression. An additional noteworthy contribution in this field is the loss function proposed by Sadouk et al. (2020), which is similar to the Mean Absolute Loss but with a smooth residual inspired by the sigmoid function, resulting in improved convergence properties.
However, despite the prevalent practice of eliminating or reducing the influence of outliers when training ML models, it is essential to note that in certain applications, these outlying data points may contain valuable information that should be incorporated within the regression model. This is particularly evident in engineering applications, such as the use of AI-assisted Finite Element Analysis (Kraus et al. 2022), where the correct handling of outliers can be crucial in ensuring accuracy and robustness of the surrogate model.
Given the existence of several techniques aimed at making regression robust against outliers and, conversely, others which are specifically designed to be sensitive to outliers and capture them with high accuracy, a natural way of unifying this dichotomy is resorting to an MoE (Jacobs et al. 1991). While there have been works in the field of statistics and classical ML that have investigated MoE for data that follows neither a uniform nor a Gaussian distribution (Baldacchino et al. 2017; Viele and Tong 2002), to the best of our knowledge, this is not the case in the context of deep learning. Thus, the present work aims to bridge this gap and investigate the potential of Deep MoE regression for exponentially distributed data.
3 Methodology
This section describes our methods and workflows for conceptualisation, data generation, development, ML/DL model backend training, web development, and deployment.
3.1 Concept of Strength Lab AI
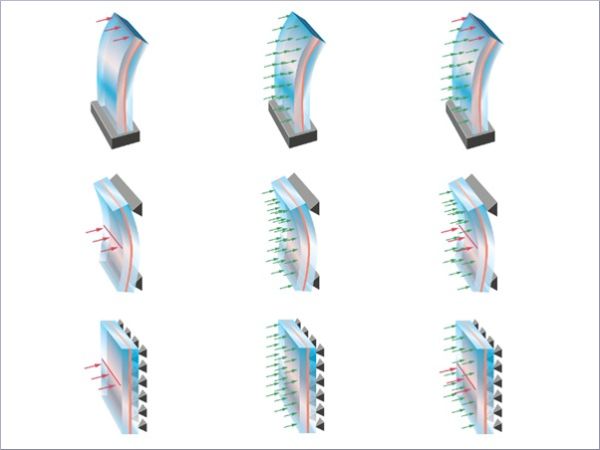
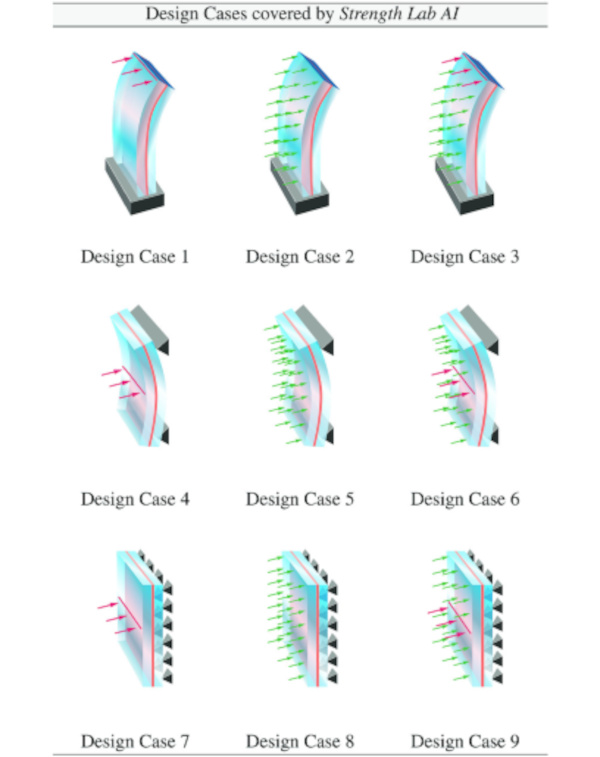
Based on the project consortium’s (Kuraray Europe GmbH and M &M Network-Ing UG (haftungsbeschränkt)) experience, the first version of the Strength Lab AI was intended to cover the most common situations for design and analysis of glass structures at LOD 400: (i) monolithic, laminated and insulation glasses; (ii) structural system: cantilever, single-span beam, Navier-supported plate; (iii) line as well as area loading and their combination, and (iv) design in the ULS and SLS according to ASTM E1300, EN16612/EN16613 as well as DIN 18008 standard. Each combination of structural system and loading is referred to as a “Design Case”, where in total, eight Design Cases are defined, cf. Table 1. A specific focus of this project is on computational speed-up of linear and non-linear computational analysis of a Design Case at high predictive accuracy of stresses and deformations while maintaining user friendliness for a global audience of engineers and architects, which is inherited from Kuraray’s corporate identity and the SoundLab AI tool (Drass et al. 2022). The Strength Lab AI tool is envisioned to leverage a comprehensive database, developed and generated specifically for this project, to train baseline and customised ML/DL models for accurately predicting stresses and deformations of glass constructions. Computation of IGUs is possible by determining the load-sharing factors according to the approach of Feldmeier (2006). Hence, training AI surrogate models for monolithic and laminated glass units is sufficient. The choice for IGU design is based on the ’thickness cubed’, which is in line with EN 16612 and ASTM E1300. The tool is shipped in a “standard” and a “pro” version, where the “standard” version covers the mentioned functionalities for vertical systems. In contrast, the “pro” version allows some reporting customisation (e.g. uploading a company logo) and adds functionalities for executing computations for horizontal systems and doing geometrically non-linear analyses. From this list of requirements, capabilities and intended user stories, the software architecture and its pieces are derived and implemented in parallel.
Table 1 Design Cases covered by Strength Lab AI: structural system and loading specification - Full size table
3.2 Design {representation, features, and performances}
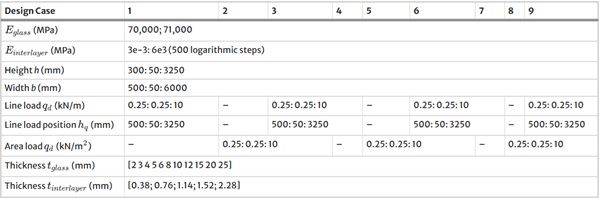
Each glass Design Case is represented by its own dj-dimensional (Euclidean) vector of design feature variables xj∈D⊂Rdj, which together with predefined feature intervals xji[xji,min,xji,max],(i=1,…,dj) span the domain of the design space D. Evaluating a performance metric P(⋅), here we are concerned with stresses and deformations in the ultimate and serviceability limit states, for a design using standard solvers such as FEA may be computationally expensive and is a priori unknown except when computed for specific instances y=P(x). In this paper, we develop a custom DL-based surrogate model for the forward prediction situation (predict the performances given design features). The choice of the specific set of design features per Design Case (j=1,…,9) and the corresponding dimensionality of xj for the synthetic data set generation is based on the professional experience and data analysis of conducted projects together with the chosen sampling intervals per parameter; an overview is given in Table 2.
Table 2 Design space spanned by the Design Cases together with parameter sampling intervals - Full size table
3.3 Synthetic data generation pipeline and data set
The acquisition and preparation of an extensive dataset are paramount for training machine learning and, more specifically, deep learning models. This endeavour is undertaken during the offline phase of the project: first, a parametric ANSYS Parametric Design Language (APDL) script is developed for each Design Case. Secondly, a MATLAB routine samples the parameters, injects the respective parameter values into the ANSYS script, and then initiates its execution to procure numerical outcomes pertaining to stresses and deformations. The sampling of features for each Design Case is conducted within the bounds delineated in Table 2 as a full factorial design for fully covering the design space and to see the full range of high to low-performing glass structures per Design Case in the data set. Stress and deformation results of the monolithic and laminated glass systems were obtained using ANSYS 2022 R2.
For each geometry and loading situation, as per the defined nine cases in Sect. 3.1, a hard-coded parametric ANSYS Parametric Design Language (APDL) template file was created, which is dynamically loaded with the respective parameter values and then executed during the data generation process. Computations were conducted with the ANSYS SOLID186 element (2017), an advanced 3-D solid element featuring 20 nodes with quadratic displacement characteristics. Each node has three degrees of freedom, facilitating translations in the x, y, and z directions. The mixed formulation capability of SOLID186 was employed to address geometrically non-linear and near to fully incompressible interlayer material situations. The mesh size was selected to be the minimum value among the following options min(B/100, H/100, 250) mm. The ANSYS output data are stored as txt files. The final stage encompasses aggregating input features and corresponding results across all samples for a Design Case from the txt files into a coherent dataset compressed using the parquet format, a process facilitated by an additional MATLAB script, thereby rendering the dataset conducive to model training.
3.4 Data preprocessing
Before developing predictive models for glass properties, steps were taken to ensure the reliability and relevance of our dataset. Expert consultation and a literature review informed our decision to establish the numerical range of 0 to 500 for the two target variables stress and deflection. Any data points outside of this range were excluded from analysis, as they did not represent real-world and could have negatively affected the accuracy of our models. The constraint to the mentioned data range is solely for engineering reasons: construction codes (serviceability limit state and ultimate limit state) prohibit systems with stresses or deflections with magnitude over 200 (either [mm] or [MPa]). Therefore, the ML surrogate must provide accurate predictions within and to a certain degree beyond these intervals from a numerical standpoint. This approach ensures the surrogate’s predictions to be reliable in an interval suitable for engineering design practice and on the other hand relaxing the training of the ML surrogate towards beyond-practice ground truth data.. Once our data was curated, we used a normalization technique to standardize each feature. This approach ensured a mean of zero and unit variance, addressing any discrepancies in scale between features.
3.5 Evaluation metrics for AI models
The mean absolute error (MAE), R² and thresholded relative error metrics are used to evaluate all AI models. The rationale behind employing the thresholded relative error metric (Lrel) to assess the model’s performance is rooted in the dataset’s exponentially distributed characteristics. This distribution is marked by a pronounced long tail, with a significant concentration of samples near 0 and outliers reaching values as high as 500. Utilizing the relative error as a metric allows for a balanced evaluation across the entire spectrum of data values, ensuring that equitable emphasis on both the densely populated lower end and the sparse, higher-value outliers receive consistent attention in the performance assessment. The relative error for each prediction is defined as:
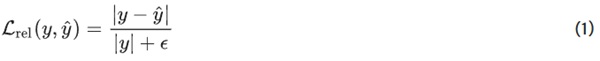
where y is the actual value, y^ is the model’s predicted value, and ϵ (a small constant, i.e. 10⁻⁶) is added to avoid division by zero. The performance indicator is the percentage of predictions where Lrel falls below specific thresholds (1%, 5%, 10%).
3.6 Machine and deep learning models
In this study, we investigated the performance of three different machine learning algorithms for a regression task. Specifically, we compared the performance of two baseline models: (i) XGBoost and (ii) a simple neural network versus our specialized mixture-of-expert neural network, which was taken as the final model for deployment.
3.6.1 Baseline Model 1: XGBoost
XGBoost is a parallel tree-boosting framework that uses a sophisticated gradient-boosting algorithm designed to be efficient, flexible and portable (Chen and Guestrin 2016). Unlike traditional boosting, XGBoost can improve model performance while also controlling complexity through regularization. This makes it an effective tool for managing high-dimensional and continuous data, such as glass property data. Additionally, XGBoost’s optimized tree-building algorithm minimizes computation time and maximizes parallel processing capabilities, which is crucial for handling large datasets like ours. We employed a targeted grid search strategy to fine-tune the hyperparameters that prioritized the parameters critical to model performance and computational efficiency. The selected hyperparameters included:
- max_depth, with a range of 10 to 25, controls the maximum depth of each decision tree, impacting the model’s complexity and ability to capture non-linear relationships.
- n_estimators, varied from 10 to 1000, determines the total number of trees in the model. A higher count increases the model’s capacity and the risk of overfitting.
- learning_rate, set between 0.01 to 0.5, controls the step size of updates made to the weights. A smaller learning rate value leads to more accurate but slower updates, while a larger value leads to faster but less accurate updates.
- subsample, adjusted from 0.1 to 1, specifies the fraction of the training data sampled for growing trees, introducing randomness and reducing overfitting.
- objective, alternated between reg:squarederror for quadratic loss and reg:pseudohubererror for a combination of quadratic and linear loss, beneficial in reducing the influence of outliers.
3.6.2 Baseline Model 2: Neural network
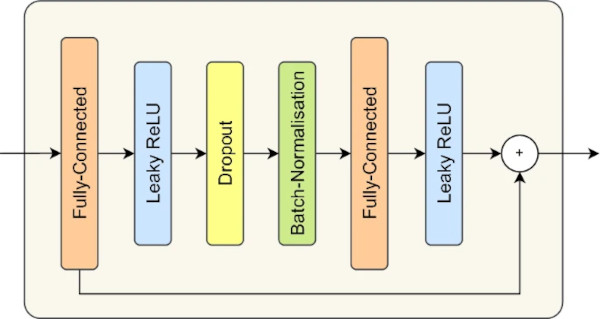
As a second baseline model, we developed a standard neural network (NN) for regression tasks. The NN is structured with four residual blocks, each consisting of two fully-connected layers with leaky ReLU activations, dropout as well as batch normalisation applied to the intermediate layers, and a skip connection between the fully-connected layers (c.f. Fig. 1). These residual blocks are designed to enhance the model’s ability to learn complex representations of the input data by improving the gradient flow during backpropagation.
Given the substantial size of the datasets, we conducted hyperparameter tuning on a subset of tasks and subsequently transferred the chosen hyperparameters to the non-optimized tasks. The hyperparameters for the baseline neural network (NN) were specified as follows:
- depth, ranging from 3 to 5, this parameter controls the number of layers in the network.
- width, selected from 64, 128, and 256, defines the number of nodes per layer.
- loss_function, either MSE or Huber, denotes the loss function utilized for optimization.
3.7 Customized Mixture-of-Experts regression model
In the field of machine learning, Mixture-of-Experts is a technique that leverages the predictions of multiple submodels, referred to as “experts,” to arrive at a final prediction. These experts often specialise in distinct regions or subsets of the data, with a gating network determining which expert to utilise for a given input. This approach aims to capitalise on the strengths of multiple models and mitigate their limitations, particularly in situations where the data exhibits various patterns or structures. The principle of “divide and conquer” underpins this methodology, which, instead of seeking a single model capable of accurate predictions for all input patterns, divides the input space and employs specialised models for each region. This makes MoE particularly well-suited for the problem, dealing with exponentially distributed, long-tailed data.
Table 3 PDF results for stresses and deflections in y and z for Design Case 1 for the monolithic/laminated glass setup for the linear/non-linear computation - Full size table
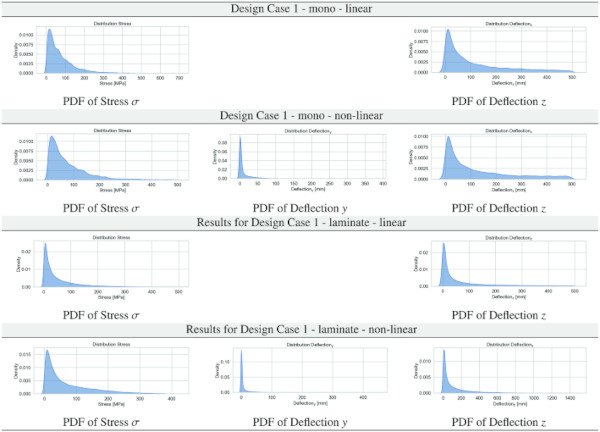
Table 4 PDF results for stresses and deflections in y and z for Design Case 2 for the monolithic/laminated glass setup for the linear/non-linear computation - Full size table
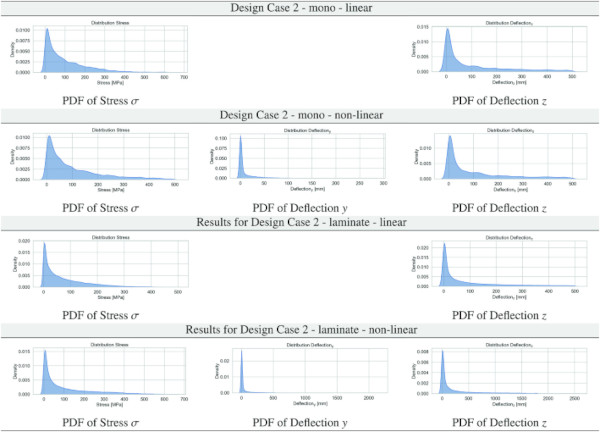
Table 5 PDF results for stresses and deflections in y and z for Design Case 4 for the monolithic/laminated glass setup for the linear/non-linear computation - Full size table

The overall prediction can be formulated as follows:
Let E={e1,e2,…,en} be a set of n experts, where each expert ei is a model with parameters θi. The gating network is represented by a function g(x;Φ), where x is the input and Φ are the parameters of the gating network. The gating network outputs a probability vector p=[p1,p2,…,pn], where pi is the probability that expert ei should be used for input x.
The final prediction y^(x) for input x is a weighted sum of the predictions of the experts:
The parameters of the MoE model Θ={Φ,θ1,θ2,…,θn} can be trained by maximizing the likelihood of the training data given the model.
Table 6 PDF results for stresses and deflections in y and z for Design Case 5 for the monolithic/laminated glass setup for the linear/non-linear computation - Full size table
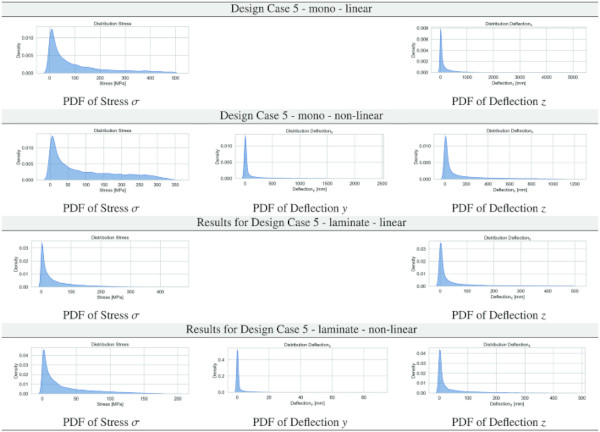
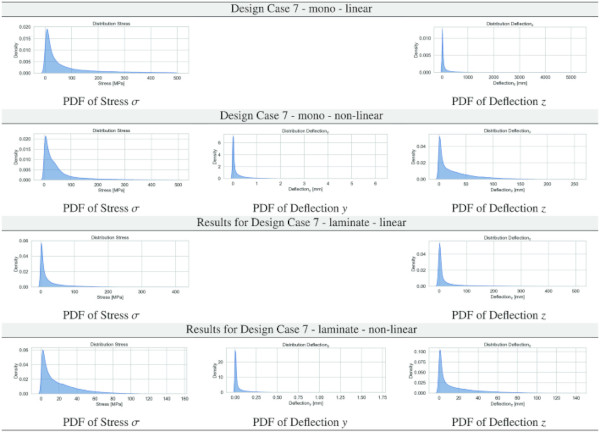
Table 7 PDF results for stresses and deflections in y and z for Design Case 7 for the monolithic/laminated glass setup for the linear/non-linear computation - Full size table
The probability vector p is commonly obtained using the softmax function, which is defined as:
where zi is the logit output of the gating network before the softmax layer for the i-th expert, and τ is a temperature coefficient. The softmax function maps the outputs of the gating network to a probability distribution over the experts, such that the sum of the probabilities is 1.
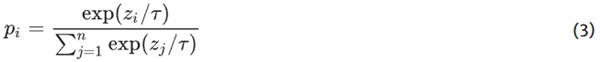
Table 8 PDF results for stresses and deflections in y and z for Design Case 8 for the monolithic/laminated glass setup for the linear/non-linear computation - Full size table
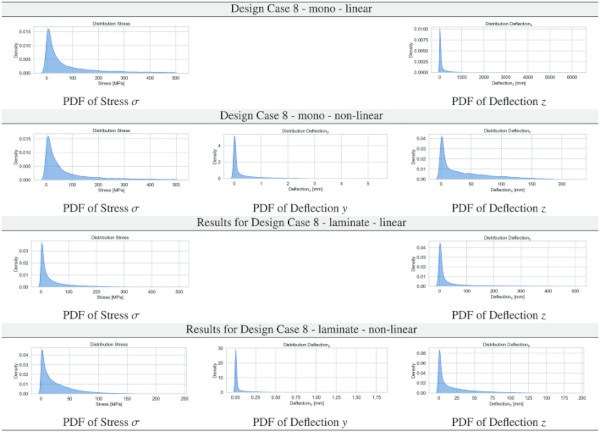
Table 9 Performance Comparison of XGBoost, Baseline NN, and MoE NN Models: The table showcases mean relative error at a 5% threshold, segmented by case number, glass setup, theory, and target, illustrating each model’s accuracy across different scenarios - Full size table
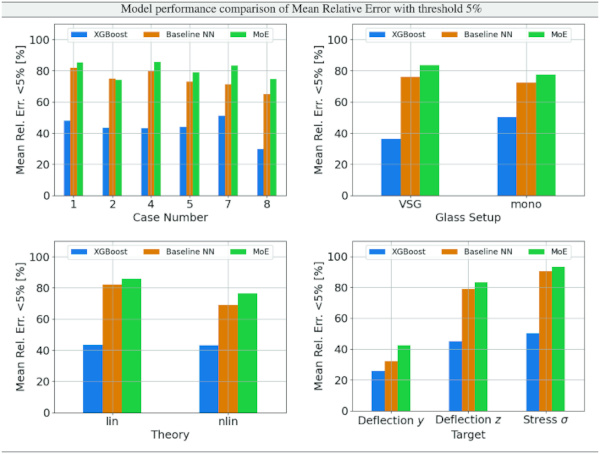
Table 10 Training Results for Design Case 1, monolithic glass setup, geometrically linear computation - Full size table
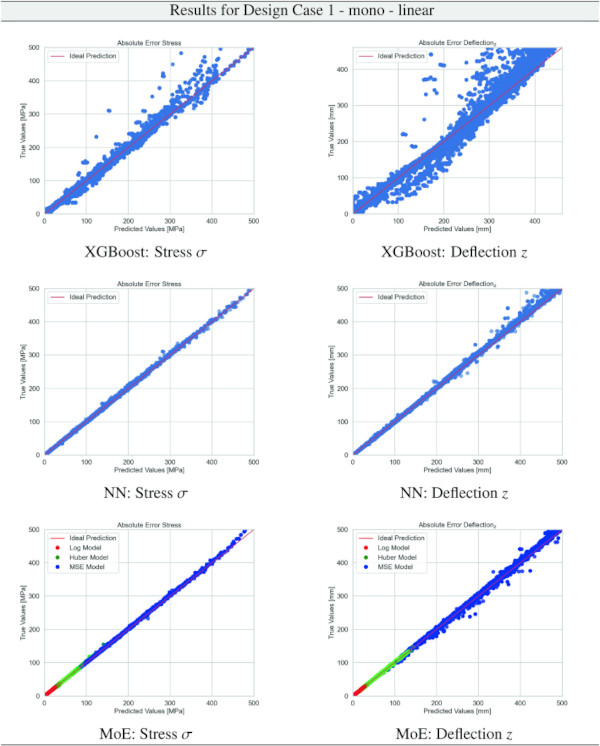
Table 11 Training Results for Design Case 1, monolithic glass setup, geometrically non-linear computation - Full size table
3.7.1 Objective function
The choice and design of the objective or loss function are at the core of our methodology. It plays a crucial role in determining the model’s focus on the exponential distribution of the data and, for example, using the Mean Squared Logarithmic Error (MSLE) as the loss function emphasises the smaller values in the dataset and is less sensitive to outliers. Conversely, the Mean Squared Error (MSE) is more susceptible to outliers, as the errors are squared, and thus, large values exert a greater influence on the backpropagated gradients. A compromise between these two loss functions is the Huber loss, which combines the Mean Absolute Error (MAE) for errors above a chosen threshold, typically 1, with the MSE for errors below the threshold, resulting in a smoother optimisation curve and improved convergence properties compared to the simple MAE.
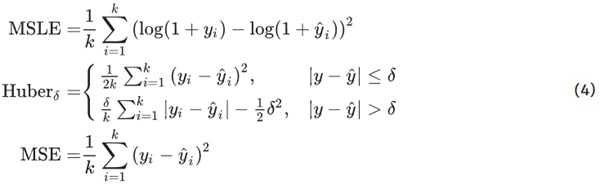
By leveraging an ensemble of models instead of a single model, we can allocate distinct loss functions to each submodel as a prior for a targeted focus on specific data regions. Determining the number of models, denoted as n, and their corresponding loss functions is a hyperparameter optimization problem that requires empirical experimentation. However, a natural starting point is to use n=3 models, with one model utilizing the Mean Squared Logarithmic Error (MSLE) to focus on small values, another model utilizing the Mean Squared Error (MSE) to focus on large values, and a third model utilizing the Huber loss to account for intermediate values.
Table 12 Training Results for Design Case 1, laminate glass setup, geometrically linear computation - Full size table
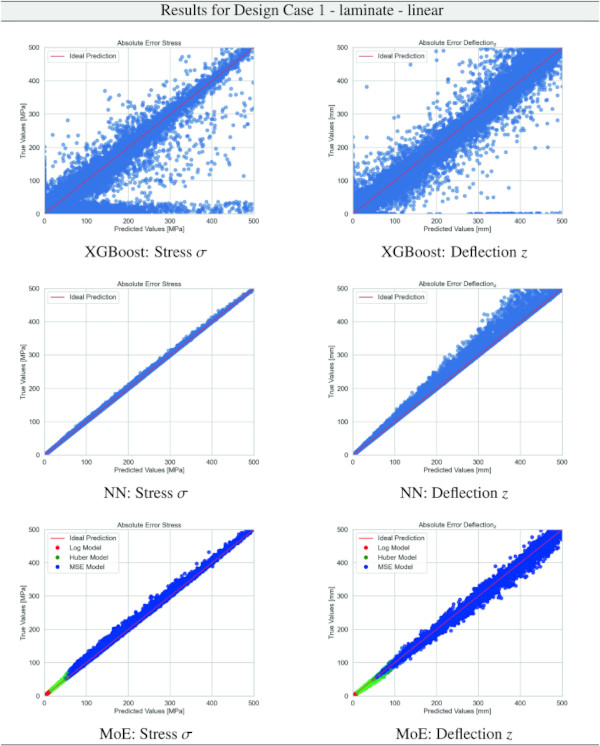
Table 13 Training Results for Design Case 1, laminate glass setup, geometrically non-linear computation - Full size table
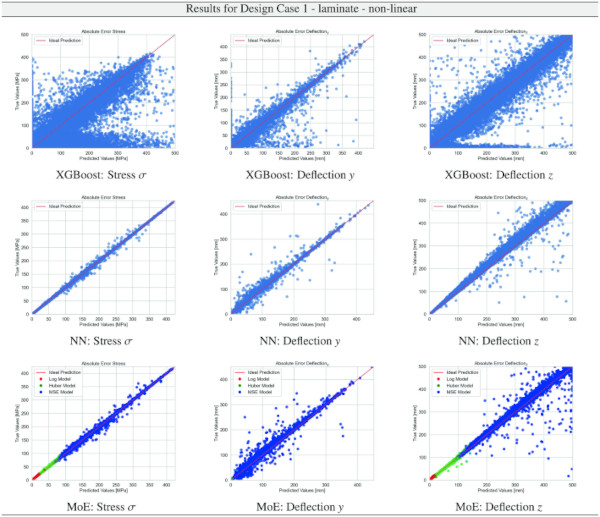
Table 14 Training Results for Design Case 2, monolithic glass setup, geometrically linear computation - Full size table
Finally, an additional objective function is required to train the entire MoE model, including the gating network. The choice of this function is also dependent on the specific problem at hand. However, the Huber loss, which is a compromise between the MSLE and MSE, is likely a suitable choice for this purpose.
Table 15 Training Results for Design Case 2, monolithic glass setup, geometrically non-linear computation - Full size table
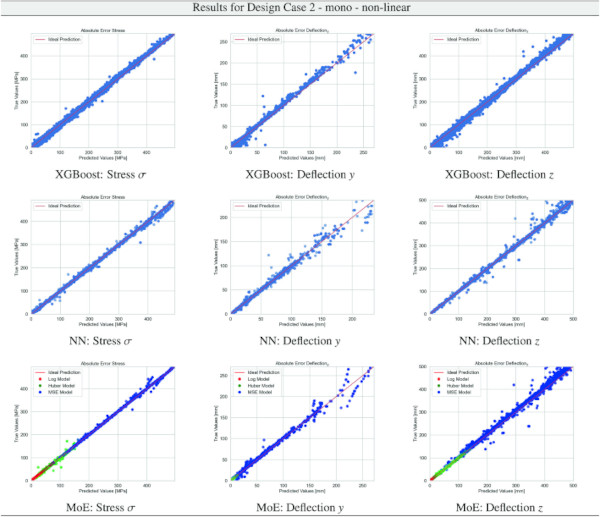
Table 16 Training Results for Design Case 2, laminate glass setup, geometrically linear computation - Full size table
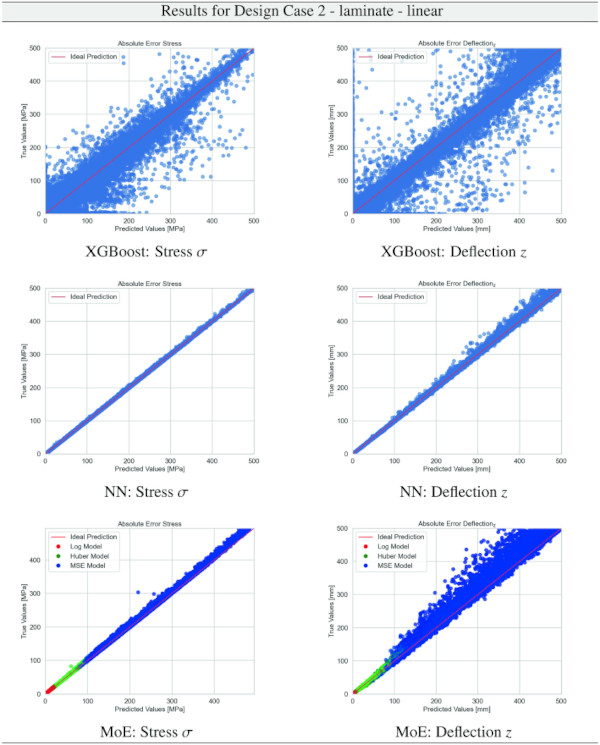
Table 17 Training Results for Design Case 2, laminate glass setup, geometrically non-linear computation - Full size table
In addition to the implicit bias of endowing each expert with a distinct loss function, we enforce partitioning of the dataset by exposing the experts to subdomains between predefined quantiles: expert 1, trained with MSLE, processes data points within the 0 to 40th percentile range. Expert 2, utilising Huber loss, is exposed to the 30th to 70th percentile range, and expert 3, operating with the MSE, is dedicated to the upper 70th to 100th percentile range. On the other hand, the gating network is informed by the entire data distribution, enabling it to weigh individual experts’ contributions effectively.
Table 18 Training Results for Design Case 4, monolithic glass setup, geometrically linear computation - Full size table
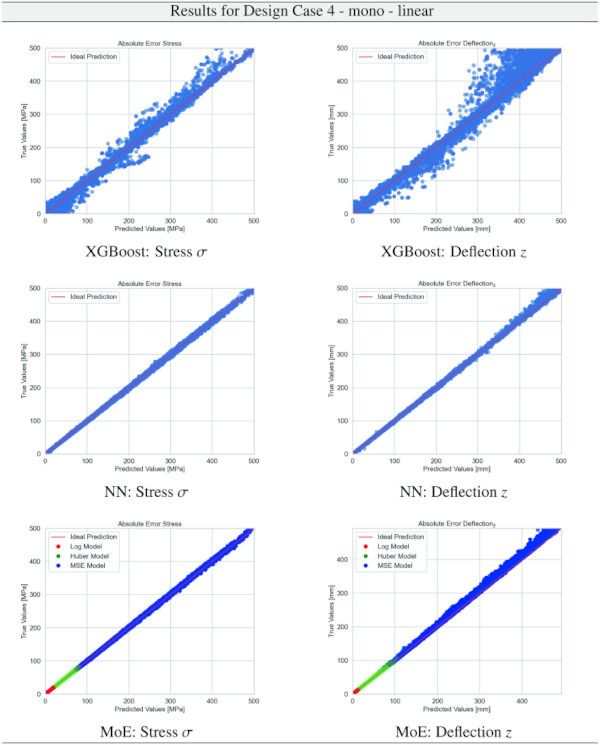
Table 19 Training Results for Design Case 4, monolithic glass setup, geometrically non-linear computation - Full size table
The loss function, accommodating this structured data exposure, is adapted to reflect the targeted training of each expert on its designated data subset and specific loss function, as follows:
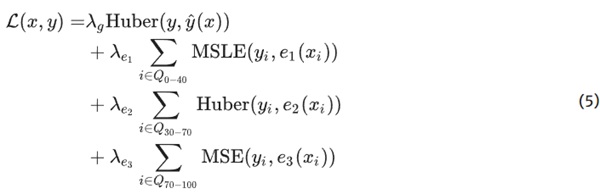
In this formula, Qa−b denotes the set of indices corresponding to data points within the distribution’s ath to bth percentile range, ensuring that each expert is fine-tuned to its respective data segment. The λ parameters serve as scaling factors, balancing the contribution of each loss component to the total loss. This tailored approach promotes specialization within the MoE architecture and fosters a more nuanced understanding and representation of the underlying data structure.
Table 20 Training Results for Design Case 4, laminate glass setup, geometrically linear computation - Full size table
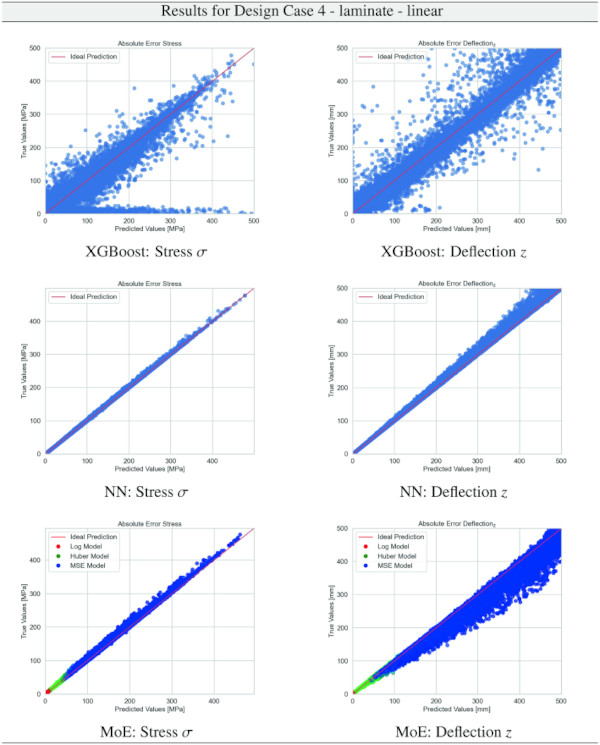
Table 21 Training Results for Design Case 4, laminate glass setup, geometrically non-linear computation - Full size table
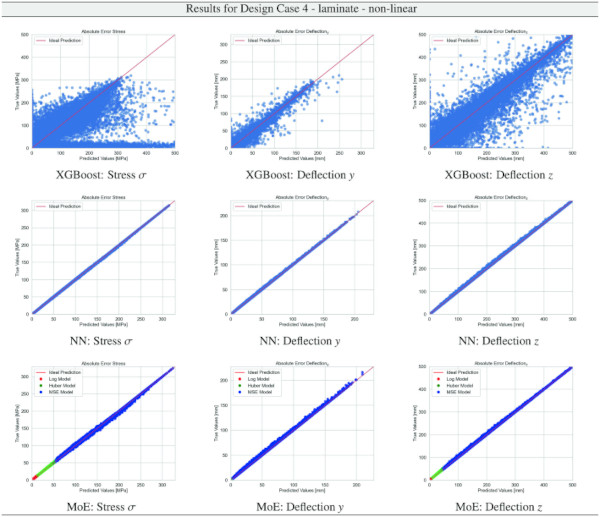
Table 22 Training Results for Design Case 5, monolithic glass setup, geometrically linear computation - Full size table
3.7.2 Parametric softmax activation
Table 23 Training Results for Design Case 5, monolithic glass setup, geometrically non-linear computation - Full size table
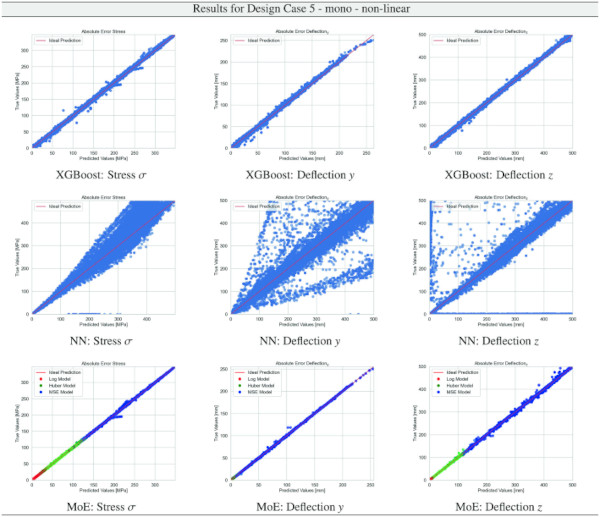
Table 24 Training Results for Design Case 5, laminate glass setup, geometrically linear computation - Full size table
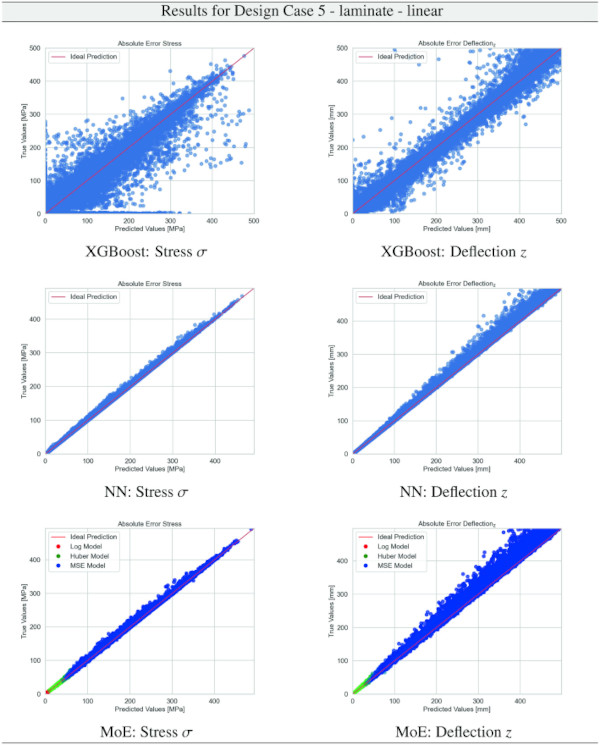
Table 25 Training Results for Design Case 5, laminate glass setup, geometrically non-linear computation - Full size table
By using an ensemble where the experts specialise in non-overlapping regions, the gating network must be able to make confident decisions, possibly involving sharp discontinuities on the decision boundaries. To this end, we endowed it with a vector quantisation layer described in Sect. 3.7.3, which involves a discrete operation and is therefore well-suited for this task.
Table 26 Training Results for Design Case 7, monolithic glass setup, geometrically linear computation - Full size table
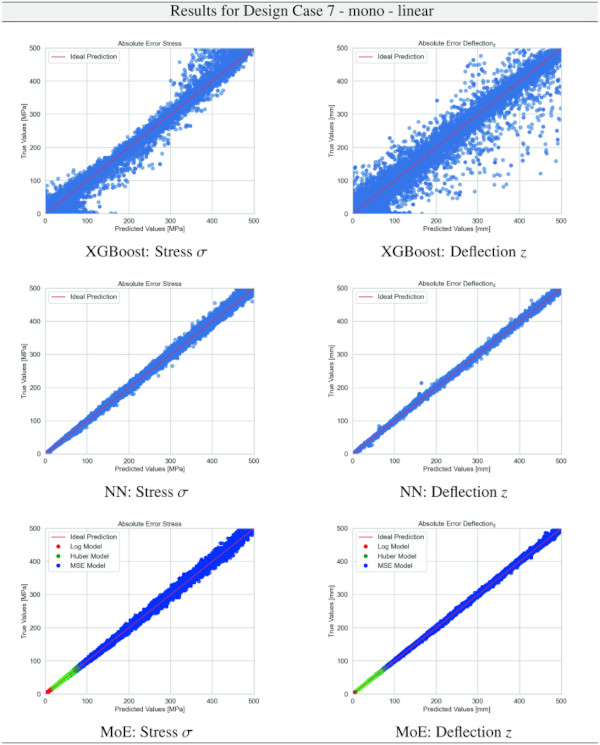
Table 27 Training Results for Design Case 7, monolithic glass setup, geometrically non-linear computation - Full size table
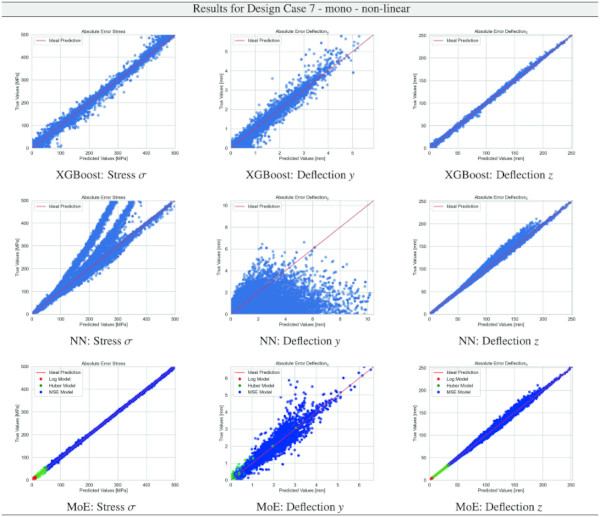
Table 28 Training Results for Design Case 7, laminate glass setup, geometrically linear computation - Full size table
An additional way of increasing the confidence and sharpness of the decision boundaries is by decreasing the temperature coefficient τ in the softmax layer of the gating network (cf. Eq. 3).
Table 29 Training Results for Design Case 7, laminate glass setup, geometrically non-linear computation - Full size table
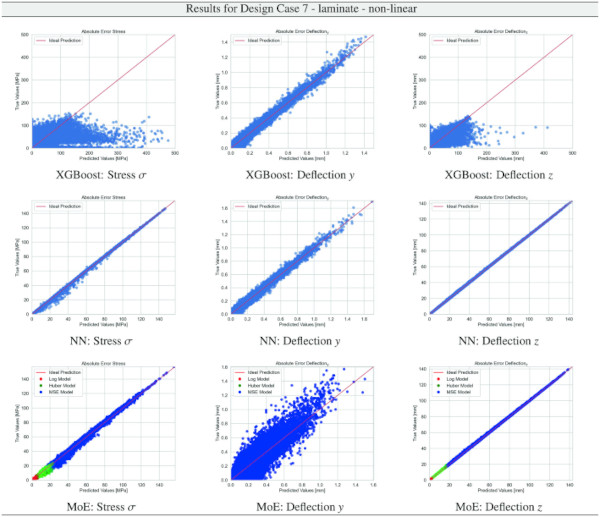
Table 30 Training Results for Design Case 8, monolithic glass setup, geometrically linear computation - Full size table
However, setting this value too small in the early stages of training would cause the gradients to be sparse and subject to high stochasticity w.r.t. the initialisation of the gating network. As an alternative, we propose initialising τ as a trainable parameter with a value of 1 and applying a regularisation term R(τ), making it converge to a small value (e.g., 0.1). This approach allows for balanced gradients at the start of training while still obtaining sharp and confident decision boundaries upon convergence.
3.7.3 Model architecture
Table 31 Training Results for Design Case 8, monolithic glass setup, geometrically non-linear computation - Full size table
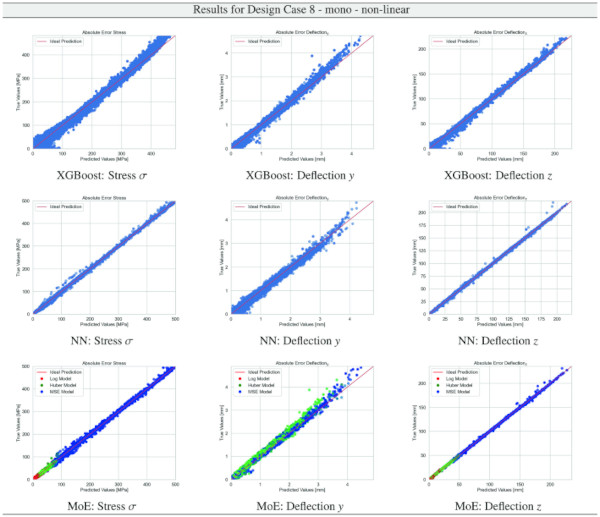
Table 32 Training Results for Design Case 8, laminate glass setup, geometrically linear computation - Full size table
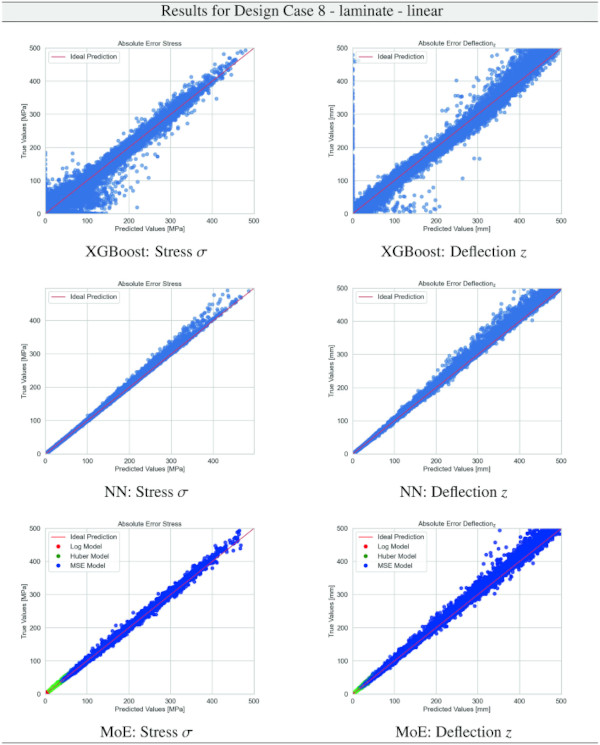
Table 33 Training Results for Design Case 8, laminate glass setup, geometrically non-linear computation - Full size table
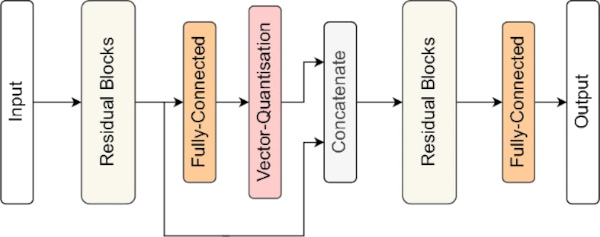
Since we apply our methodology on continuous, tabular data, our gating network, as well as the experts, consists of four residual blocks as the ones used in the baseline NN (cf. Sect. 3.6.2), with the gating network’s architecture containing two modifications compared to the experts:
- The last layer of the gating network consists of a fully connected layer of width n equal to the number of experts, followed by the parametric softmax layer introduced in Sect. 3.7.2.
- Between residual blocks two and three, we add a vector quantization layer (van den Oord et al. 2017), thus introducing a discretisation aiding the gating network in creating sharp decision boundaries. Vector quantization is a technique for compressing data by approximating a large set of high-dimensional data points as a smaller set of points called “codebook”. The data points are then represented by the index of their nearest point in the codebook. This discrete operation is made differentiable using a straight-through estimator (Bengio et al. 2013).
Figure 2 depicts the gating network’s architecture.
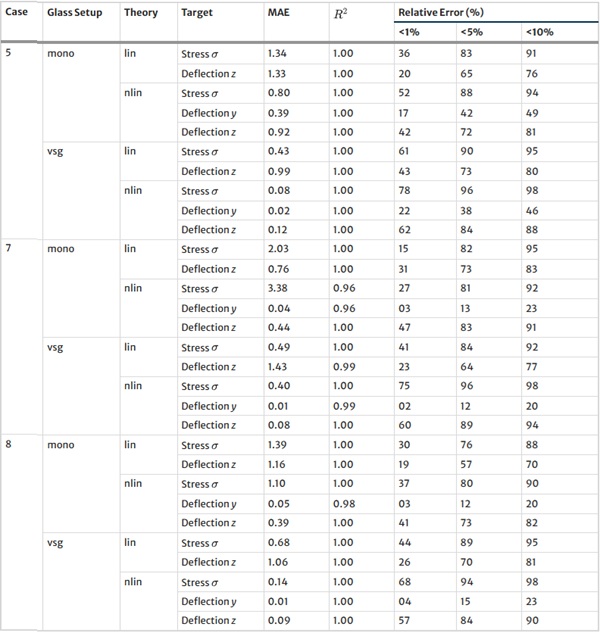
Table 34 Mean Absolute Error (MAE), R² Value, and Relative Error for various thresholds for the baseline XGBoost model on the test set - Full size table
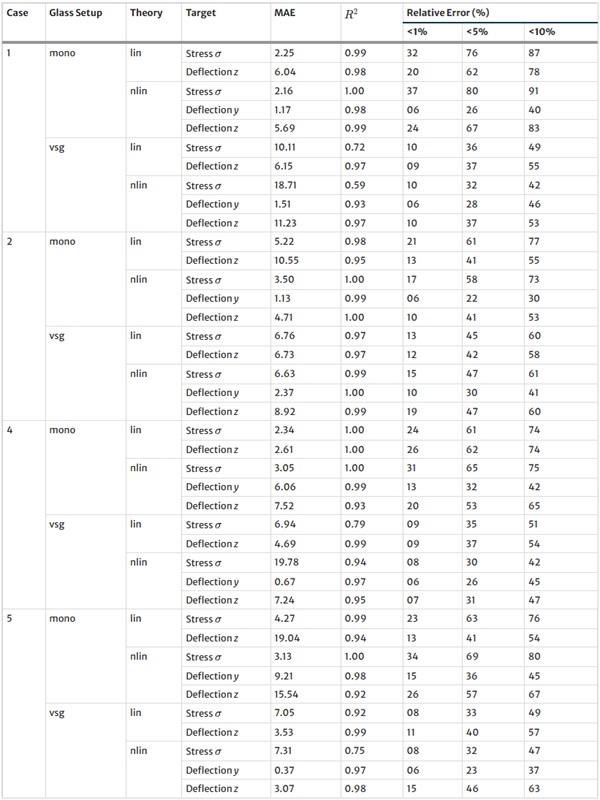
Table 35 continued - Full size table
3.8 AI training and hyperparameter tuning
The dataset, encompassing 100,000 to 11,000,000 samples (depending on the Design Case), was divided into training (70%), validation (10%), and testing (20%) segments. Given the dataset’s substantial size, each model was trained once instead of cross-validated.
3.9 Machine and deep learning results
Table 36 Mean Absolute Error (MAE), R² Value, and Relative Error for various thresholds for the baseline NN model on the test set - Full size table
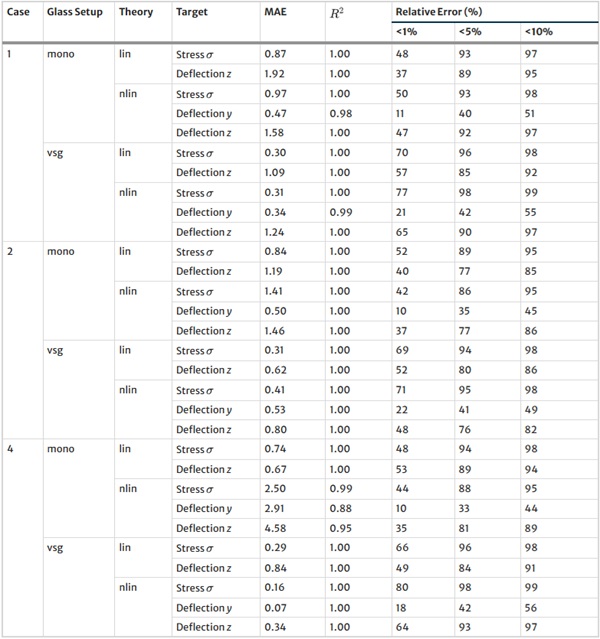
Table 37 continued - Full size table
For the neural network training runs, we used the Adam optimizer with an initial learning rate of 0.001 and included ReduceLROnPlateau scheduler with a patience parameter of 5 epochs, a factor of 0.1 and an early stopping condition after a patience of 12 epochs.
All models were evaluated with the relative error metric Lrel, thresholded at 5%, as described in Sect. 3.5.
The hyperparameters for XGBoost were fine-tuned for each specific task and were selected from the ranges outlined in Sect. 3.6.1. In contrast, the architecture of both the baseline NN and our proposed MoE model remained identical across all tasks. The baseline model consisted of 4 layers with 256 nodes, resulting in approximately 260,000 parameters. On the other hand, the MoE model comprised 3 layers with 128 nodes in each expert, and 3 layers with 64 nodes in the gating network, totalling about 160,000 parameters.
3.10 Verification computations
Across each of the nine Design Cases, we conducted an exhaustive series of verification computations utilizing the industry-standard software packages Dlubal RFEM 5 (corrected source, see literature section) and MEPLA (corrected source, see literature section). These analyses were conducted under both linear and nonlinear settings, thereby encompassing a comprehensive spectrum of structural behaviours. An extensive array of approximately 20 configurations was meticulously examined within each Design Case. These configurations included variations in interlayer properties and composition, covering monolithic, laminate and IGU situations. The verification step ensures the fidelity and reliability of the framework and results of the Strength Lab AI tool and builds users’ trust and confidence.
4 Results
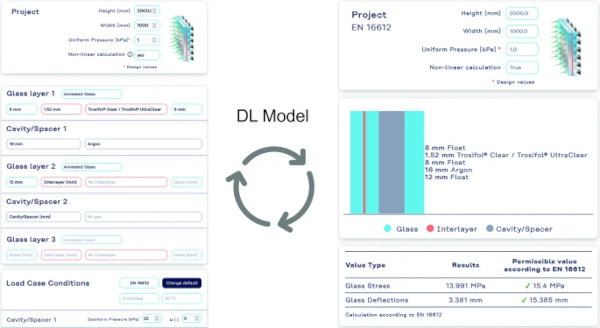
The Strength Lab AI was launched on the homepage of Kuraray by the end of 2023 and can be visited via https://strengthlabai.trosifol.com/. An example screenshot for the workflow from the input via the DL model call and the results page is provided in Fig. 3.
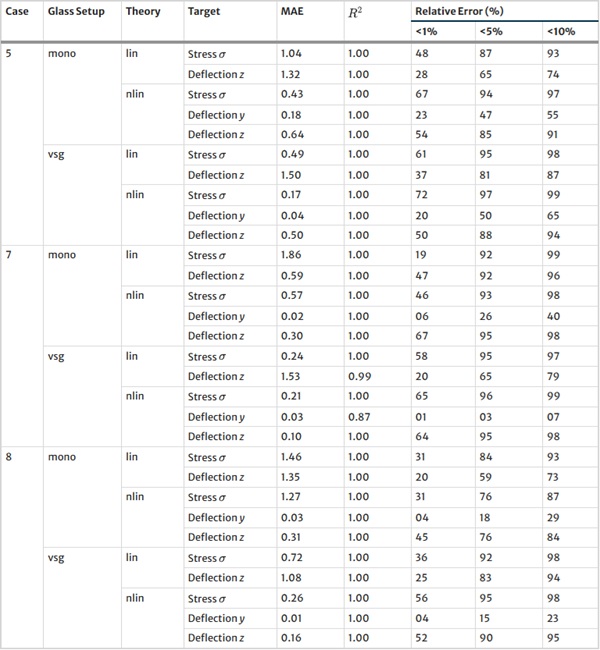
Table 38 Mean Absolute Error (MAE), R² Value, and Relative Error for various thresholds for our MoE model on the test set - Full size table
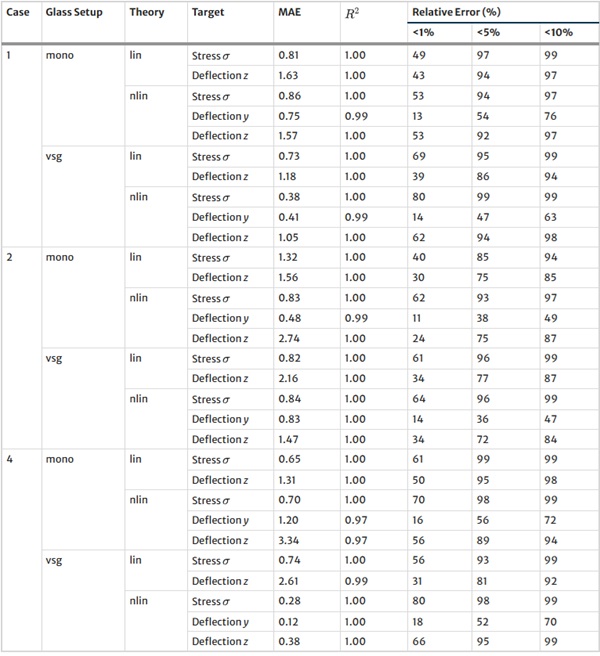
Table 39 continued - Full size table
4.1 Synthetic data
Tables 3, 4, 5, 6, 7, 8 report the data distribution of the stress and deformation data obtained from the parametric ANSYS APDL scripts employing the full factorial design as per Sect. 3.3 for all Design Cases. The logic of the following graphical display of the obtained data is that we provide a table with 12 subfigures of the PDFs per Design Case, containing the kernel density estimate (KDE) plots (Waskom 2021) for all glass setups and computational theories for normal stress σ, deflection y, and deflection z.
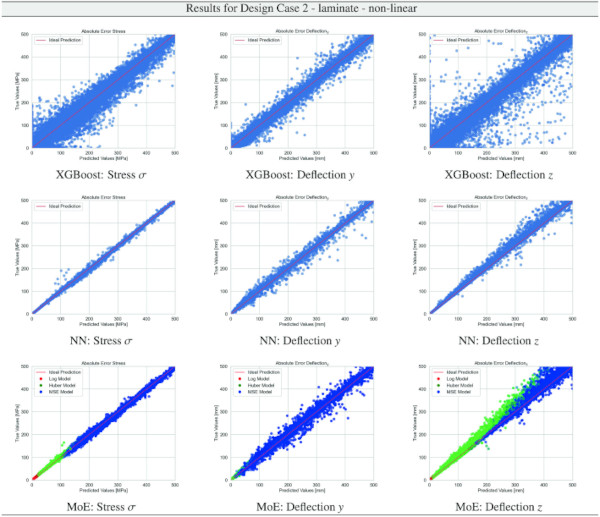
We comprehensively evaluate our proposed MoE model relative to the established XGBoost and Baseline NN. Referencing Table 9, it is evident that the MoE model consistently outperforms both the XGBoost and the Baseline NN across various evaluation dimensions, including case number, glass setup, computational theories, and specific targets. Notably, the superiority of the MoE model is most marked in scenarios where the data distribution is characterized by an extreme exponential nature, typified by Case 7 or the deformation y target. In these instances, most data points cluster near zero, accompanied by a sparse but significant tail of higher values. This distribution challenges traditional models but is precisely where our MoE model demonstrates its robustness and superior predictive capability.
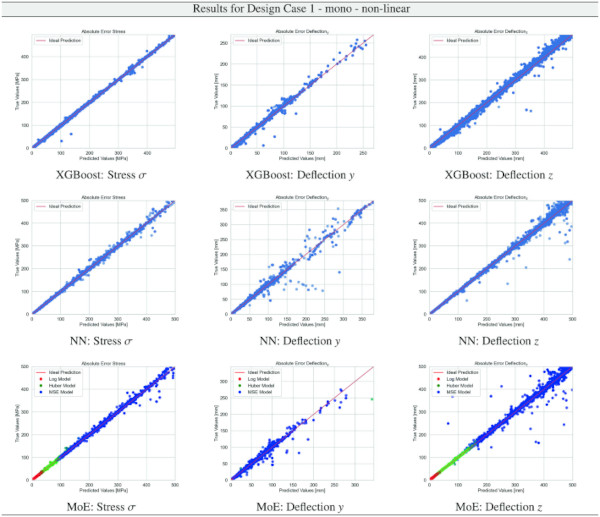
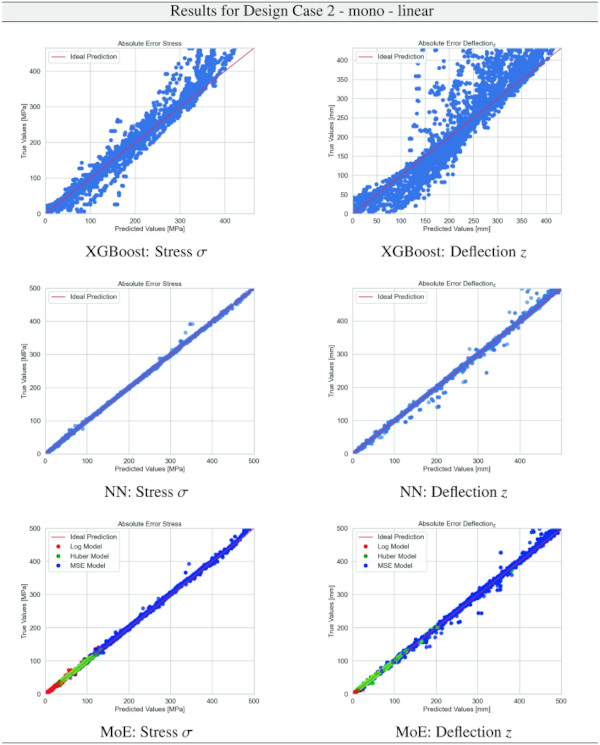
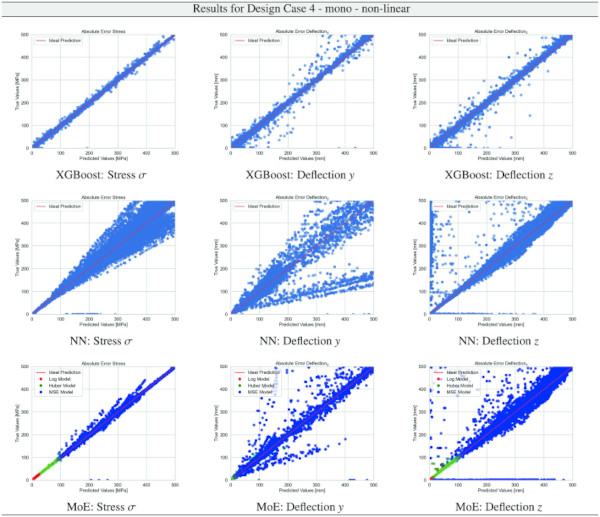
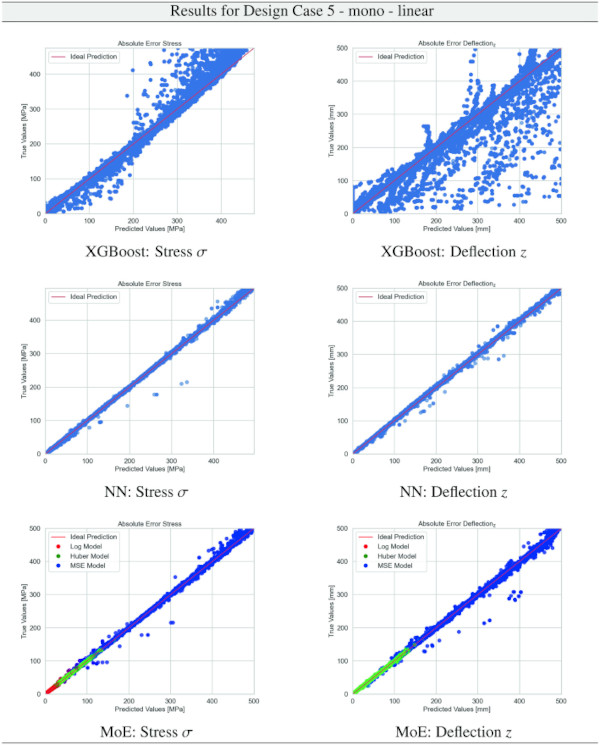
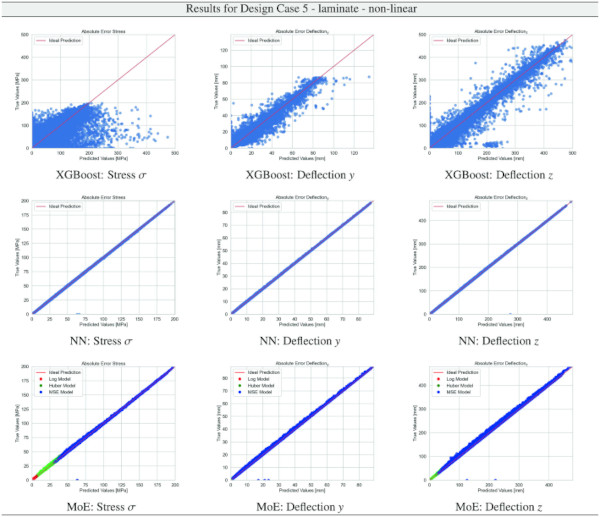
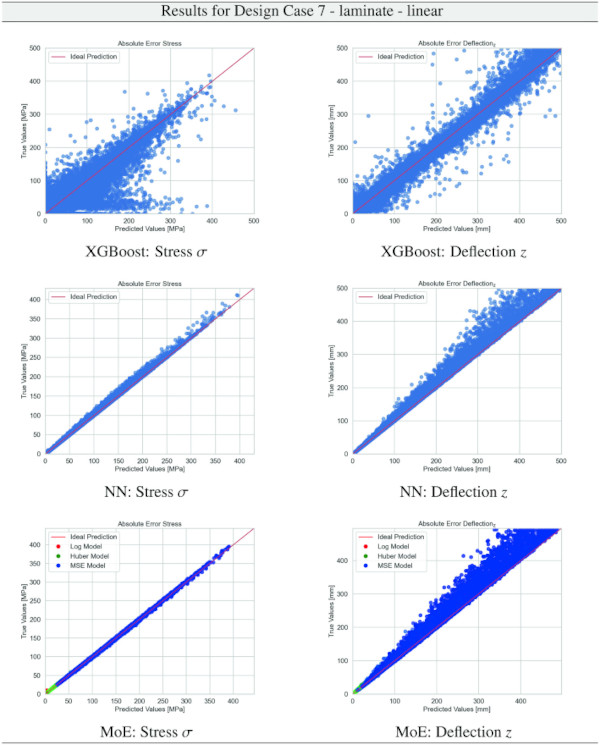
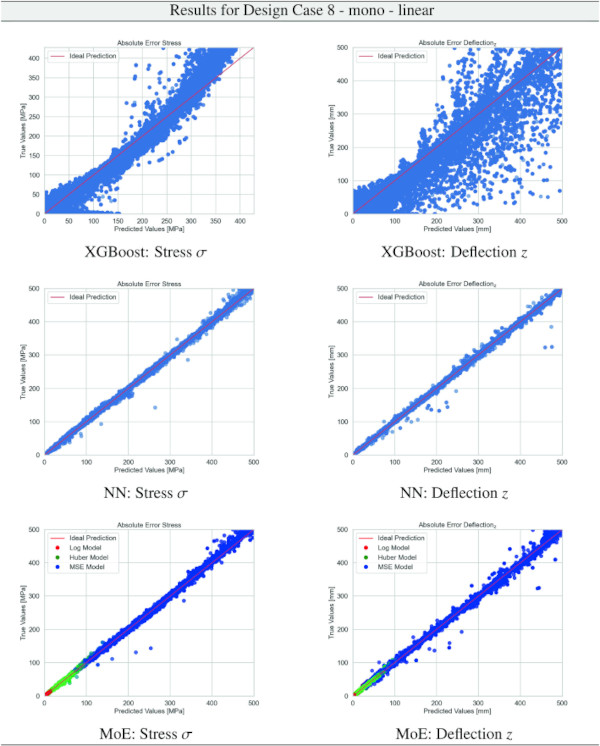
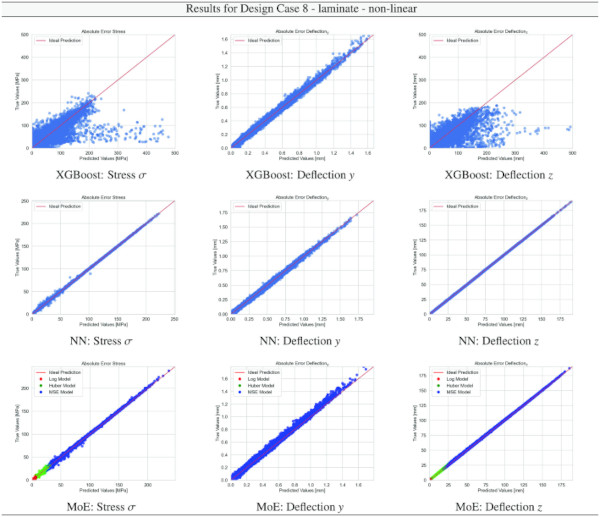
Building on our comparative analysis, we perform a more detailed evaluation of model performance through figures that juxtapose predictions against actual data. These figures are systematically organized in a table, segmented by design case, glass setup, and underlying computational theory. Each figure comprises six (for linear theory) or nine (for non-linear theory) subplots for the three key metrics: normal stress σ, deflection in the y-axis (only in non-linear theory), and deflection in the z-axis, evaluated across the XGBoost, Baseline NN, and MoE models. The diagonal line in the subplots represents the perfect prediction. In the plots where we report the performance of our MoE model, we also coloured the samples according to the weights that the gate attributed to each of the three experts in the ensemble: the red value indicates the weight of expert 1 trained with the log-loss, green for expert 2 with the Huber loss, and blue for expert 3 with MSE loss. The weights for each expert are used as RGB values for colouring each sample.
5 Discussion
The inception of Strength Lab AI marks a significant milestone in the interdisciplinary collaboration between M &M and Kuraray, aimed at the forefront of innovation in facade engineering through the integration of ML/DL methodologies. The fundamental objective of this endeavour was to develop a computational tool that amalgamates advanced data-driven techniques with domain-specific expertise in facade design, thereby facilitating a paradigm shift in the architectural and engineering design and analysis processes. From the outset, the project was underpinned by a first rigorous requirement analysis phase, wherein “user stories” were meticulously curated to encapsulate the diverse spectrum of design and analysis scenarios prevalent in facade engineering. This critical phase in the development process involved the iterative dialogue between M &M and Kuraray, which facilitated the synthesis of Design Cases. This user-centric approach ensured the alignment of the tool’s capabilities with the real-world needs of practitioners, emphasizing scenarios such as the selection of appropriate structural systems (cantilever, single-span beam, and four-sided supported plate) and the accurate assessment of loading conditions for glass structure design. The tool provides a structured workflow that guides users through the decision-making process, from selecting structural configurations to determining optimal glass setups. By leveraging state-of-the-art ML/DL techniques, the tool offers a rapid yet rigorously validated approach to facade design and analysis.
Inspection of the PDFs of the stress and deflection results from FEA, as reported in Sect. 4.1 in Tables 3, 4, 5, 6, 7, 8, underlines necessary attention for the characteristically exponential distribution inferred from the datasets. Such a distribution, characterized by a pronounced skew towards larger values, poses non-trivial challenges in regression-based ML resp. DL frameworks. Conventionally, regression models under common loss functions presuppose a Gaussian error distribution, an assumption that is refuted by the observed data’s exponential nature. This discrepancy can precipitate biased estimations and impede model performance, given the propensity of these models to underfit the data’s tail region. Moreover, the skewed distribution exacerbates the complexity of gradient-based optimization strategies, which are quintessential to training ML/DL models. The resultant gradient instability can significantly obfuscate the convergence process, thereby undermining the model’s reliability and predictive accuracy.
The comparative analysis between the outcomes derived from XGBoost and Baseline NN models versus those obtained from our bespoke MoE framework (cf. Tables 10, 11, 12, 13, 14, 15, 16, 17, 18, 19, 20, 21, 22, 23, 24, 25, 26, 27, 28, 29, 30, 31, 32, 33) underscores the advantages inherent to our methodology. Utilizing specialized loss functions designed to mitigate the challenges associated with the data distribution and prediction objectives is pivotal in enhancing model performance. Our MoE ensemble learning method defines experts, each trained with custom loss functions tailored to the specifically modelled regions of the exponential data distribution: one expert uses a Mean Squared Logarithmic Error to focus on small values. In contrast, another expert utilises the standard Mean Squared Error to focus on large values in the tail of the distribution. A gating network weights the contributions of these experts via a parametric softmax with a trainable temperature coefficient τ. This is further exemplified in the results plots, where the MoE methodology conspicuously outstrips the baseline models across a multitude of Design Cases regression tasks, thereby attesting to its pronounced enhancements in predictive accuracy.
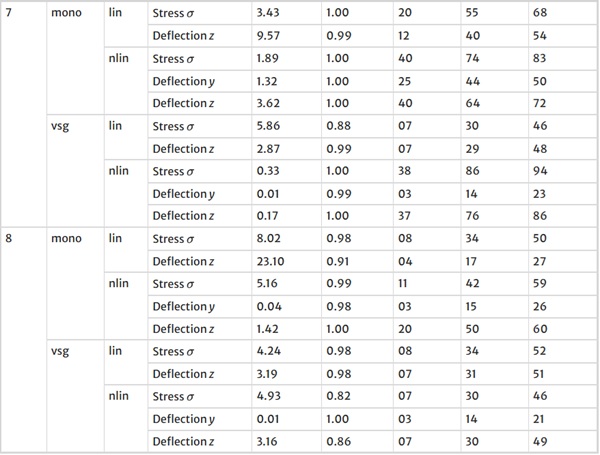
The XGBoost model’s training outcomes, as illustrated in Table 34, offer insights into its performance across all design cases. The model exhibits commendable predictive accuracy, as reflected by R² values, with the majority hovering close to 1.00, indicating a strong correlation between predicted and actual values. However, the Mean Absolute Error (MAE) and the distribution of relative errors reveal areas where the model’s performance could be improved. In linear cases with mono setups, the model shows good predictive capability, with MAE values and a substantial portion of predictions within 10% error margins. The performance slightly dips in non-linear cases, hinting at the model’s varying adaptability to complex stress and deflection behaviours under different theoretical conditions. A notable divergence is observed in cases involving VSG, where the MAE surges, especially in non-linear scenarios, and the R² values drop notably. This suggests a challenge for the model in capturing the intricate behaviours of VSG setups under non-linear stress and deflection conditions, with a significant decrease in the accuracy of predictions. The relative error distribution further contextualizes the model’s performance, with fewer predictions falling within the tighter <1% error threshold in more complex cases.
The training results for the NN model, as given in Table 35, highlight the predictive capabilities of neural networks in regression tasks. The model demonstrates improved precision compared to XGBoost, especially in linear assumptions and VSG setups, where most predictions fall within a 1% error threshold. However, performance variations in non-linear scenarios and mono-glass setups suggest the model’s interaction with structural complexities could benefit from further refinement.
The results for our customized MoE model, presented in Table 36, exhibit a significant improvement in predictive accuracy compared to the baselines, despite having nearly 40% fewer parameters than the best-performing baseline NN. The MAE values, particularly low for stress σ predictions in both monolithic and VSG setups, underscore the model’s precision in capturing the essential stress distribution characteristics under various loading conditions. The relative error metrics highlight the model’s adeptness at generating highly accurate predictions for most of the dataset, with a significant proportion of predictions falling within the 5% error margin.
However, all models, including the MoE, confront significant challenges in predicting y-direction deflections. The intrinsic complexity here stems from the particularly pronounced exponential distribution pattern of y-deflection values, compounded by the presence of numerically small values. These small values are problematic, as they hover near the limits of floating point computational accuracy, making precise prediction inherently difficult.
Nevertheless, the MoE model demonstrates a significant improvement, surpassing baseline models by almost 10% in terms of accuracy, as measured by the proportion of predictions within a 5% error margin, cf. Table 9.
Note that deflections in the y direction are only of engineering concern for structural systems where the deflection must not cause the glass system to fail due to slipping from the support. Overall, the MoE model’s efficacy in simulating the complex behaviour of laminated structures under varied conditions is evident.
6 Conclusions
The goal of this common development project between Kuraray Europe GmbH and M &M Network-Ing UG (haftungsbeschränkt) was to develop the so-called Strength Lab AI tool, covering the most common situations (called “Design Cases”) for design and analysis of glass structures at LOD 400: (i) monolithic, laminated and insulation glasses; (ii) structural system: cantilever, single-span beam, Navier-supported plate; (iii) line as well as area loading and their combination, and (iv) design in the ULS and SLS according to ASTM E1300, EN16612/EN16613 as well as DIN 18008 standard. At the heart of the tool lies a custom-developed and trained Mixture-of-Experts Neural Network for fast and accurate predictions of normal stresses and deflections per Design Case.
In this investigation, the performance of various predictive ML/DL modelling techniques is scrutinized across a range of structured data scenarios, specifically within the context of engineering design cases. XGBoost, a renowned gradient-boosting framework, has historically demonstrated superior performance in handling tabular data. It frequently surpasses conventional deep learning models in such tasks due to its efficiency in capturing complex data patterns and relationships in structured datasets. However, the findings from this work present a notable deviation from this established trend. Experiments with baseline models, XGBoost, and a simple Feedforward Neural Network resulted in the heavy-tailed exponential regression target data not fitting well. We proposed to include some domain knowledge in the AI modelling approach of the data in the form of a MoE network architecture with tailored prediction intervals and accuracy regions reflected in bespoke loss functions associated with an expert.
The juxtaposition of baseline models, including XGBoost and Baseline NN, with the MoE approach, reveals the MoE’s superior ability to navigate the complexities and heterogeneities inherent in engineering data, particularly in scenarios laden with non-linear interactions. This comparative analysis not only underscores the MoE framework’s adeptness in rendering precise and nuanced predictions but also highlights the necessity of employing a modelling strategy that is adaptable and meticulously aligned with the unique demands of the dataset at hand. The MoE approach’s consistent outperformance across various design cases is attributed to its integration of multiple specialized models, or “experts,” each attuned to distinct segments of the problem space, thereby facilitating a more granular and accurate data representation. This is especially beneficial in addressing design parameters’ intricate and varied nature within engineering scenarios. Moreover, the MoE’s gating mechanism, which strategically allocates the influence of each expert based on the data’s specific traits, significantly bolsters the model’s adaptability and precision. Our findings, particularly the near-ideal R² values and the maintenance of a maximum of 5% relative error in 90% of VSG and non-linear cases underscore the Strength Lab AI tool’s reliability and the MoE approach’s potential to redefine predictive modelling paradigms in complex, structured data environments, signalling a promising direction for future advancements in the field.
While Strength Lab AI represents a significant advancement in integrating ML/DL techniques within facade engineering, it is essential to acknowledge certain limitations inherent in the current iteration of the tool. Primarily, the output is confined to providing only information on the maximum stress and deflection values without giving details on the distribution of these fields over the system and setup. The absence of load combination capabilities further constrains the tool’s utility, as real-world facade engineering often necessitates the consideration of multiple simultaneous loadings to ensure comprehensive safety and performance assessments. Verifying multiple loading scenarios remains a manual process driven by the user. Strength Lab AI is currently limited to nine specific Design Cases concerning structural systems. While these scenarios encapsulate a broad range of common facade engineering challenges, this limitation may restrict the tool’s applicability to more nuanced or unconventional design requirements outside these predefined cases.
Additionally, a notable area for future enhancement lies in the tool’s current lack of training data on Insulating Glass Unit (IGU) computations. Given the prevalent use of IGUs in modern facade systems for their superior thermal and acoustic insulation properties, this omission may impact the tool’s effectiveness in delivering optimal design solutions. Integrating IGU-related computations could significantly elevate the tool’s performance and economic value proposition by enabling more accurate simulations of thermal stresses and deflection behaviours, thereby offering more comprehensive and energy-efficient design solutions.
In conclusion, Strength Lab AI embodies the transformative potential of ML/DL in redefining traditional paradigms in facade engineering. The tool’s development process, characterized by a synergistic collaboration between computational structural analysis and facade engineering experts, sets a new benchmark for integrating AI in architectural and engineering design. Through its user-centric design and interfaces, comprehensive coverage of Design Cases, and robust analytical capabilities, Strength Lab AI offers a novel approach to facade design that is both innovative and grounded in industry-relevant methodologies. By its design, the tool will drive the industry forward.
Code and data availability
The data and codes for this project are confidential but may be obtained with Data Use Agreements resp. Code Use Agreements with the M &M Network-Ing UG or Kuraray Europe GmbH. Researchers interested in accessing the data and/or code may contact Univ.-Prof. Dr. Michael A. Kraus at kraus@mm-network-ing.com.


 demonstrator at Glass Technology Live during Glasstec 2024 (© Cas Maertens).")