
Source: Glass Structures & Engineering
Authors: Jackson L. Jewett, Anna Maria Koniari, Charalampos P. Andriotis, Faidra Oikonomopoulou, Telesilla Bristogianni & Josephine V. Carstensen
DOI: https://doi.org/10.1007/s40940-025-00294-3
Abstract
Advances in structural glass have enabled a new paradigm in expressive and transparent architecture. Cast glass can further extend the possibilities of structural glass by allowing for more complex and sophisticated shapes than the current planar geometries of structural float glass. However, the use of cast glass is currently limited because of the lengthy annealing process, making massive component sizes impractical to fabricate. Topology optimization (TO) has been proposed as a solution to this problem, as it is known to generate structurally efficient designs with a low volume of material. If tailored appropriately, TO can reduce component sizes and thereby diminish the total annealing time needed, while intelligently placing material in the areas where it will be utilized most effectively. For TO of glass to be successful, algorithms must properly capture glass’s specific material behavior. This research proposes a suite of TO algorithmic frameworks that design specifically for structural glass. These algorithms are demonstrated in a 2D design space, and the resulting geometries are fabricated using cut float glass and tested for experimental comparison on a 4-point bending load case. The results of these experiments provide valuable insights into the development of TO for structural glass, and help inform future research in TO of large-scale cast glass structures.
1 Introduction
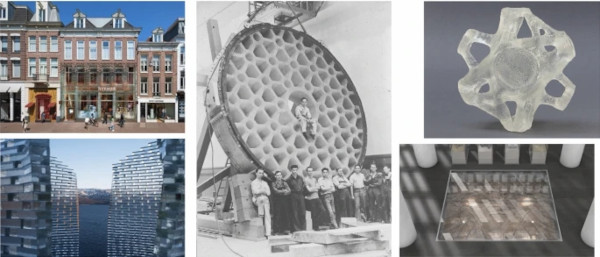
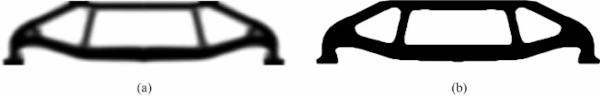
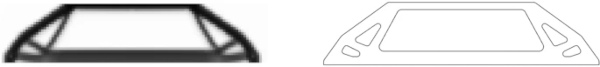
Cast glass is a promising expression of the material for creating free-form monolithic glass structures that go beyond the two-dimensionality of float glass and fully utilize its compressive strength, which is higher than that of concrete and even steel. By pouring glass into molds, virtually any shape and size of a glass component can be produced. This vast shaping potential of cast glass, although extensively demonstrated in the field of glass art, has so far been underexplored in structural applications in the built environment. The most characteristic examples of load-bearing cast glass for architectural applications are tessellated structures, which utilize solid cast glass blocks of no more than 10 kg in mass. Examples of this approach are shown in Fig. 1. The limited volume of these structural components is necessitated by the lengthy annealing process required by glass components of substantial cross-section, which in turn renders their production unrealistic due to the associated high energy and manufacturing costs.
The main factors influencing the annealing time are the glass composition and geometry, particularly the relevant cross-section and mass distribution (Shand and Armistead 1958). Geometrically, the annealing time increases exponentially when a large cross-sectional dimension of a glass component is employed (Oikonomopoulou et al. 2018). As an example, a soda-lime solid glass block of the Crystal Houses façade of 65 mm × 210 mm × 210 mm in dimensions and 7.2 kg weight required 36–38 h of annealing. This is 4 times more than a soda-lime block of 50% less volume (65 mm × 210 mm × 105 mm and 3.6 kg weight, 8 h of annealing) used in the same project.
Accordingly, optimization of the stiffness-to-weight ratio can result in cast glass structures of considerably larger overall dimensions and, at the same, of a significantly reduced required annealing time (Oikonomopoulou et al. 2018). The benefits of these strategies are well demonstrated by the monolithic cast glass blanks of the giant telescope mirrors. The Palomar Observatory telescope blank is shown in Fig. 1 as an example. These blanks follow a honeycomb structure, guaranteeing the desired high stiffness with a substantially reduced mass (Bennet 2024). The choice of a low-expansion glass and the decreased material volume enabled the casting of multi-ton monolithic disks of up to 8.4 m in diameter (Oikonomopoulou et al. 2018; Zirker 2006).
In this regard, Topology Optimization (TO) exhibits great potential for the design of massive cast glass structures, enabling the design of relatively lightweight monolithic structural forms that maximize stiffness while minimizing volume. This can allow for significantly reduced annealing times, yielding additional benefits in fabrication time, embodied energy, and cost efficiency, rendering such structures feasible to manufacture. Previous research by the authors (Damen et al. 2022; Oikonomopoulou et al. 2022) utilizing commercial TO software has proven the potential of this approach to engineer glass components of minimum mass, examples of which are shown in Fig. 1. However, that research also sheds light on the shortcomings of available TO software for designing glass structures. Existing TO software is typically developed for isotropic linear elastic materials, and is not able to fully incorporate essential characteristics of brittle materials like glass, in particular their asymmetric responses to tensile and compressive stresses (Damen et al. 2022).
In order to use TO for design of cast glass structures, it is therefore necessary to develop a materially-specific TO framework for structural glass design. Previous work by the authors has developed a system for TO of cast glass (Koniari et al. 2023) which serves as a cornerstone of this research. With this exception, the constraints associated with glass structures have received little explicit attention in the literature, despite there being considerable research devoted to manufacturability of TO structures (Lazarov et al. 2016). The most critical factor is the design tensile strength of glass, which is at least a magnitude lower than its compressive strength (Oikonomopoulou 2019). Hence, the TO formulation should reflect the asymmetrical strength of glass. Such consideration has been achieved in TO through stress-based approaches, by implementing either the Drucker–Prager failure criterion (Bruggi and Duysinx 2012, 2013; Luo and Kang 2012) or unified functions that can serve different failure criteria (Giraldo-Londoño and Paulino 2020). It has also been pursued through stiffness-based models, in which material in tension is given a lower elastic modulus than material in compression (Cai 2011; Du et al. 2019; Querin et al. 2010). Although the authors have used physical tests in concrete to evaluate stress-based optimization (Jewett and Carstensen 2019), experimental work on glass-specific TO has not yet been performed.
While precedents exist for TO frameworks that could be used for glass design, there lacks research on how successful the different approaches would be for real-world application. Therefore, this paper compares three distinct TO algorithms, which use different approaches in designing for structural glass. These three algorithms are used to design structural glass specimen, which are fabricated and tested to evaluate the efficacy of their respective optimization frameworks. Although this research is heavily motivated by the potential of cast glass, the methods ought to be broadly applicable to structural glass design. For this reason, experimental specimen are cut from float glass using a waterjet cutter, rather than cast. This fabrication method is less labor-intensive than casting, and guarantees that the glass will be equally homogeneous in all specimens; the probability of random defects such as bubbles or cord appearing in the glass is close to zero. This allows for more rapid and reliable testing of the optimization methods. The results of these experiments present valuable data for best practices in TO of glass, and help lay the foundation for research specifically on TO of cast glass structures in future work.
2 Methods
This research seeks to compare the performance of three different topology optimization algorithms for design of materially-efficient glass structures. In the following sections, the selected optimization algorithms are discussed. Additionally, the fabrication and testing methods for the built specimen are described. All algorithms follow the density-based approach (Bendsøe and Sigmund 2004), with filtering to avoid numerical instabilities and penalization of intermediate densities using SIMP (Bendsøe, 1989). In the SIMP formulation, the elastic modulus of element e, Ee, is modified by a penalization variable η, such that:
![]()
where ρe is the density of element e after filtering the design variables x, E0 is the stiffness of the material, and Emin is a very small number added to avoid singularities in the stiffness matrix. This formulation follows the methodology in the 88 Line Code (Andreassen et al. 2011). The penalization variable η is given a value larger than 1 to promote binary (0–1) solutions with discrete material layouts. When using η > 1, the optimization problem is no longer convex and the solutions found in this work are therefore local minima, where the quality of the solutions are sensitive to the η-value (Ha and Carstensen 2024). Typically, η=3 is used as recommended by Bendsøe and Sigmund (Bendsøe and Sigmund 2004). The filter radius is also used to establish a minimum feature size, with improves manufacturability for the waterjet cutting used for fabrication. Soda-lime-silica float glass with 10 mm thickness is used for the physical experiments, and its properties are targeted for the optimization simulations.
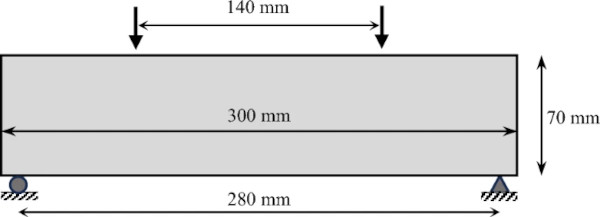
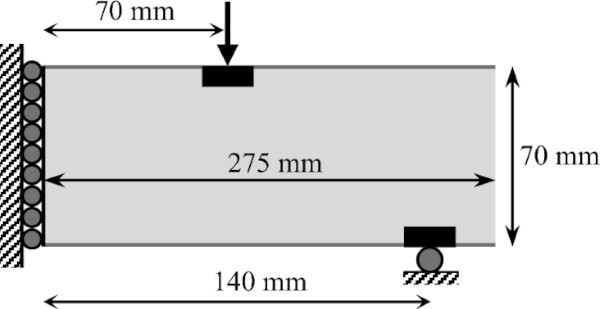
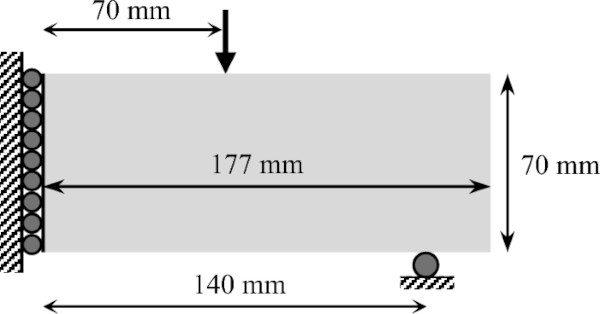
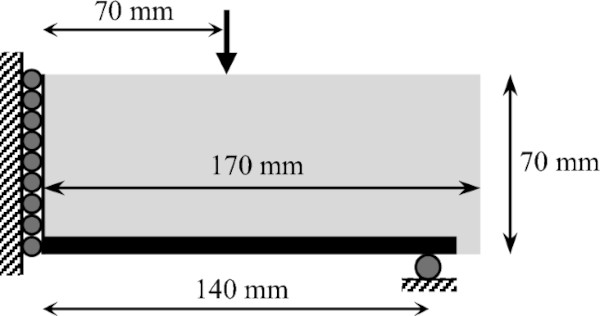
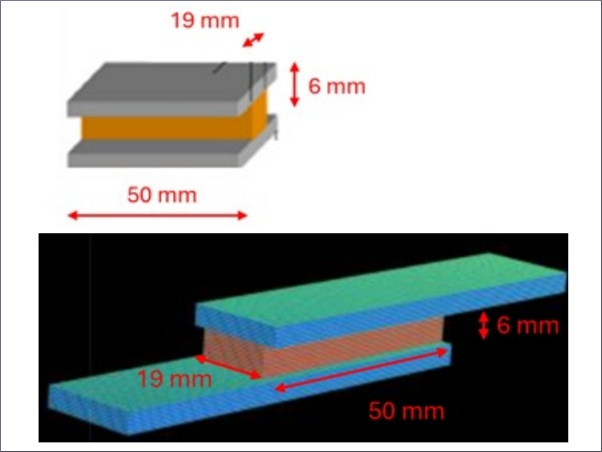
All three optimization methods are demonstrated on the same 4-point bending load case, the results of which are used for the physical tests performed. This load case is selected following ASTM C158-23 Standard Test Methods for Strength of Glass by Flexure. This loading condition is the industry standard for evaluating bending stress limits of glass; its merits are discussed in detail by Bristogianni (Bristogianni 2022). The specific details of the load case are shown in Fig. 2.
2.1 Optimization algorithms
For this project, three topology optimization methods are used: a stress-based optimization, a volume-based method, and a stiffness-based approach. A general problem formulation for topology optimization is:
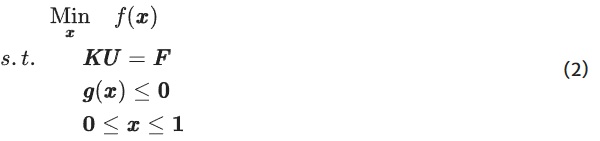
where x is the design variables, K is the stiffness matrix, U is the displacement vector, and F is the force vector. The objective f(x) is the value being minimized, and the constraints g(x) are the rules that the system must adhere to throughout the optimization process. The KU=F constraint enforces static equilibrium through finite element analysis (FEA). It should be noted that this formulation assumes no residual stresses exist within the structure. This is a potential limitation for cast glass design, as significant residual stresses can arise during the annealing process. However, to simplify the optimization problem, these manufacturing constraints are ignored in this research, and the effects of residual stresses are not considered.
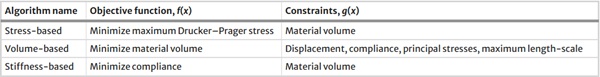
In this research, each algorithm tested uses different combinations of objectives and constraints. The stress-based optimization minimizes the maximum Drucker–Prager stress in the structure while respecting a constraint on the maximum allowable volume. The volume-based method minimizes the material volume with constraints on maximum displacement and compliance, principal stress values (in tension and compression), and the maximum thickness of structural members. The stiffness-based approach minimizes the compliance of the structure with a maximum material volume constraint. The names used for the algorithms herein, as well as their objective functions and constraints, are shown in Table 1. The specific algorithms are discussed in the following sections.
Table 1 Names of all three optimization algorithms used, with associated objective functions and constraints - Full size table
2.1.1 Stress-based optimization
A stress-based optimization algorithm is used for the first TO method in this work. Controlling the stresses within a structure has great potential for optimal glass design because glass tends to fail from tensile stresses. Thus, a useful optimization framework would minimize the tension stresses within the structure to generate high-capacity geometries.
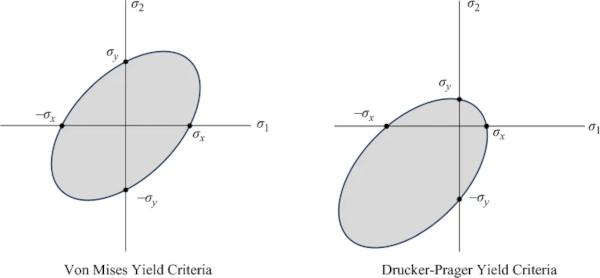
The Drucker–Prager failure criteria is a popular method for capturing failure modes that are unequal in tension and compression. Unlike Von Mises stresses, which treat tension and compression equivalently, Drucker–Prager has a set of additional terms that account for directionally-dependent stress responses. The differences between the two failure criteria are highlighted in Fig. 3. To predict failure, the stress states of the material are mapped on the x and y axes of the graphs. No failure occurs if their coordinates land within the gray ellipse. However, when the stresses are high enough to reach the yield surface, the material fails. Figure 3a shows the Von Mises failure criteria, in which the magnitude of the maximum negative stresses are the same as the maximum positive stresses. In this case, compressive and tensile stresses would cause failure in the material equally. By contrast, Fig. 3b shows the Drucker–Prager failure criteria, with different allowable magnitudes for negative and positive stresses. In this case, the magnitude of −σx and −σy are greater than those of σx and σy, which causes the model to predict higher compressive capacity.
This work tests the effectiveness of a TO algorithm for glass design that minimizes Drucker–Prager stresses in the structure with a constraint on how much material can be used. The stress-based topology optimization code published by Deng et al. (Deng et al. 2022) is used as the backbone of the algorithm, where this work replaces the Von-Mises stress, σvm, with a Drucker–Prager failure criteria σDP. The original code is formulated to work in 3D, but in this research all examples are executed with one element in the out-of-plane direction, to approximate a 2D problem. The reader is directed to the original paper for a more comprehensive description of the algorithmic details and gradient calculations.
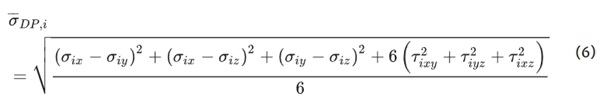
The gradients for Von Mises stresses from Deng et al. are modified in this work to be compatible with Drucker–Prager stress analysis. To do so, the process laid out by Luo and Kang (Luo and Kang 2012) is followed. A maximum allowable compressive stress σc and tensile stress σt are defined, which are then used to calculate the ratios α and H, such that:
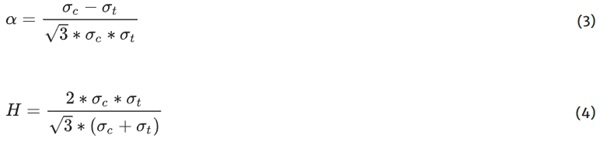
Using these ratios, the Drucker–Prager stress of element i, σDP,i is calculated as:
![]()
where:
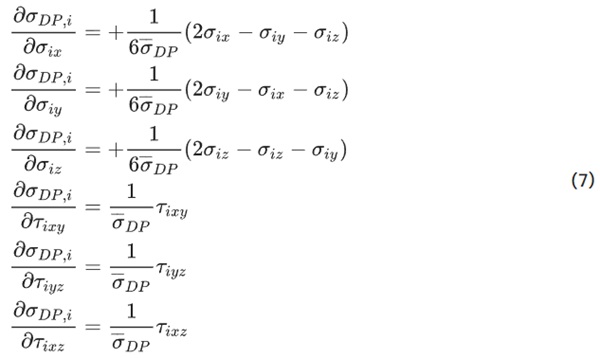
The critical modification in the gradients from Deng et al. lies in how the stresses change with respect to the element’s internal stresses. For the work herein, those gradients are:
This project seeks to minimize the maximum Drucker–Prager stress in the system. To calculate the maximum value in a way that is differentiable, the p-norm is used, as is done in Deng et al. The p-norm can be used to approximate the maximum value in a given set of numbers, but will not yield the exact solution in most cases. Readers are referred to Deng et al. for further description, as well as for explanation of the associated gradient calculations. The p-norm is calculated as:
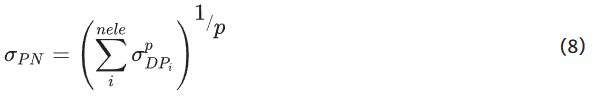
where σPN is the p-norm estimation of maximum stress, nele is the number of elements in the optimization problem, and p is an exponent value chosen by the user. The equation tends to yield a more accurate estimation of the maximum stress when a higher value of p is chosen, but high values may also lead to suboptimal results in local minima. Therefore, the solution to the optimization problem is highly sensitive to the chosen value of p, as shown in Fig. 5.
This algorithm uses the Method of Moving Asymptotes (MMA) optimizer (Svanberg 1987) for solving the optimization problem. The problem formulation is stated as:
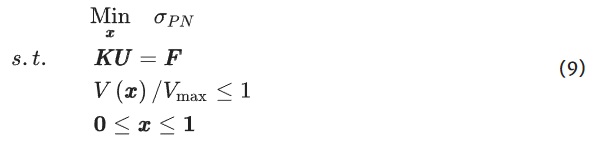
where V is the material volume and Vmax is the maximum volume constraint.
The optimization framework is demonstrated on a cantilever load case, with parameters varied to highlight benefits and challenges of the code implemented herein. The load case is shown in Fig. 4 and the generated designs are shown below in Fig. 5.
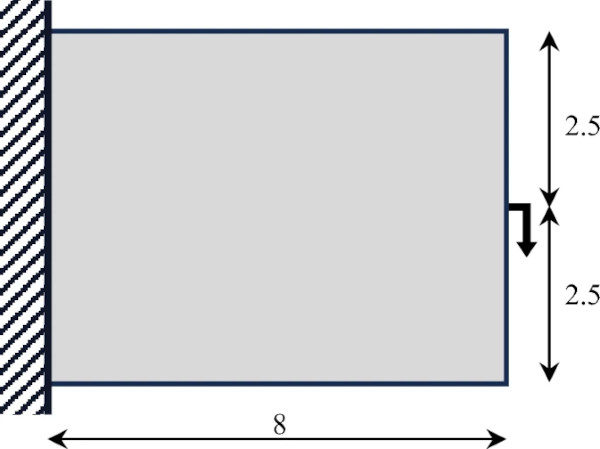
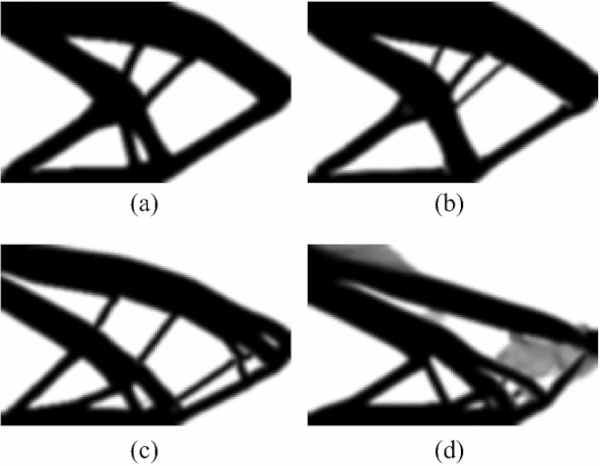
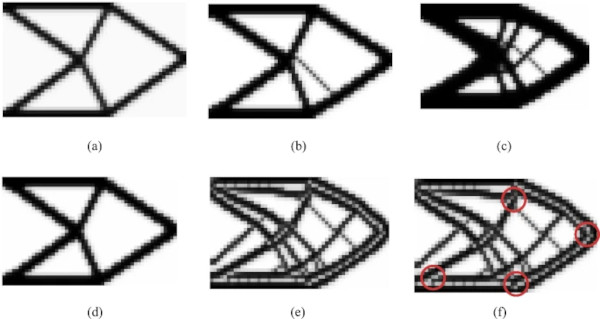
Figure 5 shows the effects of choosing different values for σc and σt within this optimization approach. In all cases shown, σt=1 and the volume constraint is set to 50%. The compressive limit in Fig. 5a is set to σc=2, and in Fig. 5b σc=8. In these cases, it can be seen that more material is massed into the tension chords of the designs. These results are promising, as they reflect the desired ability to account for the weakness of glass in tension. However, it is also observed that the optimization is sensitive to parameters, particularly when the ratio of σc/σt is high. For all results in Fig. 5, continuation is used on the optimization parameter η. The optimization starts with η=3, and increases to η=5 by increments of 0.5 every 50 iterations, with 250 iterations in total. For the examples shown in Fig. 5a, b, the value of the p-norm exponent p is equal to 2.
It is noted that modest changes in the optimization parameters make significant differences in generated designs. In Fig. 5c, d, the optimization is identical to 5b, except that p has been changed from p=2 to p=4 and p=8, respectively. The outcomes in 5b and 5c differ greatly, and 5d has failed to converge into a manufacturable result.
The change from Von Mises to Drucker–Prager stress evaluation is found to increase the difficulty in solving the TO algorithm. In particular, it is found that the high stress concentrations at load and support locations present great difficulty. Because the optimizer is trying to minimize the maximum stress in the system, it can behave unpredictably when it is not possible to reduce the stresses at these concentration points. This could be addressed through regional stress measures, as is done in Le 2010 (Le et al. 2010), but such implementation is not carried out here. Additionally, the Drucker–Pager stress function is highly-nonlinear, making the design problem difficult to navigate with a gradient-based optimizer. As demonstrated in Fig. 5, the optimizer had greater difficulty converging as the ratio of σc/σt increased. Therefore, although the ratio of design tension and compression capacities in glass can be very high (this research uses 78:1 for the volume-based design), the compressive and tensile capacities in the stress-based design are set at σc=2 and σt=1. These values are chosen because they exhibit the desired behavior of massing more material in the tension zones of the structure, while still producing manufacturable results. However, they do not reflect real values related to the behavior of glass in this case.
To help ease the optimization for the desired 4-point bending load case, material is enforced at the point where the load is applied, as well as the location of the support. These material blocks are set to be approximately 8 mm × 20 mm, to satisfy fabrication constraints. The row of design variables along the top and bottom of the design space is also deactivated to prevent structural members from becoming smaller than the prescribed minimum radius values, which is a modification of the recommendations in Clausen and Andreassen (Clausen and Andreassen 2017). Because the load case is symmetric, only half of the structure is modelled during the optimization to reduce computational costs. The load conditions used are shown in Fig. 6.
With these conditions set, the design shown in Fig. 7a is generated. A 175 × 70 element mesh is used, with filter radius of 3 to define the minimum feature size based on manufacturing constraints, and the volume constraint set to 0.33. The p-norm variable p is equal to 6, and the penalization starts at η=2 but is increased to η=6 by increments of 2 every 50 iterations, running for 150 iterations total. To address the gray density values in the results, all elements greater than 0.2 are rounded up, for the 0–1 results shown in Fig. 7b.
2.1.2 Volume-based
The second optimization approach aims at mass minimization with concurrent application of structural and manufacturing constraints. These are implemented as constraints on the displacement, compliance, and principal stresses (in both tension and compression), as well as through establishment of maximum and minimum cross section. These constraints follow the main principles discussed in Koniari et al. (Koniari et al. 2023).
The structural constraints—including global equilibrium, principal stresses, displacement, and compliance—are calculated using 2D finite element equations assuming plane stress. The displacement is evaluated at the upper middle node of the domain, which is considered a critical node of the structure. The application of the compliance constraint follows the formulation described in Bruggi and Duysinx (Bruggi and Duysinx 2012). In the case of principal stresses, tensile and compressive stress are evaluated individually and are extracted from the eigenvalues of the stress tensor. The ‘qp’ approach for stress constraint relaxation as described in Bruggi (Bruggi 2008) is additionally implemented to prevent from the arising of zero stresses in void elements.
A minimum feature size is approximated through filtering, and the maximum structural member sizes are also controlled according to the maximum length scale approach (Guest 2009). Although the maximum length scale is not pertinent for the float glass experiments described herein, it will be crucial for future works in cast glass given the importance of annealing constraints. Controlling the maximum member size can reduce annealing time, and, thus, of the total energy cost of the structure. Further, setting the minimum and maximum feature sizes to be of similar values will mitigate residual stresses in the glass by making the relative cooling rate between members during annealing nearly equal.
It should be noted that buckling is not taken into account in this formulation, nor the other optimization frameworks described in this paper. This may incentivize the use of slender members in the design space that would fail in real-world application. This shortcoming can be controlled indirectly with the minimum length scale approach or through post-processing, but could present critical challenges, especially at larger scales. Buckling has been addressed in other topology optimization works, such as the TopBuck250 code (Ferrari et al. 2021).
This algorithm uses Matlab’s built-in Interior Point method as the optimizer, and the sensitivities are calculated using finite difference. With the above considerations, the problem formulation is:
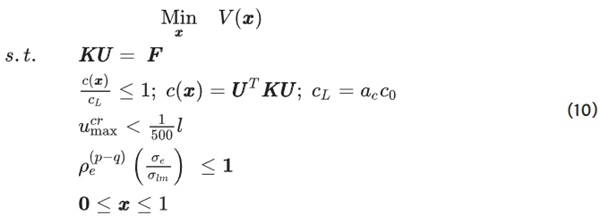
where c is the compliance and cL is the allowable compliance defined by a compliance limit c0 and a relaxation variable ac. The maximum nodal displacement of the critical node is ucrmax and l is the length of the structure. ρe is the pseudo-density value of each finite element e echoing the presence or lack of material in it, referenced in Eq. 1; p is the penalization value; q is the exponent connected to the ‘qp’ approach (Bruggi 2008); σe is each individual principal stress (tensile or compressive) obtained per finite element and σlm is its respective limit. The limits used in this optimization are shown in Table 2, based on experimental findings by the authors and conservative assumptions of manufacturing defects (Oikonomopoulou et al. 2017).
Table 2 Target values for structural and manufacturing constraints - Full size table

In Fig. 8, this optimization approach is demonstrated on several cases using the same cantilever load case as shown in Fig. 4. In all examples, a load of 300 kN is applied, and a mesh resolution of 53 × 33 elements is used. This resolution is significantly lower than the examples shown above in Fig. 5 and below in Fig. 13, which makes direct comparison difficult. However, the coarse mesh is chosen because the volume-based optimization is much more computationally expensive than the stress-based and stiffness-based algorithms. This is primarily because the gradients in the volume-based method are calculated using finite-difference, which is computationally taxing compared to calculating gradients analytically. This makes optimization on finer meshes infeasible. For additional details on this optimization approach, the reader is referred to the original paper describing this work (Koniari et al. 2023).
The optimization results in Fig. 8 show how modifying the constraints affects the resulting geometries. For the results in Fig. 8a–d, the annealing constraint is not active. In Fig. 8a, b, c, the parameter ac is incrementally decreased, which controls the relaxation of the compliance constraint. As ac decreases from 5 to 3 and 1.7, respectively, more material must be added to the system to satisfy the compliance constraint. These examples show how the severity of constraints affects the design output. In Fig. 8d, the parameters are identical to 8b, except that the tensile strength constraint is removed. Most noticeably, this results in the removal of the central tension strut. This is done because there is no need to provide additional support in the tension zone of the structure given that the tensile strength constraint is not considered. The constraints in Fig. 8e are also identical to 8b, but the annealing constraint is activated. In this case, rather than placing a small number of thick structural elements in the design space, several chords of smaller dimension are used. This is done to maintain the structural integrity of the design while respecting the maximum length scale constraint. However, as are highlighted in Fig. 8f, it can also be seen that elements with intermediate densities are added between the smaller chords to reinforce the structure while simultaneously respecting the annealing constraint. Therefore, these designs would require further post-processing to be manufacturable.
In this paper, the formulation was adjusted to reflect the 4-point bending setup used for the experiments, shown in Fig. 9. The final outcome is extracted harnessing the symmetry of the structure along the middle axis, while additional alterations for fabrication purposes were incorporated, such as the avoiding of sharp edges, leading ultimately to the final design used for the experiments. The implementation of the maximum and minimum length scale constraints leads to a truss-like geometry, shown in Fig. 10.
2.1.3 Stiffness-based
For the third method, a force-dependent stiffness orthotropy is enforced to encourage more material to be placed in the tension zones of the structure. In reality, glass is an isotropic material (Shelby 2005). Its elastic modulus is the same in compression as tension. However, as mentioned, the primary failure mode of glass is caused by tensile stresses interacting with pre-existing defects (Shelby 2005). For this reason, it is advantageous to develop a TO algorithm that masses more material in the tension zones of the structure to help reduce tension stresses and thus increase the structural capacity of the element. The third algorithm herein thus tests the viability of using a stiffness-based approach for the TO design of structural glass.
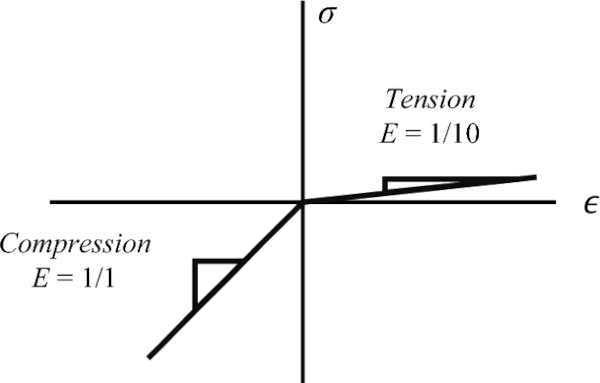
In the stiffness-based algorithm, compliance is taken as the objective function, which is the product of the magnitude of the force and the node displacement at the location of the applied force. To account for glass’s weakness in tension, the stiffnesses of the underlying finite elements are modified so that they are stiffer when acting in compression than in tension. Although this does not reflect the true behavior of the glass, it encourages the optimizer to place more material in the tension zones to compensate for the reduced stiffness, and thereby increase the load capacity of the structure. The load-dependent stiffness modification of the finite elements is implemented (Du et al. 2016, 2019), which has been used in several related works (Du et al. 2020, 2022; Du and Guo 2014, 2016). An inner loop is added to the primary optimization loop that generates the design. The inner loop modifies the local stiffness of each element such that the elastic modulus depends on the internal stresses, as visualized in Fig. 11. This research uses a shear modulus calculation from Weaver and Johnston (Weaver and Johnston 1984) rather than that of Du et al., because it is simpler and eases convergence.
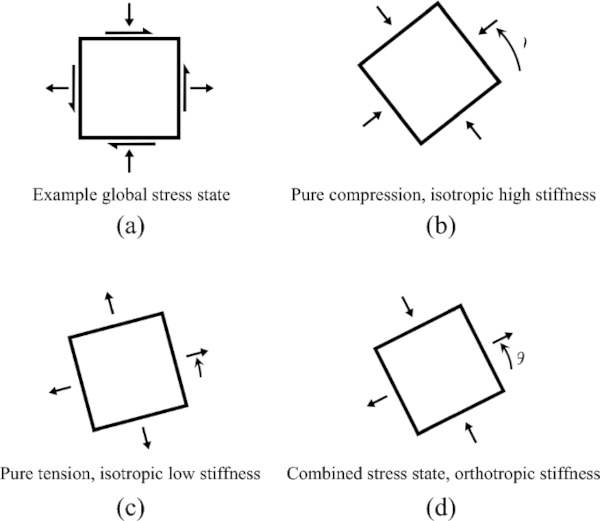
Within the inner loop, the principal stresses are calculated in each element, as well as their respective principal angle θ. Figure 12a shows a global stress state in which σx, σy, and σxy have been calculated. Figure 12b–d show the different cases that can occur after the principal stresses and principal angle have been calculated for a given element. In Fig. 12b, both principal stresses are compressive. In this case, the element is assigned isotropic material properties with a high elastic modulus. Figure 12c shows a case in which both principal stresses are tensile, which is assigned isotropic properties with a low stiffness. Figure 12d shows the orthotropic case, wherein the directionality of the two principal stresses is different. Here, an orthotropic material behavior must be applied.
The stiffness matrix of a 2D element K is defined as:
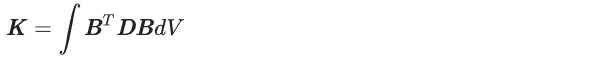
where B is the strain–displacement tensor and D is the constitutive matrix. Plane stress is assumed for all calculations. For the isotropic cases, the constitutive matrix is as follows:
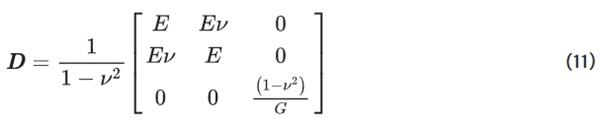
where E is the elastic modulus, ν is Poisson’s ratio, and G=2(1+ν)/E. In the isotropic case, the E value chosen would either be high or low, depending on whether the element is in compression or tension. However, in the case of a mixed stress-state, the constitutive matrix is assembled with two different elastic modulus values, E1 and E2. E1 and E2 have either a high or stiffness value, depending on the directionality of the principal stress. The constitutive matrix is first assembled in local coordinates, Dloc, as shown below:
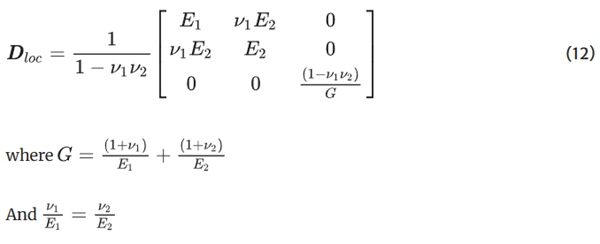
It can be seen that if E1=E2, the orthotropic constitutive matrix is equivalent to the isotropic model. The local constitutive matrix Dloc must be multiplied by a rotation matrix Q which is dependent on the principal angle θ, so that the elements constitutive matrix D is as follows:
![]()
where Q is defined as:
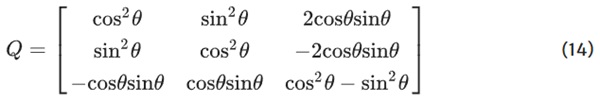
As with the stress-based approach, this algorithm uses MMA (Svanberg 1987) to solve the optimization problem. Because the force-dependent stiffnesses of the elements are set within a loop before each optimization step, this modification to the optimization does not appear in the problem formulation, which is stated as:
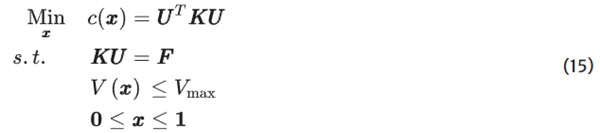
The code is demonstrated on the cantilever load case shown in Fig. 4 to illustrate how reducing the stiffnesses of the tensile material affects the resulting geometry. Material in compression is assigned a stiffness Ec, which is higher than the stiffness assigned to material in tension, Et. In Fig. 13, both examples have Ec=10,000, with Et=5000 in Fig. 13a and Et=1250 in Fig. 13b. This yields a stiffness ratio Ec/Et=2 and Ec/Et=8, respectively. It can be seen that when the material is less stiff in tension, the compressive struts become thinner, and more material is placed in the tensile zones to compensate for its diminished performance. Because this force-dependent stiffness is a non-linear phenomenon, the optimizer is found to perform better if the step size in MMA is very small. In each of these examples, the mesh density is 100 × 160 elements. The penalization variable η starts at 1 and is increased in increments of 1 every 30 iterations to a maximum value of 3. The optimizer runs 150 iterations. The filter radius value is 3. The volume is restricted to 0.5 of the design space. For more details on the behavior of this optimization approach, the reader is directed to (Du et al. 2019).
Similarly to the stress-based optimization, the design space for the stiffness-based optimization is modified slightly to improve manufacturability. In this case, material is forced to be placed along the bottom of the structure, as shown in Fig. 14.
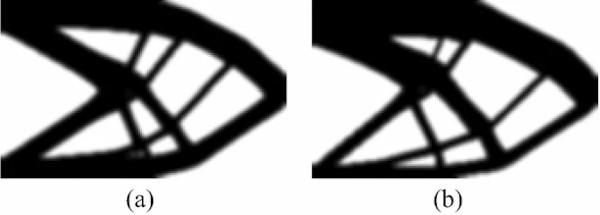
Using the stiffness-based approach for the 4-point bending load case gives the geometries shown in Fig. 15. The designs are generated with a volume constraint V = 0.39 so the resulting geometry has a similar volume to the stress-based design. A filter radius of 7 is used for manufacturing constraints. The penalization variable starts at η=1.5 and increases in increments of 0.5 every 50 iterations until it reaches η=3. Symmetry is utilized so only half of the design domain is represented during optimization, with 126 × 306 elements. Relative values of force and stiffness are used rather than aligning with the real-world values of the glass, in this case Ec = 10,000 and Et = 1000. The Ec/Et ratio is therefore equal to 10. A Heaviside projection filter (Guest et al. 2004) is applied to help sharpen the boundaries of the design.

2.2 Fabrication
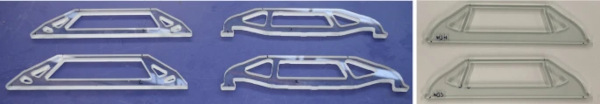
The optimization methods presented above are developed for use in glass structures. In order to test and compare the efficacy of the three presented TO methods, test samples are cut from 10 mm float glass using a Sanken CNC 5 axis (60°) waterjet cutter. As discussed in the Introduction, waterjet cutting can be done quickly and reliably, which eases comparison between the different optimized geometries. Five samples are fabricated for each of the three design cases. The fabricated designs are shown in Fig. 16.
The average masses of each design are shown in Fig. 17a. This figure also shows the estimated mass of the optimization result, before post-processing. These values are calculated by summing the density values in the system, and scaling to the as-built dimensions. This gives an area calculation (mm2), which is then multiplied by the 10 mm thickness and 2.5 g/cm3 density of the glass to calculate the mass. This figure highlights how the optimization results with more intermediate densities require more post-processing to produce manufacturable specimen.
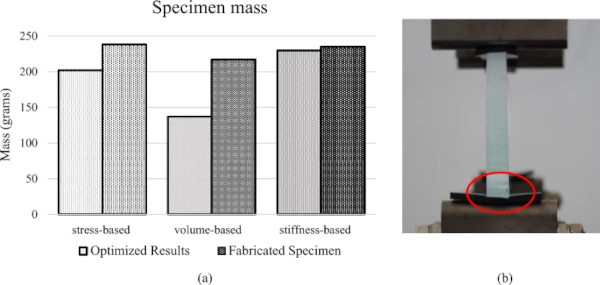
After cutting, it is observed that there is a slight taper in the cutting angle on all samples. This is because the waterjet machine is not able to achieve a perfect 90-degree cutting angle in the glass. Rather, the cut bows slightly, as visible in Fig. 17b. The fabrication method also leaves the cut surfaces rough, and specimens are not polished prior to testing. The unpolished surface can lead to failure at lower stresses than a polished surface because it leaves more preexisting imperfections in the glass. However, this is not considered detrimental for the experimental comparison of the three considered TO strategies because the effect would be equal in all samples during testing.
2.3 Testing
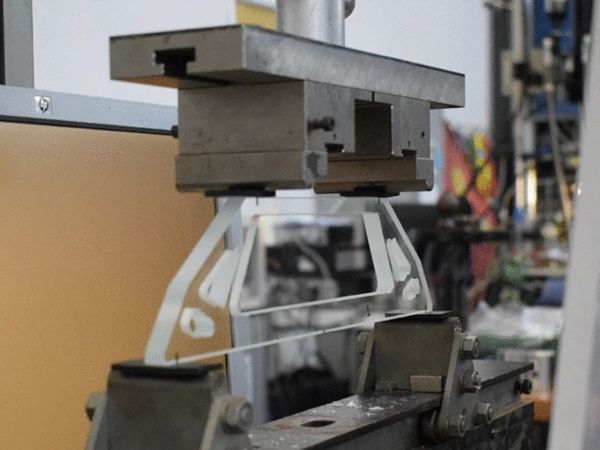
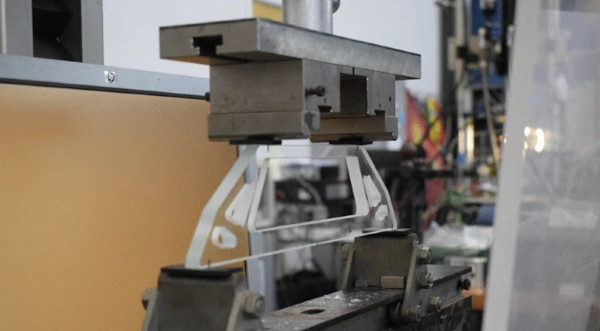
After fabrication, 5 specimen of each design were tested on a Zwick Z010 universal testing machine. A displacement-controlled loading was used, with 0.5 mm/min of displacement applied until failure. The loading conditions are identical to the 4-point bending load case used for the beam design in Fig. 2, with a 280 mm support span, and two loads applied 70 mm from mid-point of the beam. 3 mm thick neoprene pads are placed at all four points of contact to prevent direct interfaces of steel and glass. An example of an experimental sample in the testing apparatus is shown in Fig. 18.
Over the course of each test, the applied force was measured. Polarized films in crossed configuration are used to view the developing stresses within the structures during the test. Three of the five specimens of each design also had tape applied to the front and back of the glass to avoid shattering after failure, as shown in Fig. 20d. Taping prevents additional damage to the glass after failure that might be caused by falling or collision with the testing equipment. This allows break patterns in the glass to be studied for indications of how the glass failed during the test. The results of these tests are discussed in the following section.
3 Results and discussion
After testing 5 samples of each of the 3 designs, the maximum forces before failure are recorded and summarized in Fig. 19. Using the polarized filters, it was observed that, as expected, the specimens accumulate compressive stress within the top chord of the structure with tensile stress at the bottom. There is almost no coloration observed through the cross-polarization in the vertical members, suggesting they have relatively low stress at failure. This is unsurprising, as their thicknesses were controlled by manufacturing constraints, not internal stresses. The failure loads are consistent in all specimens of a given design.
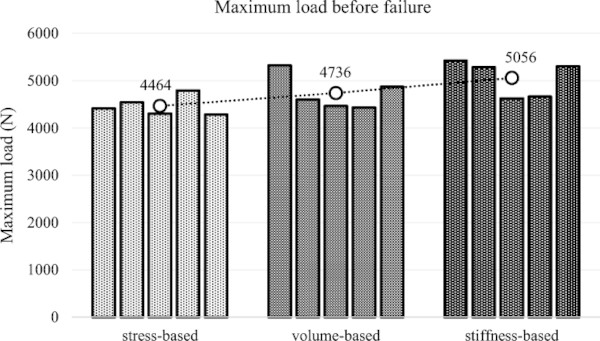
The data shows that the stress-based optimization was least successful in generating a high load capacity for the structure. Even though it has slightly more mass than the volume-based design, its average load capacity is about 5.7% lower. This is surprising, as the algorithm is meant to minimize the tension stresses, which cause early breakage in the structure. However, as discussed in Sect. 2.1.1, the optimization problem is highly nonlinear, and there was difficulty in producing practical geometries. It is also likely that using a strength capacity ratio of σc/σt=2 was too low to properly design a glass structure, and this also contributed to its relatively poor performance. Figure 20a uses cross-polarization to show stress concentrations at the locations where the tension chord is thinned. The concentrations are especially pronounced where the thinning occurs at the intersection of the compression chord. The beams failed consistently at these stress concentrations, showing how these step-backs in the tension chord resulted in a weakness in the design.
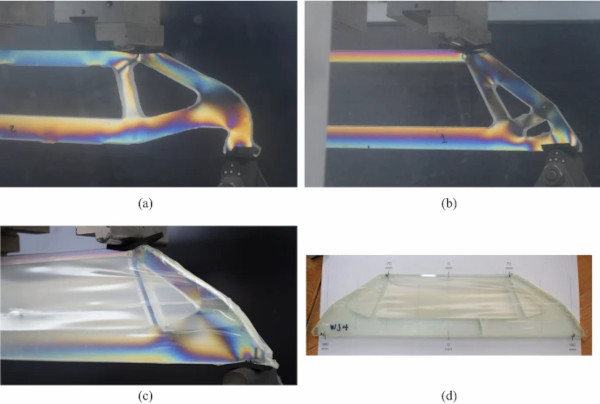
The stiffness-based design yields the most impressive test data, with an average maximum load capacity about 13.2% higher than the stress-based design with nearly identical material volume. Stiffness-based topology optimization is a very well-understood problem when using the compliance as the objective function, and it tends to be easier to solve than other approaches with more complexity. Previous work by the authors has also found that more complexity does not always lead to improved performance (Jewett and Carstensen 2019). The results of these experiments show the power and usefulness of stiffness-based TO, even for qualities aside from the stiffness of the structure. In the stiffness-based samples, failure always started from the bottom part of the bottom chord in maximum tensile zone, as anticipated. The location of the failing crack varied, but most often it was in very close proximity or under one of the diagonal members of the design.
The volume-based design performed better than the stress-based, and only 6.8% lower than the stiffness-based samples. This is especially impressive given than it has a lower volume of material, and is additionally held to the maximum length scale constraint, which the other designs are not. Therefore, these results are especially promising because the geometry takes annealing constraints into account, which may prove critical for cast glass structural performance in future work. Almost all specimens broke at the edge of the maximum tensile zone during testing. Failure originated close to either of the edges of the specimen. The failure load and crack origin location vary considerably more compared to the stress-based designs.
To highlight the difference in performance between the stress-based designs and the others, Fig. 20 shows the cross-polarization images of three samples just before failure. In the volume-based beam in Fig. 20b, the stresses are constant throughout the tension chord at the bottom of the beam, until the point where it intersects with the compression chord. This is also the case for the stiffness-based design in Fig. 20c. By contrast, the Stress-based design in Fig. 20a shows several stress spikes along the tension chord where the optimization had tried to remove material. These stress concentrations led to the early failures of the stress-based designs.
4 Conclusion
This research set out to investigate the potential of three TO methods for design of low-weight structural glass. The efficacy of the three TO algorithms are measured by physically testing beam specimen cut from float glass to find their maximum load capacities. One algorithm minimizes Drucker–Prager stresses, one minimizes volume with structural constraints including stiffness, stress, and size limitations, and the last minimizes compliance. It is found that the stiffness-based design is able to withstand the greatest loads before failure. However, the volume-based design performed similarly with less material mass, and may be a stronger candidate for future work in cast glass, as it accounts for annealing constraints. It is possible that the performance of the stress-based optimization could be improved through regional stress measures in future studies, and strength capacities σc and σt that more accurately reflect the behavior of glass. These experiments show the potential for materially-specific TO to be used to design effective and efficient glass structures.
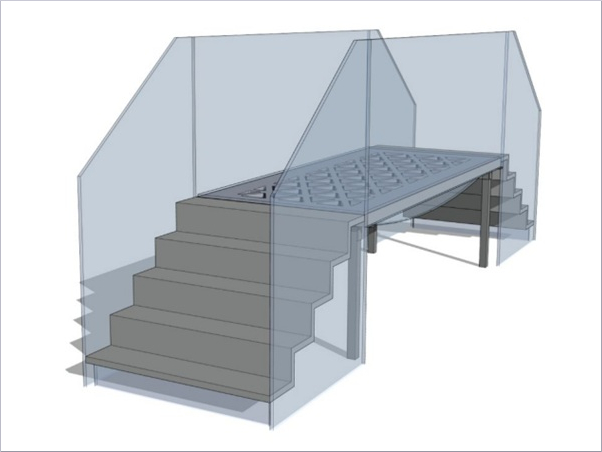
Future work involves using TO methods informed by these experiments to design and build structures made with cast glass. The use of cast glass will present new challenges, particularly in how molds can be economically made that capture the optimized geometry of the structure while withstanding the high temperatures necessary for casting. Additionally, new polishing methods may need to be explored that can remove defects along a curved glass surface without significantly warping the geometry. Last, this line of research may encounter challenges as the scale of structures in increased, because the size of ovens or other casting facilities may limit how large a single monolithic piece of glass can be made. However, addressing these potential challenges would be a worthwhile endeavor, as casting glass would allow for the use of 3D optimization methods that could design even more expressive and high-performing structures. Fabricating specimen using cast glass, rather than cutting float glass, would allow for these more complex geometries to be made, and help further the progress of the use of free-form and efficient structural glass in the built environment.


 demonstrator at Glass Technology Live during Glasstec 2024 (© Cas Maertens).")


Comments
Impressive work. It shows how thoughtful design can unlock so much potential in glass. Motorglass
I’ve always felt that the biggest hurdle for cast glass was the agonizingly slow cooling process, so seeing how these topology optimization algorithms can slash annealing times while actually making the structures more resilient is a game-changer for modern architecture.