Source: © 2024 Owens Corning. International Journal of Applied Glass Science published by American Ceramics Society and Wiley Periodicals LLC.
Author: Scott Colangelo
DOI: https://doi.org/10.1111/ijag.16674
Abstract
The glass industry is a significant source of greenhouse gas emissions due to its energy consumption profile and the use of fossil fuels in the manufacturing process. Most of the energy to produce glass is consumed in the process of treating raw materials to elevated temperatures, usually above 1500°C. Glass manufacturing also generates significant environmental impacts, such as greenhouse gas emissions, air pollution, water consumption, and waste generation. Therefore, improving the sustainability of glass manufacturing is a significant challenge for the industry and society. There are ways to reduce the energy consumption and emissions of glass melting, such as recycling glass, using oxy-fuel burners, improving furnace insulation and design, and adopting electric melting technologies. These methods can help save energy, lower costs, and enhance the sustainability and environmental footprint of the glass industry. However, the industry faces challenges and barriers, such as technical feasibility, economic viability, capital investment, and market acceptance.
More research and development must be invested to improve the energy efficiency and environmental performance of glass melting. The objective of this paper is to provide an overview of the growth glass industry has made over the past 30 years and the remaining challenges for sustainable glass manufacturing with a focus on the fiberglass segment. Sharing of procedural methods, technical approaches, and results can help enable the global glass industry in our future sustainability challenges. The fiberglass segment included a broad technical view including glass chemistry development, product development, new industry codes and standards, melting development, computational fluid dynamic modeling, life cycle assessments, and sustainability goals linked to capital planning. The net result delivered a significant reduction in environmental emissions at the global enterprise scale. The implemented changes have taken decades, significant investments, and resources to plan and develop. Practices reviewed and implemented can help drive collaboration and commonality within the glass industry to achieve sustainability goals. Action is needed now if the glass industry is to meet global government demands of reducing carbon emissions by 55% by 2030 and zero carbon emissions by 2050 in alignment with the Paris Agreement on decarbonization.
1 INTRODUCTION
The glass industry manufactures a diverse array of products, used in a variety of ways that are indispensable for modern living. Glass versatility comes from the material's unique properties such as transparency, durability, strength, thermal shock, electrical, thermal insulation, and infinite recyclability. The glass market is divided into four market segments: (1) container glass, (2) flat glass, (3) fiberglass, and (4) specialty glass. These four market segments drive a wide variety of businesses and industries ranging from packaging to construction to transportation and electronics. The global value of these segments is growing at over 4 to 5 percent annually with sales approaching $200 billion.1 Growth within the glass industry is positive, especially with increasing urban growth and developments in automotive, construction, transportation, renewable energy, defense, electronics, and packaging. Additionally, the rising awareness about the environmental benefits of glass, its recyclability, its ability to reduce carbon emissions, save energy consumption, and displace the use of plastic containers will boost market growth.
Although these are positive market trends, there are significant headwinds such as high energy consumption, glass manufacturing emissions, needed capital investments, volatility in raw material prices, and tighter environmental regulations. For example, in response to the European Union (EU) Paris agreement and the United Nations 2030 Sustainable Development Goals, the glass industry must drive technology developments and industrialize new innovations to address environmental impact. The agreement on decarbonization is a commitment by the EU to reduce greenhouse gas emissions by at least 55% by 2030 from 1990 baseline levels and sets Europe on the path to achieve climate neutrality with net zero greenhouse gas emissions by 2050.2 Additionally, the US, UK, and EU governmental organizations have all announced and committed to reduce all greenhouse gas emissions and to achieve net zero CO2 emissions by 2050.3-5
Historically, the glass industry has made significant progress in improving energy efficiency, reducing CO2 emissions, and lowering environmental impact. From year 1930 to 2010, specific energy consumption and energy-related CO2 emissions have decreased by at least four times with the elimination of coal and oil, higher natural gas use, and conversion to use of electrification.6 These data also indicate additional reductions since 1990 are occurring at a slower pace with smaller gains being made to 2010.6 The UK glass industry reports an energy efficiency increase of 50% over the past 40 years.7 Further recent reports from the US EPA8 and Europe9-11 highlights minor progress in CO2 emissions. For example, the European container industry, covering 219 furnaces, reported 5% less CO2 per ton of glass in 2015 compared with 2009.11
The UK glass industry notes over 80% of the fuel consumed by a glass manufacturing plant is natural gas, the majority of which is used in the furnace.7 In terms of energy efficiency improvements, the regenerative air/fuel furnaces used by most of the glass sector are approaching the limit of what is technically possible. As these furnaces age, they become less efficient by approximately 1% per year.7 Note, large-scale design step changes are limited as these types of furnaces are re-built every 10–20 years and is the appropriate time to plan and make improvements on design efficiency.7 The container and flat glass segments account for approximately 80% of global, European, and German annual glass production.6 Reports highlight limited conversions to oxy-fuel combustion which for these large furnace sizes can significantly increase operating costs, but reduce fuel consumption, emissions, and furnace capital costs.12
The US glass industry has made some transitions to decarbonize the industry with operating 28% oxy-fuel furnaces and 16% all-electric glass furnaces melting greater than one hundred tons per day.13 To lower CO2 emissions, the glass industry needs to further transition away from gas–air combustion and increase the use of container glass and window glass recycled cullet. Recycling and remelting of container and window glass is a way of reducing energy and reducing CO2 emissions as for every 10% recycled cullet usage in the melter saves 3% melting energy.12 Today, 26% of container glass is not recycled in Europe14 and over 67% of container glass in the US goes to landfill15, 16 missing significant life cycle value in reducing glass melting energy and decarbonization of the glass manufacturing process.
To meet the 2030 and 2050 decarbonization initiatives, the glass industry must develop and implement decarbonization strategies. Glass melter asset lives are planned over decades, and the development and industrialization of new technologies will push technology transitions out even further in time across hundreds of furnaces. Coordination of sustainable development must interlink business impact, capital costs, and operating costs on a regional as well as global scale. The development and implementation of decarbonization strategies must be profitability for the glass industry is a “commodity-like” business that is very dependent on capital investments and operational costs.14 Consideration needs to include life cycle assessments, product innovation, process innovation, product recycling, manufacturing efficiency as well as the given, of improving energy consumption and efficiency. This broader view adds complexity to our industry challenge of lowering the environmental footprint of glass manufacturing but can change the impact at global scale, significantly reduce CO2 emissions and achieve carbon neutrality.
The objective of this paper is to provide an overview the glass industry has made over the past 30 years, and thru sharing, help enable the global glass industry to meet the 2030 and 2050 decarbonization targets. As this paper is focused on the fiberglass segment of glass melting, faster results were accomplished by breaking away from the linear manufacturing model of extracting raw materials, making products, and disposing after use. Success in reducing the environmental footprint of the fiberglass segment was improved with a mindset shift considering re-design to eliminate use of materials and energy, consider renewable and recyclable inputs, energy-efficient production, product innovation, capital planning, and enable recycling at the end of life.17
2 BACKGROUND
2.1 Fiber glass melting overview
Fundamental raw materials used to produce most glass products include silica sand, alumina, clays, soda ash, limestone, dolomite, and other materials like borates, fluorine, chlorine, and refining agents added in smaller proportions depending upon product applications. Glass manufacturing involves melting the raw materials between 1400°C and 1600°C to react the ingredients to a glass melt state. With these elevated temperatures, glass manufacturing becomes a significant source of greenhouse gas emissions and energy consumption. Additionally, during these high-temperature melting reactions, components, such as sodium, potassium, boron, fluorine, and nitrate species will evaporate from the batch-glass melt and be carried into the combustion exhaust stream and increase particulate emissions.
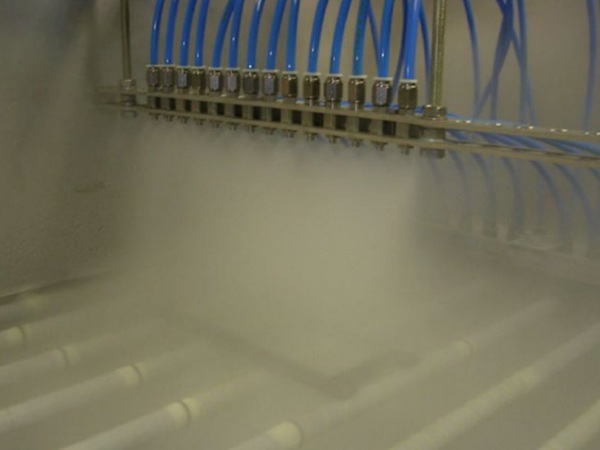
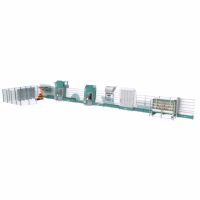
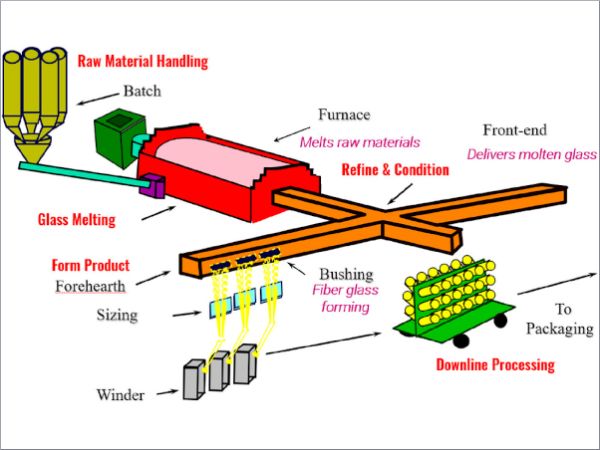
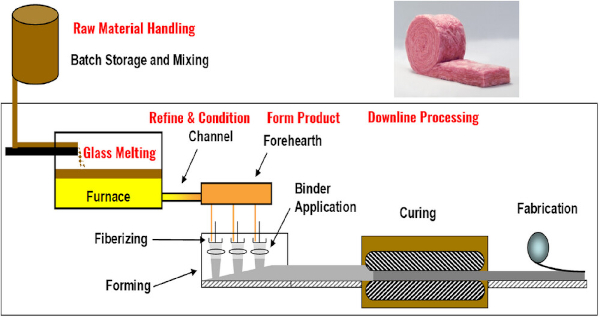
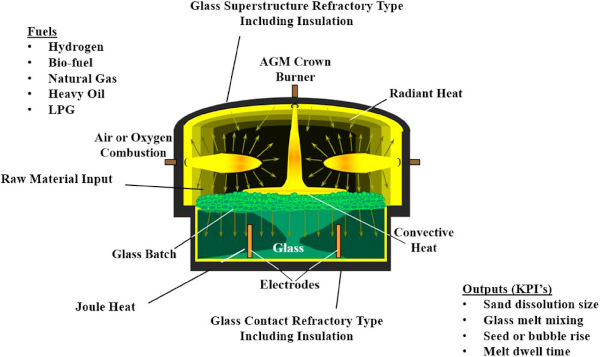
In terms of glass fiber manufacturing, which typically includes insulation wool glass fibers and reinforcement glass fibers (E-glass), the manufacturing process is defined by five (5) phases: (1) raw materials handling, (2) glass melting, (3) refining/conditioning, (4) fiberizing, and (5) downline (Figures 1 and 2). To date, 100% electrical melting has only been suitable for producing insulation wool fibers, but not for reinforcement glass due to its tighter product and process tolerances. Under the current state-of-the-art melting process, flames from the combustion of natural gas provide heat supplement along with electric boost to produce consistent and desirable reinforcement fiberglass.
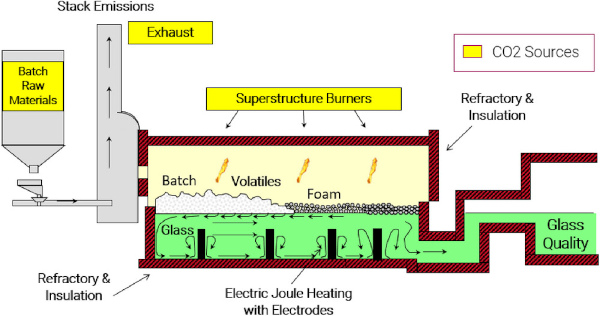
Glass melting requires high energy to heat these raw materials or mixed batch above 1500°C, to melt them and form glass. The energy for melting is primarily provided by natural gas combustion superstructure burners. The glass melting process contributes 70% to 80% of energy consumption versus the total manufacturing process from batch and raw material handling, to forming, and downline processing. To make a significant impact on energy efficiency, environmental emissions and reduction in CO2, technology solutions need designed around sources such as raw material choices, superstructure burner design, energy use and efficiency, volatiles from the batch/glass melt, and the amount of exhaust through the stack (Figure 3). Moreover, a portion of the heat loss is from energy through the furnace's refractory walls and insulation. There are ways to reduce the energy consumption and emissions of glass melting, such as recycling glass, using oxy-fuel burners, improving furnace insulation and design, adopting electric melting technologies, and use of alternative fuels. These methods can help save energy, lower costs, and enhance the sustainability of the glass industry. However, these methods also face challenges and barriers, such as technical feasibility, economic viability, and market acceptance. Therefore, more research and innovation are needed to improve the energy efficiency and environmental performance of glass melting.
2.2 Environmental regulation overview
Trends on environmental emission regulations are influenced by scientific research, public awareness, political will, and economic interests. These trends and impact on innovation and technology are closely related as technology can both contribute to and mitigate environmental problems. The following is a summary of significant environmental regulations. Stricter regulations have reduced emissions from particulate matter, hazardous air pollution, and depletion of ozone. As these regulations have made a better environment, these listed below will continue to drive change and innovation within the glass industry.
- The US EPA was created in the 1970s and passed several environmental laws such as the clean air act which established national standards and regulations on emissions, pollutants, and hazardous waste.18
- In 1973, the European Union (EU) Environmental Policy was initiated with the “Environmental Action Programme” to provide standardization across Europe.
- In 1990, the US EPA revised and amended the 1970's Clean Air Act to address urban smog, acid rain, toxic air emissions, and ozone depletion with driving industry to achieve Maximum Achievable Control Technology and in areas of concern drive for Best Available Control Technology.19
- By 1996, US individual states that are in nonattainment areas of revised Clean Air Act noted above were mandated to meet 15% baseline reductions.
- In 2004 and 2008, the EU adopted the Ambient Air Quality Directives (2008/50/EC and 2004/107/EC), which set limit values and target values for several air pollutants, such as, particulate matter (PM), nitrogen dioxide (NO2), ozone (O3), sulfur dioxide (SO2), lead (Pb), carbon monoxide (CO), benzene (C6H6), arsenic (As), cadmium (Cd), nickel (Ni), and mercury (Hg).
- In 2015, the US EPA National Emissions Standards for Hazardous Air Pollutants for Mineral Wool Production and Wool Fiberglass Manufacturing established pollutant-specific emissions limits for hazardous air pollutants.
- In 2015, the EU adopted The Paris Agreement which is a legally binding international treaty on climate change that aims to limit the global average temperature rise to well below 2°C above pre-industrial levels, and to pursue efforts to limit it to 1.5°C.20
- In 2016, the EU adopted, the National Emission Ceilings Directive (2016/2284/EU), which sets national emission reduction commitments for five main air pollutants: SO2, NOx, nonmethane volatile organic compounds, ammonia (NH3), and fine particulate matter (PM2.5).
- In October 2022, as part of the European Green Deal, the Commission proposed to revise the Ambient Air Quality Directives. Significant updates and changes can further become law to achieve zero pollution for air by year 2050.
2.3 Manufacturing environmental footprint
A company's manufacturing environmental footprint is a measure of the impact that people and organizations have on the environment. An environmental footprint can also communicate the environmental performance of organizations and products. This can help consumers make informed choices and decisions about the impact the manufacturer has upon the environment. The environmental footprint of a product can be measured by its carbon footprint, or the total amount of carbon used and consumed to manufacture the product. The Manufacturing environmental footprint is a measure of the environmental impact of manufacturing processes, from the extraction of raw materials to the disposal of the final product. Data can include emissions of particulate matter, and greenhouse gases, such as, carbon dioxide (CO2), VOCs, SOx, and NOx that contribute to global climate impact.
Driving corporate sustainability initiatives and lowering the company's environmental footprint can also be driven by life cycle assessments (LCA). An LCA is a comprehensive assessment of the manufactured products’ environmental impact throughout a product's entire life cycle, from raw material extraction to end-of-life disposal. LCA's considers multiple impact categories beyond just greenhouse gases. These additional categories may include land use, water use, landfill, and all in manufacturing costs over life. An LCA aims to understand the overall environmental impact of a product or service, can identify areas for improvement and provide a view to cost justify significant design changes and longer-term capital investments.
Understanding of manufacturing environmental footprints and product life cycle assessments is not only important for changing the environment, but also can bring economic and social benefits.21 By reducing the environmental footprint and leveraging LCA's, manufacturing can improve costs, reduce energy consumption, limit waste, improve brand image, attract new customers, and create new markets.21 Examples or focus of reducing sustainable manufacturing footprint for the glass industry are summarized as follows6:
- Alternative sources of energy to reduce the net CO2 footprint,
- Reducing energy consumption or improving energy efficiency,
- Alternative materials to lower sustainability footprint,
- Applying science and fundamentals to eliminate use,
- Redesign of glass manufacturing processes,
- Recycling and circular economy.
Sustainability requires a long-range vision and a continuous mind-set on conceptualizing, innovating, developing, and industrializing new manufacturing processes. Business goals are often short term and businesses often have annual, quarterly, and monthly targets that guide decision-making. For sustainability, companies need to look farther ahead to at least ten to twenty years. The global challenges are significant, and it can be difficult to imagine how the glass industry can get from current state to the future state especially with long asset lives. The glass industry must keep the long-term vision in mind, and everything we do in the short-term has to be a step toward those long-term goals. This includes research, development, industrialization and commercialization across continents, countries, facilities, and glass manufacturing furnaces.
The following will provide more details on the areas of focus which have made progress on sustainability initiatives and reduced the environmental footprint of glass manufacturing.6, 22, 23
- Environmental regulations: As noted in the environmental regulation overview (Section 2.2), implementation of environmental regulations and emission standards have played a role in reducing pollution from glass manufacturing. Governments and regulatory bodies have imposed stricter limits on emissions of pollutants such as particulate matter, sulfur dioxide, nitrogen oxides, and volatile organic compounds. Compliance with these regulations has compelled glass manufacturers to adopt emission treatment technologies as well as develop and innovate new melting designs and practices.
- Flue gas treatment: Flue gas treatment systems have been implemented to reduce the emissions of pollutants generated during glass melting. These systems typically include technologies such as electrostatic precipitators, baghouses, or fabric filters to capture particulate matter. Additionally, various scrubbing techniques, such as wet scrubbers or dry scrubbers, can be employed to remove SO2 and other acidic gases from the flue gas. Flue gas treatment is an effective solution but adds capital and operating costs to the glass industry.
- Batch material optimization: By optimizing the composition, finding alternative materials, leveraging the benefits of recycled glass, and improving the quality of batch materials, manufacturers can reduce pollutants emitted during the melting process. This optimization and design substitution help minimize the formation of impurities that can lead to emissions of particulate matter and hazardous gases such as fluorine, SO2, NOx, and CO2.
- Energy substitution: Historically, glass melting furnaces primarily used fossil fuels such as coal, oil, and natural gas as the energy source. However, the introduction of cleaner-burning fuels, burner development and conversion from air/gas to oxygen/gas combustion has significantly reduced emissions of SO2 and NOx. Additionally, utilizing electricity as energy versus natural gas helps to improve melting efficiency through joule heating in the glass versus radiant heating above the batch and glass bath and further lowers CO2 and NOx. Energy substitution with conversion to oxygen/gas combustion, as well as higher electrification use, have been effective methods to lower pollution in the glass industry.
- Energy efficiency improvements: Enhancing energy efficiency in glass manufacturing processes indirectly helps reduce pollution. By improving insulation, using heat recovery systems, optimizing energy balance with mass and flow balance, and redesigning burners, manufacturers can minimize heat loss, optimize energy efficiency, and increase net melted tons from the same melter footprint. This reduces overall energy consumption per ton of melted glass and the emissions associated with energy as CO2 and NOx.
- Melting process modification: Modifying or redefining the glass chemistry along with redesigning the glass manufacturing process can contribute to significant pollution reduction. For instance, advancements in furnace design, combustion burners, operation techniques, oxy-fuel furnaces, and electric melting technology have improved energy efficiency and reduced emissions. These modifications optimize combustion conditions, enhance heat transfer, improve energy efficiency, reduce the formation of pollutants, and reduce the dependence of costly pollution abatement equipment.
It is important to note that the effectiveness of pollution reduction methods varies depending on the glass manufacturing process, furnace type, and regional regulations. Also, cost effectiveness of these solutions may vary by geographic location.
3 PROCEDURE AND TECHNICAL APPROACH
3.1 Glass chemistry and standards change
E-glass was developed in the mid 1930's by Owens Corning based on a eutectic composition in the CaO-Al2O3-SiO2 system. The glass composition contained low alkali (Na2O and K2O) which resulted in low electrical conductivity. This makes the glass composition an excellent candidate for electrical applications and yielded the name E-Glass. The E-glass composition became defined by Military specification Mil-R-60346 by the US Military in the early 1970's.
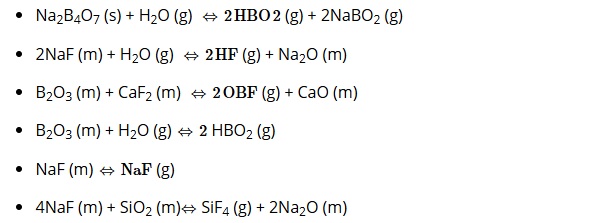
In 1998, glass fiber manufacturers and their customers met to discuss ASTM D578, which is a specification covering the requirements for continuous fiber and staple fiber glass strand. The fiberglass industry agreed that the definition of oxide ranges should include zero boron compositions. However, the suitability of zero boron compositions was restricted to general applications and prohibited from electrical yarns and aerospace applications. In 1998, ASTM included these oxide ranges in specification D578, and in 1999, ASTM listed Advantex as an E-glass. The elimination of boron and fluorine in E-glass enabled step-change advancements in combustion designs and burner locations, making conversion from air/gas to oxygen/gas combustion low risk. It is well known that water vapor will increase with gas/oxygen firing and increases emissions with the formation of the following gases and particulate species24-27:
Gas species examples
Particulate examples
- Sodium-borate particulate matter (NaBO2 and Na2B4O7)
- Potassium-borate particulate matter (KBO2 and K2B4O7)
- Sodium and potassium sulfate particulate matter
As seen above, air emissions from the traditional E-glass compositions are particulates and gases resulting from the volatilization of boron and fluorides from the glass melt. By eliminating added boron and fluorides from the Advantex glass composition, particulate emissions and fluoride emissions significantly decrease. The added boron and fluorides were traditionally used as melting and forming aids, meaning step change reduction was limited by process science and fundamentals. Rethinking and redesigning the melting and forming process opened the door for a new glass composition, Advantex. The new glass was patented in 1998 and later became accepted as a more environmentally sustainable standard for E-glass with zero added fluorine or boron. Advantex is a notable example of incorporating a short-term view and a long-term vision for innovation. This glass composition significantly changed the manufacturing of fiberglass and eliminated sources of particulate emissions from the glass melting process. The elimination of boron and fluorine can significantly reduce and or eliminate costly capital and operating expenses with environmental control systems or efficient wet scrubbing systems.28 Boron and fluorine can also come from deep underground mining operations and limited global deposits. Boron deposits for example are primarily mined in Turkey and the US and fluorspar is primarily mined in China, Mexico, and Mongolia. With boron and fluorine having long global supply chains, elimination of use also helps lower manufacturing costs as well as indirect scope 2 CO2 emissions.
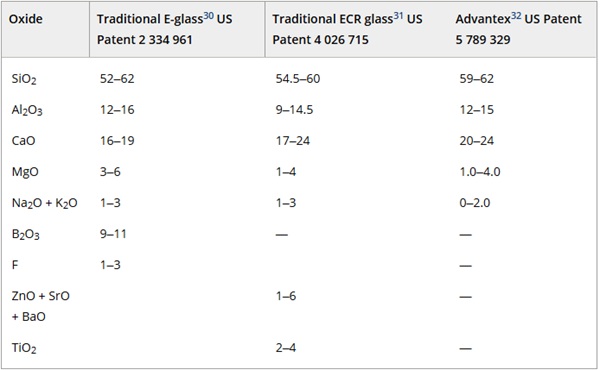
Table 1 shows a comparison of the traditional E-glass, traditional ECR glass and developed Advantex glass. Advantex was approved as a reinforcement E-glass as well as a true E-CR glass according to ASTM D 578, ISO 2078, and DIN1259-1 with the product providing improved corrosion resistance as well as environmentally friendly compared with standard E-glass.29 With the removal of added boron and fluorine, environmental emissions were reduced as they are highly volatile in the melting process and add to emissions exiting the combustion exhaust stream.
TABLE 1. Oxide weight percent comparison of traditional E-glass versus Advantex.
The new glass composition allowed furnace designers to rethink melter design and operations with oxygen/fuel combustion, providing further environmental footprint reductions. As combustion air is composed of 78% nitrogen, the substitution of oxygen eliminates the portion of NOx converted from the combustion air. Reductions in NOx can be as high as 90%12 with oxygen/fuel combustion as the rate of NOx formation is dependent upon temperature, nitrogen concentration from air, and burner design.
Also, CO2 gas is produced during the combustion of natural gas. Oxygen/fuel combustion can provide up to 50% reduction in CO2 emissions12 compared with air/fuel combustion systems thru improved energy efficiency, enabling furnace design changes and addition of insulation reducing heat losses. Additionally, there can be a reduction in gaseous fuel consumption as most of the heat input to the glass bath in a furnace occurs through radiation from the combustion flame. Since radiative heat transfer is significantly temperature-dependent, the hotter oxygen/gas flame increases the heat transfer efficiency. There are also benefits in combustion efficiency due to absence of nitrogen gas associated with conventional air/fuel combustion technology. Reports have shown 10% to 50% energy savings converting to oxygen/gas combustion dependent upon furnace design and size.12 The reduce energy savings and efficiency improvement therefore results in a net CO2 reduction.
As previously stated, Advantex glass reduces particulate emissions that originate from volatilization from the surface of the glass melt. Batch carry over is another mechanism that generates emissions. Prior to melting, powdered batch materials lay on the surface of the molten glass bath. A small fraction of these materials entrains in the exhaust gases of a glass furnace and are discharged as particulate in the exhaust stream. With oxygen/fuel combustion designs, the volume of exhaust gas is significantly less due to the lack of nitrogen in the furnace atmosphere, which leads to reduction in particulate emissions. A well-known example is decrepitation of dolomite, which leads to particulate emissions of MgO and CaO. The evolved CO2 from the decomposition of dolomite (or even limestone) escapes from open-pore structured grains, but in the case of dense grains with crystal defects, this CO2 can build up high pressure inside the grains above the carbonate decomposition temperatures. These grains will burst, and small fragments are picked up and carried away by the combustion gases.33, 34 Additionally, other ingredients such as fine grind sand, clays, or even fine ground cullet may be entrained in the combustion gas stream at high gas velocities highlighting the benefit of designing out volatile raw material ingredients and converting to oxygen/gas combustion.
The fundamental science and understanding of reactions allow glass technologists and melting design engineers to focus long-term and develop new glass compositions, new melting designs, and manufacturing processes by addressing the sources of emissions from glass furnaces. Another example is melt segregation. Melt segregation is the process of separating the molten phase from the solid phase in a heterogeneous mixture, such as the batch ingredients for glass manufacturing. Melt segregation occurs when the melting points of the various components are different, or when the viscosity of the molten phase is too fluid to hold the solid particles together. Melt segregation affects the quality and efficiency of glass melting by creating bubbles, streaks, or distortions in the glass, or by increasing the energy consumption and or lowering the residence time in the melter. Elimination of melt segregation allowed further optimization of energy consumption and improve specific energy use. Driving and optimizing glass melting with knowledge, science and new fundamental learnings can be powerful and key to any company wanting to improve melting capabilities as well as reducing the environmental footprint of glass manufacturing.
3.2 Modeling of various melting designs to drive melting efficiency
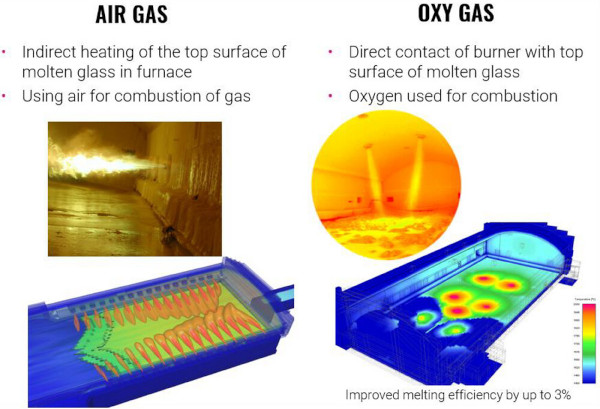
Computational fluid dynamic modeling (CFD) is a powerful technique to drive learnings by simulating the complex phenomena involved in glass melting, such as, fluid flow, heat transfer, electric field, and chemical reactions. CFD is built on principles of fluid mechanics and heat transfer and solves problems utilizing numerical methods and algorithms around fluid flow. It is an excellent tool for designers to improve energy efficiency, melter designs, glass quality, and melting capacity. The set of equations and methodologies used are described in the Encyclopedia of Glass Processes.35 Such advanced modeling techniques allow for virtual prototyping for furnace design and operations. An example is superstructure burner design as well as placement and quantity of burners for optimal heat transfer. Figure 4 shows a conventional melter design with side-fired air-gas burners primarily providing radiant heat to the glass batch. Next to this shows a redesigned melter with oxy-gas crown burners providing additional convective heat thanks to the impingement of the flame on the batch and glass surface. This results in improved melting efficiency by 2 to 3 percentage points and saves gas consumption by 40%.36 Simulations helped quantify those benefits and were thus part of the decision-making process to build optimized sustainable glass melting designs.
More detail on modeling results is summarized in Figure 5. CFD enabled modeling of the superstructure combustion space with conduction, convection and radiation heat fluxes and knowing energy input and melter design the energy transfer or efficiency to the glass can be calculated. Additionally, for the glass melt area, CFD enabled optimization of electric joule heating, batch line control, glass velocities and flows, residence time in the melter, prevention of short-circuiting flows, and glass quality.37
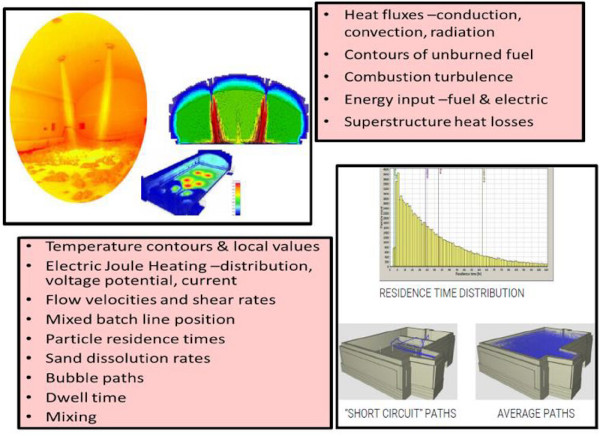
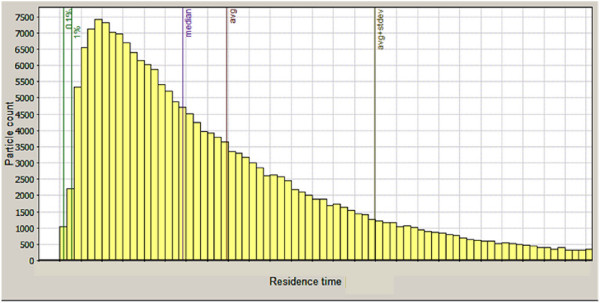
CFD modeling allowed the tracking of raw material particles and gas bubbles of specified density and size. Pathways of the particles and bubbles were calculated overtime from the computed velocity vectors. When a particle enters and exits defined planes within the model, residence times can be calculated. A representative histogram is seen in Figure 6 and the primary interest for glass quality can be focused on the least amount of thermal history and residence time. Figure 6 notes important points in time for the .1%, 1.0%, and median residence times and these points were compared against other melting operating conditions for design and or energy efficiency.
CFD also helped to optimize the design for reducing the environmental footprint. Figure 7 highlights the various input and design variables that can be modeled to provide insights and learnings for reducing energy consumption, particulate carryover, NOX, SOX, and CO2. Different melter designs, shapes, sizes, fossil fuel use, air or oxygen combustion, burner size, burner location, flame shape, electrode location and quantities can be simulated. CFD models can be quantitatively compared versus critical melting output key process indices such as sand dissolution size, glass melt mixing index, seed, or bubble rise, and melt dwell time in the designed system.
Examples of CFD applications for glass melting improvements are as follows:
- Simulate the behavior of the molten glass, including its electric potential, temperature, and velocity, and provide insights into the effects of various operating parameters on melting performance and decarbonization.
- Investigate the effects of different flame shapes and lengths on the convective flow movements within the molten glass bath and identify the optimal heat flux profile for achieving a uniform temperature distribution and meet high-quality product requirements.
- Cost optimization of the whole manufacturing process from raw materials, glass chemistry, and batch melting in the furnace to the delivery of the glass for forming product.
- Environmental optimization of the melting design and process from raw materials, electric heating, bubbling, combustion, turbulence, and glass viscosity.
A few examples will be discussed further and can be seen in Figures 8 and 9.
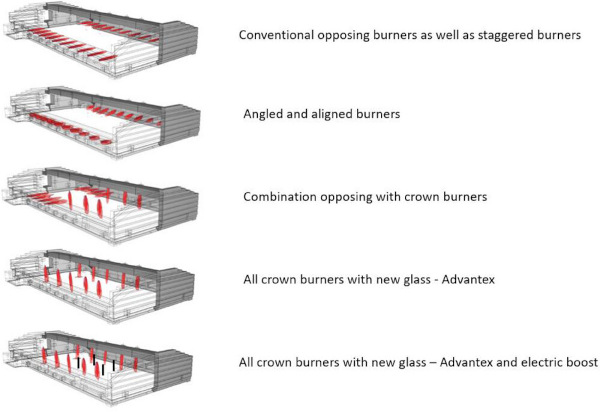
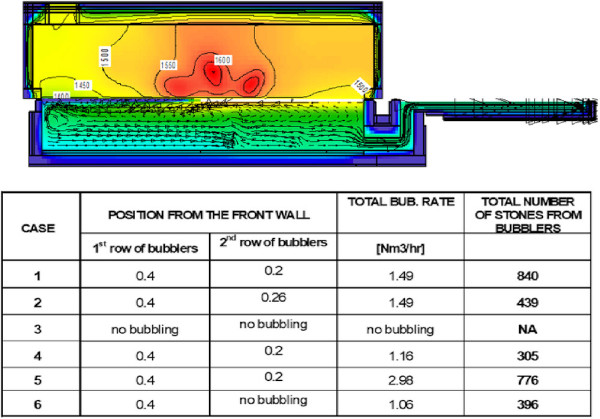
Figure 8 shows examples of various changes to melter burner locations evaluating melt energy efficiency. Then, changed to an optimized new glass composition Advantex and as well as adding joule heating electric boost. The outputs of the modeling scenarios compared maximum sand dissolution size, glass melt mixing index, seed, or bubble rise, and melt dwell time for the new designed systems. By changing raw material input, glass chemistry, burner locations, electrode locations for electric boost and melter design, a more energy efficient and reduced environmental footprint was defined for the fiberglass industry thru CFD modeling.
Figure 9 is an example were glass quality being delivered to the forming process was being impacted by unmelted raw material particles or sand quartz grains. CFD modeling was utilized for various conditions investigating the impact of quartz grains exiting the melter versus bubbling rate and location, throughput, and batch charging. Forward and backward tracking of glass vectors were used to relate stoning in the front end to the melter operation parameters.
Both the location and intensity of bubbling had strong influence on the number of stones trapped by bubblers as well as on other parameters of interest (e.g., surface and underglass temperature, mixing). Integration of melting and delivery ends can be a powerful means of optimizing furnace operations and delivering a more efficient melting process.38
3.3 Life cycle assessments and capital planning
To achieve commitment to sustainability, a series of initiatives to complement its environmental footprint reduction initiatives were implemented. LCA involved breaking down the activities contained in the production and usage of each product and identified the impact of each activity on the environment. The key was to break away from the dominant linear manufacturing thought process of extract raw materials from the earth, manufacture products, and send to landfill when they were no longer needed. Leadership and engineers moved to a circular mind set to guide discussions and redesign manufacturing processes around a focus and view on virgin raw materials, pre-processing, transportation, energy, emissions, and waste. New assessments included thought processes and discussions to minimize use and waste, incorporate renewable/recyclable inputs, improve production energy efficiency, and enable recycling at the end of product's life cycles.
Additionally, sustainability goals were treated similarly to any other business goal. Capital expenditure, operational priorities, and R&D resources would flow toward those projects that had the ability to meet or exceed “all-in” business goals, that is, goals that included not only financial but also sustainability metrics. Initially, senior management would sit in on budgeting meetings with each division, to ensure that sustainability goals received the same attention as other goals. Over time, divisional managers and plant leadership developed the capability to independently manage sustainability goals, without needing senior level guidance. A new culture was set to evaluate sustainability initiatives no differently from any other capital project.
3.4 Technical summary
These are just a few examples on methods used for a more sustainable glass melting process. Redesigning of the process included significant changes to glass chemistry, leveraging CFD modeling for process design changes, and leverage LCA evaluations for driving capital planning. There were many approaches to make the glass melting process more energy efficient and more environmentally friendly and some of these are summarized as follows:
- Reduce volatile evaporation from the melting batch blanket.
- Reduce carry-over of (fine) batch particles from the batch blanket.
- Reduce evaporation of volatile glass components from the surface of the glass melt.
- Improve energy efficiency through alternative fuels, higher electrification use, heat recovery and preheating of batch, combustion air, oxygen, and fuels.
- Reduce use of carbonates (CO2 source) such as dolomite, limestone, and soda ash.
- Design new combustion processes, which often are the major cause of NOX formation.
- Design new glass compositions eliminating use of raw materials and refining agents.
- Remelting of recycled glass products to replace materials above and reduce energy.
- CFD modeling to innovate new designs for thruput, efficiencies, and reducing waste.
- Leverage LCA evaluations and make sustainability initiatives a part of capital planning.
4 ENVIRONMENTAL RESULTS
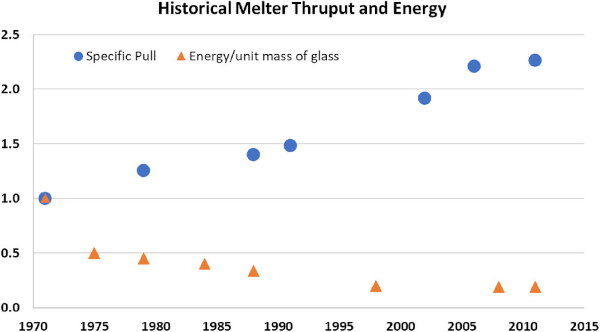
CFD has been used in Owens Corning for over 40 years and has been important in providing science, fundamentals, and insights to improving melting capabilities and reducing the environment footprint. Figure 10 highlights the results and improvements made in Composites fiberglass melters from 1971 to 2011 for energy consumption and furnace pull. CFD modeling was key in understanding interactions between glass flow, heat transfer, and chemical reactions in the glass melting furnace, and provided insights into the effects of different operating conditions and design parameters on glass melting performance. New design standards and operating parameters drove continuous improvement and new design entitlements over time. The leverage of science with new fundamental learning's and collaboration of design expertise with CFD modeling experts was powerful in driving the fiberglass industry to new and more sustainable glass melting designs.
The outlined technical summary in Section 3 provided long-term benefits on a global scale when standardized and scaled across multiple melting assets. The bar graphs in Figure 11 show Owens Corning's historical impact of reducing the environmental footprint in energy use, NOx, CO2, green-house gases (GHG), and VOC's while the Corporation has significantly grown from annual sales less than $3 billion to almost $10 billion. Owens Corning recognizes the potential impact of our operations, including from emissions that are released into the air. We understand that we have a responsibility to effectively manage these emissions as part of our commitment to reducing our environmental footprint and building a better future. We stand by our commitment to air quality because we realize this is an issue that impacts life outside our facilities. Improving air quality is part of our larger focus on mitigating our impact in the areas where we serve, and beyond, which is shown in the graph in Figure 11.
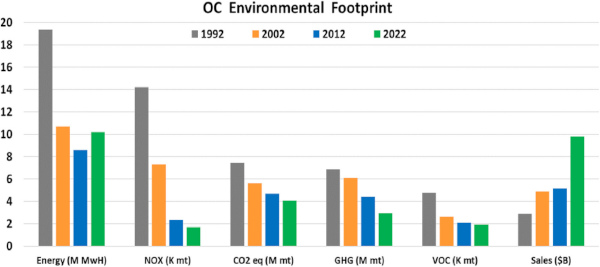
From 1992 to 2022, our net Corporate energy usage went down 47%, NOx emissions by 88%, CO2 equivalents by 45%, GHG by 60%, while Corporate sales increased by 240%. Note, the CO2 equivalent values below are Scope 1 and Scope 2 emissions. According to the US EPA, Scope 1 emissions are direct emissions from owned or controlled company facilities and manufacturing sources, and Scope 2 emissions are indirect emissions related to purchased energy emissions.39
5 CONCLUSION AND SUMMARY
The significant reductions reported on environmental results above occurred globally over a 30-year period and relied heavily on new science and fundamental learnings, the guidance of modeling, leverage of LCA's, and appropriate capital planning. The net corporate reduction in CO2 equivalents was a 45% reduction over this period with the need to make significant process changes.
If the glass industry is to make significant progress to zero carbon emissions, action is needed now. The glass industry faces three main challenges to lower GHGs and reach zero carbon manufacturing. The first is developing, planning, and implementing technology roadmaps to meet the decarbonization targets driven by the Paris Agreement and other government-and company-set climate zero carbon targets. Second, the required changes will put pressure on capital and operating costs as well which could affect profitability requiring significant investments and or incentives from governmental agencies. Finally, with consumers demanding rapid changes to more sustainable products, this traditionally conservative industry must significantly accelerate development and implementation.
To address these challenges, the glass industry must adopt more sustainable practices, provide appropriate long-term views and planning, provide capital funding, and resources to develop new solutions to reduce the environmental footprint. Various studies and reports have been issued in the US, UK, and Germany attempting to prioritize decarbonization solutions for the glass industry. A study completed in 2023 by the National Renewable Energy Laboratory of the U.S. Department of Energy reported that over 80% reduction in energy demand and greenhouse gas emissions can be achieved in the glass industry by applying a combination of increased cullet use, energy efficiency or reduction, increased electrification, hydrogen combustion, and a more renewable electric grid.40 The following summary of solutions are based on technology readiness in which have shown carbon reductions in relevant environments but does not include concepts and solutions that need significant development such as carbon capture for glass melting41:
- Increase the collection, processing, and use of recycled glass (cullet) in the glass melting production process, which can lower the energy demand and the need for virgin raw materials. According to the Glass Packaging Institute, using 10% more cullet in glass manufacturing can save 2–3% of energy and reduce CO2 emissions by 4–10%.42 According to the US Environmental Protection Agency, only 31 percent of all glass containers are historically recycled. This represents about 3.1 million tons of recycled glass and their data indicates 7.6 million tons of glass end up in landfills.43 In addition, many US municipalities have removed glass from their curbside recycling programs, further threatening cullet supply. This is concerning because the benefits and use cases for recycled glass are vast and well understood in terms of circular economy, energy savings, reduced manufacturing emissions, as well as how product applications of glass ensure a more sustainable and greener planet.44 Europe is the leading model for recycling glass and has vast availability of data with latest average collection of glass packaging containers and jars recycled was 80% in 2021 across the EU 27 countries.45 The EU 27 countries are collaborating and working together to achieve a 90% glass packaging collection for recycling rate in the EU by 2030 so more recycled content can be used in the production loop of glass manufacturing.46
- Continue improving the energy efficiency of glass furnaces with cost-effective waste heat recovery especially for gas/oxy melters, reliable cost-effective mixed batch and or cullet preheat systems, and installing smart technology model-based control systems for stability and manufacturing efficiency.6 A publication from British Glass, identifying decarbonization technologies, notes over 90% of the glass furnaces in the UK fire on air and natural gas utilize regenerators for heat recovery to preheat combustion air and still have 33% of the energy input exiting as waste heat.47 Capturing this energy and installing batch and cullet preheating systems have saved specific energy up to 20% and pull rate increases up to 10%.6 Thermochemical heat recovery which preheats fuel gas from the exhaust stream flue gas can save up to 29% energy on an oxy-fuel furnace.40
- Higher electrification melting which includes hybrid melting technology combining electric boosting with combustion burners, and or 100% electric melting technology. Assuming renewable electricity is used, both technologies will offset natural gas use, result in reduced specific energy consumption, and significantly reduce green-house gas emissions including CO2, NOx and SO2. Electrification is the most efficient method to melt glass through joule heating and to achieve significant emissions reductions.48 It has been estimated for melting three hundred tons per day of container glass, an electric melter is 85% thermal efficient versus an end-fired regenerative furnace.6
- Integrate renewable energy strategies such as hydroelectric, solar and wind to offset manufacturing power use of glass manufacturing facilities. In the United States, several regions have met more than half of their load with renewables for multi-hour periods.49 A great example is a glass facility recently installing solar panels on warehouse roofs generating significant mega-Watts of power.50
- Develop low-cost and low-carbon systems for oxygen/hydrogen combustion systems. There are various projects and production glass trials investigating hydrogen as a fuel for the glass industry since hydrogen as a renewable fuel can not only have the highest reduction on reducing CO2 emissions but can significantly increase operating costs.6
Addressing these technical challenges requires ongoing research, development, and innovation as well as industry and government collaboration. By developing and adopting these solutions, the glass industry will reduce its environmental footprint and enhance its economic competitiveness and social responsibility. As a key material for multiple industrial and consumer sectors, as well as new applications and markets, glass has exciting potential to contribute to a more sustainable and low-carbon future for the world.
ACKNOWLEDGEMENTS
The author thanks Dr. Manoj Choudhary (retired from Owens Corning) for his career contributions to Owens Corning's CFD modeling foundational abilities linking CFD with glass technology and to Dr. Bruno Purnode for improving Owens Corning's CFD modeling capabilities and establishing an enterprise modeling and simulation laboratory as part of Melting Science & Technology organization. The author thanks members of Owens Corning's Corporate Sustainability and specifically to Cheryl Smith, Peter Canepa, and Julie Childers on data analysis, as well as Frank O'Brien-Bernini and Dave Rabuano for their leadership. Additionally, the author acknowledges and sends a sincere thank you to many members that made this a reality over the past thirty years and includes all our glass melting operations and personnel, corporate supply chain, corporate sourcing, environmental and regulatory, furnace designers, furnace operators, CFD modelers, glass/raw material scientists, and forming and downline expertise. A sincere thank you to two Owens Corning retirees for their long-term visions in glass melting; Jack Wingert and Bill Fausey. Lastly, the author thanks Owens Corning management for their support to publish this paper. My career of over 34 years with Owens Corning has been fun, exciting, and impactful delivering a more sustainable future for the glass industry.
REFERENCES
-
1 The global glass economy and its wider social consequences. International Year of Glass 2022 IYOG2022 Publication (May 18, 2021).
-
2 Communication from the Commission to the European Parliament, The European Council on the European economic and social committee and the committee of the regions. Brussels: The European Green Deal. December 11, 2019. COM (2019) 640 final.
-
3 Tackling the climate crisis at home and abroad: A presidential document by the Executive Office of the President. Federal Register, 27 Jan. 2021. www.federalregister.gov/documents/2021/02/01/2021-02177/tackling-the-climate-crisis-at-homeand-abroad
-
4 Glass sector net zero strategy 2050. British Glass Manufacturers’ Confederation. Accessed March 04, 2023. https://www.britglass.org.uk/knowledge-base/resources-and-publications/glass-sector-net-zero-strategy-2050
-
5 Regulation (EU) 2021/1119 of the European Parliament and of the council of 30 June 2021 establishing the framework for achieving climate neutrality and amending Regulations (EC) No 401/2009 and (EU) 2018/1999 (‘European Climate Law’). https://climate.ec.europa.eu/eu-action/european-climate-law_en
-
6Zier M, Stenzel P, Kotzur L, Stolten D. A review of decarbonization options for the glass industry, Energy Convers. Manag.: X. 2021. 10, 100083. https://www.doi.org/10.1016/j.ecmx.2021.100083
-
7 Glass Sector Net Zero Strategy 2050, British Glass Publication. https://www.britglass.org.uk/knowledge-base/resources-and-publications/glass-sector-net-zero-strategy-2050
-
8 US EPA Inventory of Greenhouse Gas Emissions and Sinks 1990–2020.
-
9The material transparency: An environmental analysis of the architectural flat glass industry since 1945 in Europe, France, and Belgium. Resour Conserv Recycl, 174, 105779, 2021.
-
10 2050 Flat glass in climate neutral Europe, published in 2020. https://glassforeurope.com/wp-content/uploads/2020/01/flat-glass-climate-neutral-europe.pdf
-
11 European Glass Container Industry Case Study, FEVES, Brussels, 13 February 2017. https://www.feve.org/case_study/european-glass-container-industry-steadily-progressing-ondecarbonizing/#:∼:text = According%20to%20industry %20data%2C%20CO2,and%20upgrading%20our%20European%20plants
-
12Kobayashi H. Future of oxy-fuel glass melting: Oxygen production, energy efficiency, emissions, and CO2 neutral glass melting. In 80th Conference on Glass Problems. Hoboken, NJ, USA: John Wiley & Sons, Inc; 2021. p. 1–12.
-
13Phillip Ross C. Fundamentals of Batch and Furnace Operation, Glass Industry Consulting International. Glass Problems Conference Training Seminar. Columbus, Ohio, October 31, 2022
-
14 Glass Alliance Europe Position Paper on Decarbonization, May 5, 2021. https://glassallianceeurope.eu/wp-content/uploads/2021/05/2021-05-05-gae-position-paper-on-decarbonisation-v2_file.pdf
-
15 US EPA stats and analysis, Facts and figures about materials waste and recycling glass. November 22, 2023, noted as last update. https://www.epa.gov/facts-and-figures-about-materials-waste-and-recycling/glass-material-specific-data#:~:text=EPA%20combined%20data%20from%20the
-
16 U.S. EPA Update on Circular Economy and America Recycles Day, May 15,2023. https://www.epa.gov/circulareconomy/america-recycles-day#:~:text=The%20recycling%20rate%20has%20increased,to%2050%20percent%20by%202030
-
17 Difu Li (T'14) and Brian McKenzie (T'14) under the supervision of Professor Anant K. Sundaram, Owens Corning: “Pink is the New Green,” Tuck School of Business at Dartmouth College. TC1-0166, December 2014
-
18 Congressional findings and declaration of purpose from the U.S. Government Publishing Office and transfer of functions, Reorg. Plan No. 3 of 1970, effective date December 2, 1970.
-
19 Clean Air Act: “A Summary of the Act and Its Major Requirements” from Congressional Research Service, September 13, 2022; RL30853.
-
20 United Nations Framework Convention on Climate Change. Process and Meetings from the Paris Agreement. UN Climate Change Conference (COP21); Paris, France, on December 12th, 2015; United Nations FCCC/CP/2015/10/Add.1 Decisions adopted by the Conference of the Parties 1/CP.21 Adoption of the Paris Agreement.
-
21Kiron D, Kruschwitz N, Haanaes K, von Streng Velken I. Sustainability Nears a Tipping Point. MIT Sloan Management Review, Vol. 53, No. 2, Winter 2012.
-
22Pellegrino JL, Energetics, Inc. Prepared for U.S. Department of Energy, Office of Industrial Technologies, Glass Industry of the Future, Energy and Environmental Profile of the U.S. Glass Industry, April 2002
-
23 FT Wallenberger, PA Bingham, editors. Fiberglass and glass technology energy-friendly compositions and application. Springer-Verlag US; 2010. https://doi.org/10.1007/978-1-4419-0736-3
-
24Oldfield LF, Wright RD. The volatilization of constituents from borosilicate glass at elevated temperatures. Advances in Glass Technology, VI International Congress on Glass (Washington, USA, July 8–14, 1962), pp. 35–51 (1962).
-
25Scholze H, Tünker G, Conradt R. Verdampfung von Fluor aus Glasschmelzen und beim Einschmelzprozeb, Glastech Ber. 1983; 56(6-7): 131–137.
-
26Sanders DM., Schaeffer HA. Reactive Vaporization of Soda-Lime-Silica Glass.
-
27Wenzel JT, Sanders DM. Sodium and boron vaporization from a boric oxide and a borosilicate glass melt. Phys Chem Glasses. 1982; 23: 47–52.
-
28Sundaram S. Boron-free glass fibres—the trend for the future? Reinforced plastics. Elsevier Ltd; 2003. pp. 0034–3617.
-
29Advantex website address noted as: https://www2.owenscorning.com/composites/pdf/rft-guide/Composite_Solutions_Guide_page12.pdf
-
30Schoenlaub RA. Glass Composition, US Patent 2,334,961, December 5, 1940.
-
31Erickson TD. Glass compositions, fibers, and methods of making same, US Patent 4,026,715, Aug 22, 1974.
-
32Eastes WL, Hofmann DA, Wingert JW. Boron-free glass fibers, US Patent 5,789,325, August 4, 1998.
-
33Beerkens RGC, van Limpt JAC. Impact of glass furnace operation on evaporation from glass melts. Proceedings of 61st Conference on glass problems. Ohio State of University; 2000.
-
34Martens RHEM, van Dijk FAG, Beerkens RGC. Batch carry-over in glass furnaces. Proceedings 78. Nürnberg: Glastechnische Tagung; 2004; p. 247–252.
-
35Prescott PJ, Purnode BA. Simulation in Glass Processes. In: P Richet, editor. Encyclopedia of Glass Science, Technology, History and Culture, vol. 1. Wiley; 2021.
-
36Bruno Purnode B, et al. Numerical simulation of glass fiber manufacturing processes, 15th international Seminar on Furnace Simulation, Design & Operations, Velke Karlovice, Czech Republic (2019), Owens Corning Science and Technology Center; Granville, Ohio, USA
-
37Purnode B, et al. 16th International Seminar on Furnace Process Simulation, Operation and Design, Velke Karlovice, Czech Republic, (2023)
-
38Choudhary MK, et al. An Integrated Approach to Mathematical Modeling of Flow and Heat Transfer in Melting and Delivery Ends of a Glass Furnace. Vsetin, Czech Republic. XIX ICG, July 1–6, 2001, Edinburgh, Scotland. Owens Corning Science and Technology Center; Granville, Ohio, USA
-
39 U.S. EPA Center for Corporate Climate Leadership., Scope 1 and Scope 2 Inventory Guidance. https://www.epa.gov/climateleadership/scope-1-and-scope-2-inventory-guidance Owens Corning Science and Technology Center; Granville, Ohio, USA
-
40Avery G, Carpenter A. Supply Chain Energy and Greenhouse Gas Analysis Using Materials Flows through Industry (MFI) Tool: Examination of Decarbonization Technology Scenarios for the U.S. Glass Manufacturing Sector. Technical Report NREL/TP-6A20-8370. February 2023
-
41 The European glass sector contribution to a climate neutral economy Glass Alliance Europe Position paper v.2 May 5, 2021. https://glassallianceeurope.eu/wp-content/uploads/2021/05/2021-05-05-gae-position-paper-on-decarbonisation-v2_file.pdf
-
42 Glass Packaging Institute document on the “Facts and Benefits of Glass Recycling”. https://www.gpi.org/why-recycle-glass
-
43 Facts and Figures about Materials, Waste and Recycling, Glass: Material-Specific Data. https://www.epa.gov/facts-and-figures-about-materials-waste-and-recycling/glass-material-specific-data
-
44Kamau PK, et al. Strengthening sustainability in the glass industry. International Finance Corporation; 2021.
-
46 Close the Loop Press Release. March 8, 2024. https://closetheglassloop.eu/publications-overview/
-
47 Glass sector Net zero strategy 2050, British Glass. https://www.britglass.org.uk/knowledge-base/resources-and-publications/glass-sector-net-zero-strategy-2050
-
48Furszyfer Del Rio DD, Sovacool BK, Foley AM, Griffiths S, Bazilian M, Kim J, et al. Decarbonizing the glass industry: A critical and systematic review of developments, sociotechnical systems and policy options. Renew Sustain Energy Rev. 2022; 155:111885.
-
49Denholm P, Arent DJ, Baldwin SF, Bilello DE, Brinkman GL, Cochran JM, et al. The challenges of achieving a 100% renewable electricity system in the United States. Joule. 2021; 5: 1331–1352.
-
50 British Glass, Ardagh news announcement from April 2024. https://www.britglass.org.uk/news-comment/ardagh-glass-packaging-launches-rooftop-solar-energy-plant-scotland