Source: Glass Structures & Engineering
Authors: Fred Veer & James O’Callaghan
DOI: https://doi.org/10.1007/s40940-025-00293-4
Abstract
For well over a millennium glass has been “cut” by scoring it with a diamond or similar hard material and bending it putting the score into tension. The result is a “clean” break of the glass along the score. As this has sharp edges, nowadays the edges are usually post-processed using grinding and polishing techniques. Unfortunately cutting works best for orthogonal shapes, although skilled personnel can cut complex shapes. Modern techniques such as water jet cutting are very suited for complex shapes and can be adapted to CNC techniques. However there is very little information on the strength of waterjet cut glass. To investigate this a large series of specimens were prepared using waterjet cutting using the settings suggested by the manufacturer. Small rectangular specimens in thicknesses of 4 mm, 6 mm, 8 mm and 10 mm were made, the edges examined using a digital microscope, tested in four point bending and the fracture patterns were studied. It was found that the 4 mm thick specimens had a lower average strength and higher coefficient of correlation than the 6, 8 and 10 mm specimens. The average strength and coefficient of correlation were comparable for the 6, 8 and 10 mm specimens. The upper side, facing towards the water jet, is slightly less strong than the lower side. The strength of waterjet cut glass is comparable to some batches of conventionally cut glass with ground, arrised and polished edges while the coefficient of correlation is lower. It was found that for the waterjet cut glass virtually all failures originated at the edges, in many cases multiple failures were observed in a single specimen.
1 Introduction
Most sheet and plate material is produced as semi-finished material which needs to be cut to size for use or further processing. Nowadays waterjet cutting is increasingly used because it does not heat the substrate and is very flexible in cutting varied shapes, but the correct settings must be used, Górka and Kotarska (2018).
For glass, waterjet cutting is an attractive process. Waterjet cutting allows for the economical production of rounded and non-orthogonal shapes and also allows for cutting holes or shapes cut-outs into the glass in a single cutting session, Sanders et al. (2021). However it is essential that the correct grit and machine settings are used to ensure consistent cutting and consistent quality, Zhu and Huang (2008), Aicha et al. (2014). In some cases additional post-processing of the waterjet cut edges can be desirable, Sutowska et al. (2022). It has been demonstrated that waterjet cutting of glass offers interesting new possibilities into glass product shapes, Heng et al. (2024). The strength of water jet cut glass is however not clear from the literature, although Sanders et al. (2021) show that for holes this can be very variable. This although waterjet cutting is increasingly used, little concrete information on the strength of waterjet cut glass or the statistics of the strength of waterjet cut glass can be found in the literature. Neither glass producers or waterjet manufacturers have attempted to close this critical knowledge gap.
This paper addresses this knowledge gap, by, investigating the strength of small waterjet cut float glass specimens in four point bending and compares the results with otherwise identical tests done on conventionally processed glass, Veer (2024).
As in conventionally processed float glass the air side and Tin side have been shown to have different average strengths, the tests on waterjet cut glass were designed to determine any potential effect of air side or Tin side being the surface that is cut first on the strength of waterjet cut glass.
2 Material
1.5 × 1.5 m panels of 4 mm, 6 mm, 8 mm and 10 mm thick float glass were supplied by a commercial firm. These were cut out of commercial manufactured jumbo plates supplied by a single float glass producer. These panels were each cut into 108 specimens of 250 × 40 mm using a 5axis waterjet manufactured by Sanken using 80 grit garnet and using the standard manufacturer recommended settings. Sanken is a specialised manufacturer of machines for glass processing and their water jet cutting machines are optimized for cutting glass. Half of the specimens were cut with the air side upwards when cutting, half with the Tin side upwards when cutting. This results in 4 data sets of 27 specimens for each thickness.
- AUU Air side up when cutting and up (in compression) when testing.
- AUD Air side up when cutting and down (in tension) when testing.
- TUU Tin side up when cutting and up (in compression) when testing.
- TUD Tin side up when cutting and down (in tension) when testing.
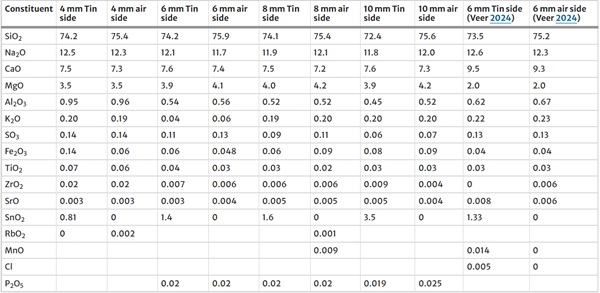
The chemical composition of the glass tested is given in Table 1. The chemical composition is similar to that found before, Veer (2024), except for the slightly higher Al2O3 content of the 4 mm glass. The increase in the SnO2 percentage with thickness implies the Tin oxide layer increase with the thickness of the glass. As the chemical compositions of all samples are comparable, there is no reason to assume the different thicknesses of glass used have different properties.
Table 1 Chemical composition - Full size table
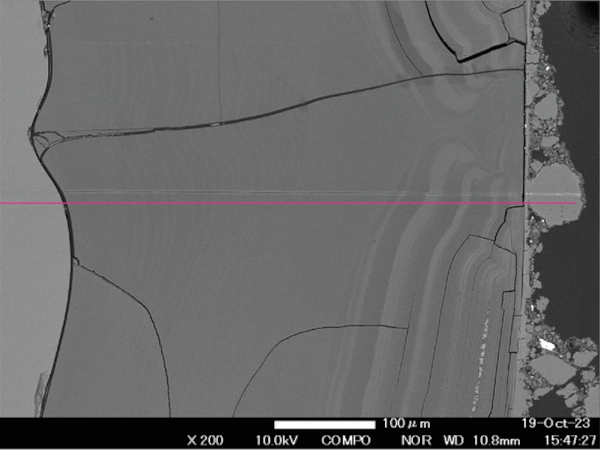
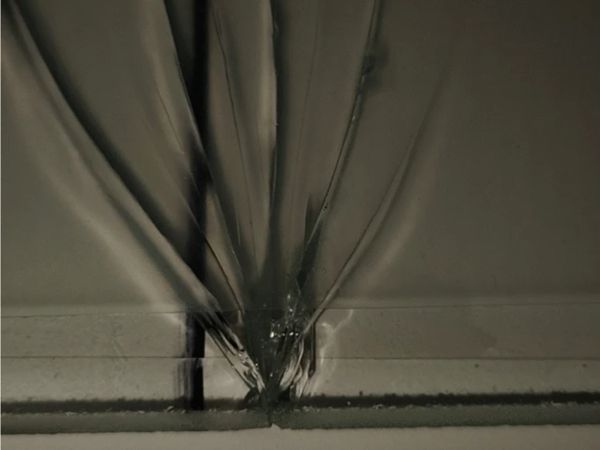
Figures 1, 2, 3 and 4 show the waterjet cut edges for the various thicknesses. The images are made at approximately the same location along the edge but not at the exact same location. The top and bottom of the edges both show damage as do the adjacent air and Tin surfaces. The bottom image in Fig. 1, 2, 3 and 4 is upside down as this connects more conveniently to the other images.
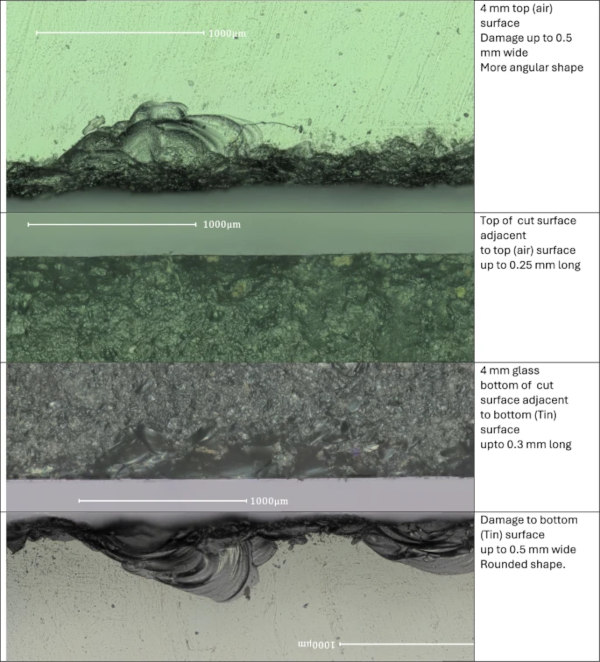
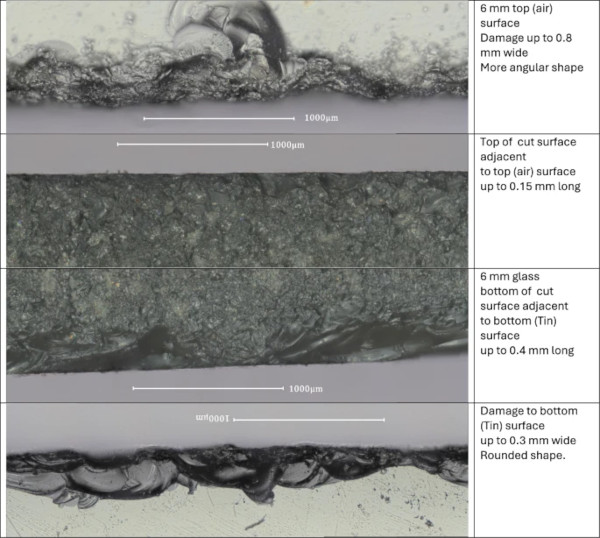
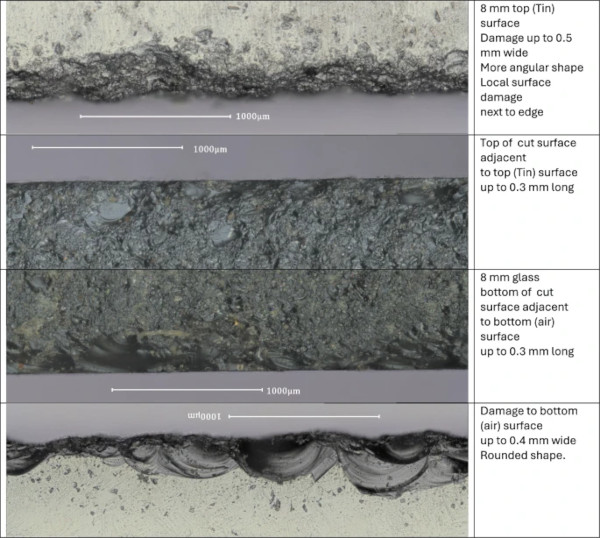
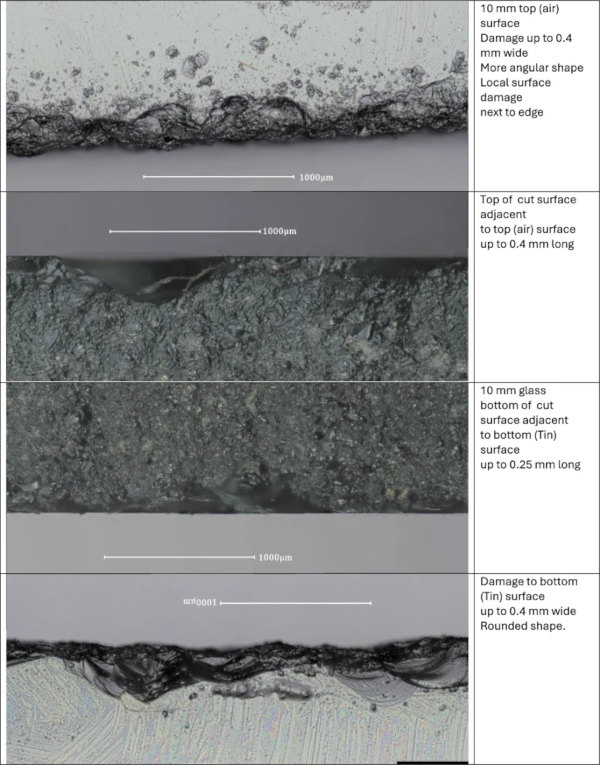
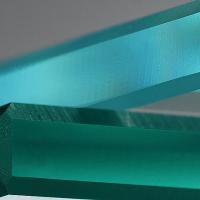
The damage caused by the water jet cutting is the same for both air and Tin sides of the glass. There is however a morphological difference between the top and bottom surface damages. The bottom surface has more continuous but more rounded damage. The top surface has more incidental but more angular damage. The surface between the edges is smooth with defects only several µm deep, as is shown in Fig. 5.
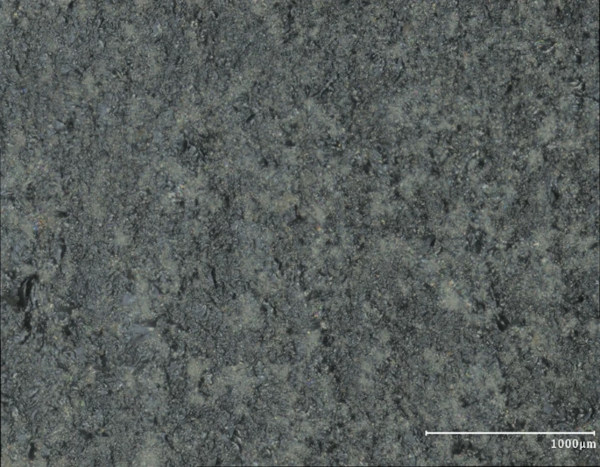
This damage is difficult to quantify. As is clear from the bottom photograph in Fig. 1, the waterjet cut surface is not defined by a clear straight edge. Thus there is no reference to determine flaw depth. The morphological differences between upper and lower side are visible in Figs. 1, 2, 3 and 4, but these cannot currently be quantified in terms of flaw depth. Also as the damage is continuous or closely spaced, the stress concentration cannot be simply calculated. So the qualitative difference between upper and lower side is easily distinguished but cannot be quantified at this moment.
2.1 Testing procedure
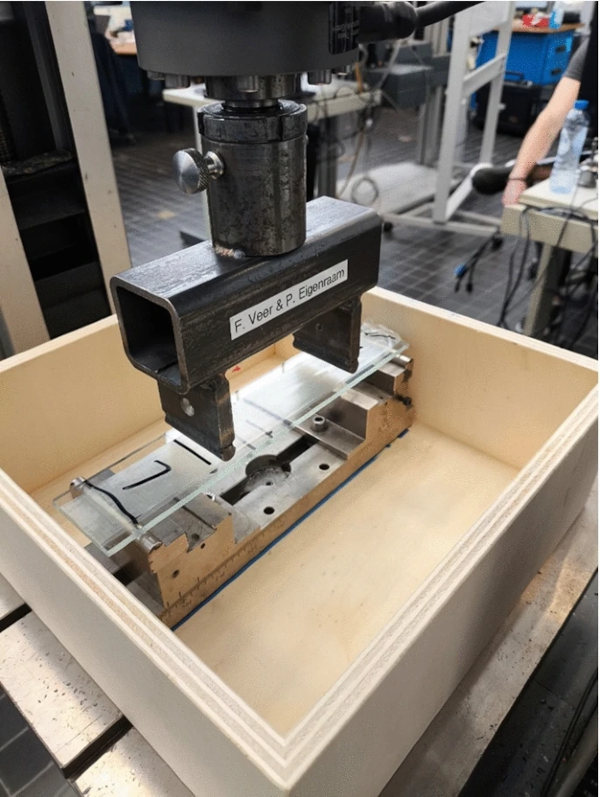
The specimens were identical in size, except for the thickness, to the specimens used by Veer (2024), 250 × 40 mm, and were tested in four point bending about their minor axis using the same machines and software. The failure stresses were also calculated in the same way. The distance between the support rollers was 220 mm and between the loading rollers was 110 mm. The only difference is that in this investigation the specimens were tested using force control rather than displacement control. The force control for each thickness was set to give the same rate of stress increase as the earlier displacement controlled tests done on a single glass thickness by Veer (2024). Specifically 33.75 N/s for 4 mm, 75 N/s for 6 mm, 135 N/s for 8 mm and 210 N/s for 10 mm. This means that as the stress rate is the same, the stress corrosion effects should also be the same and thus independent of thickness allowing for a direct comparison of the results.
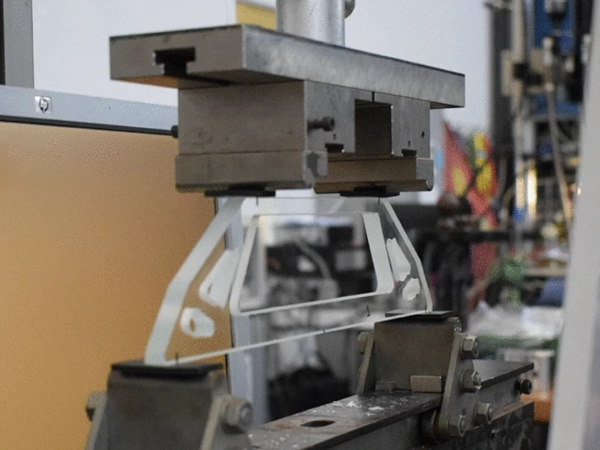
The position of the support and loading rollers was marked on each specimen before the test. After the test the fracture pattern and number of fracture sites were noted. The test set-up is shown in Fig. 6. For safety and to keep the broken specimens together, all specimens were wrapped in Temflex 1500 T transparent self-adhesive tape with the edges exposed.
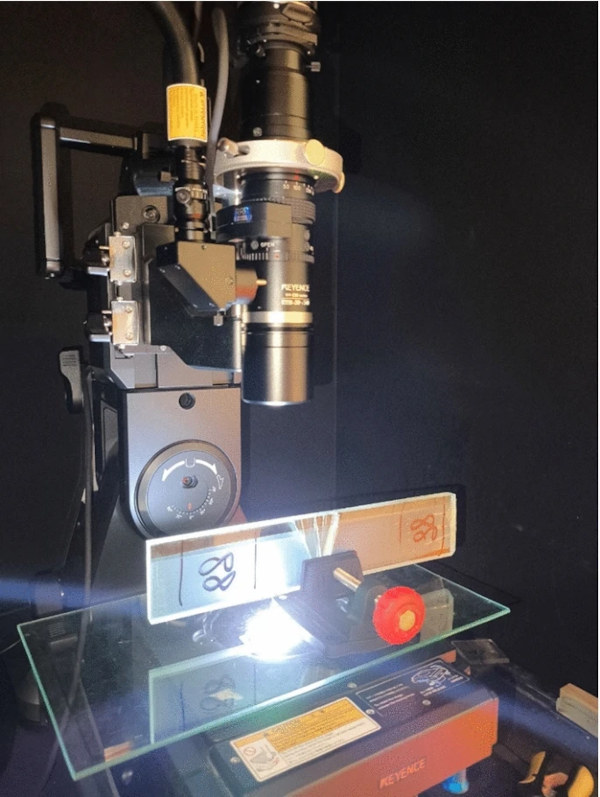
After testing was complete, specimens with low or high strength were selected for microscopic investigation using a Keyence VHX 7000 digital microscope using appropriate lighting, shown in Fig. 7.
3 Results
The results are summarised in Table 2 and given in full in the appendices. The mean number of cracks initiating is calculated by looking at how many cracks initiate in each specimen and taking the mean for each series. A higher number means that more cracks initiate on average in each test.
Table 2 Summary of results - Full size table
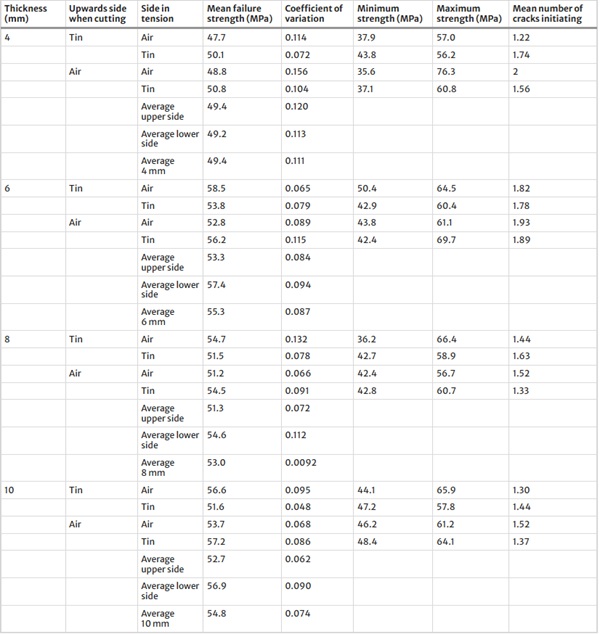
The 4 thicknesses give different results. For the 4 mm tests the results of the specimens with the air side in tension have a slightly lower mean strength and a higher coefficient of variation than the specimens with the Tin side in tension.
The 6, 8 and 10 mm specimens have a higher mean strength than the 4 mm specimens and lower coefficients of variation. The side of the specimens that was at the bottom in the cutting process is on average slightly stronger than the side that was on top (where the cut starts), although the differences are small.
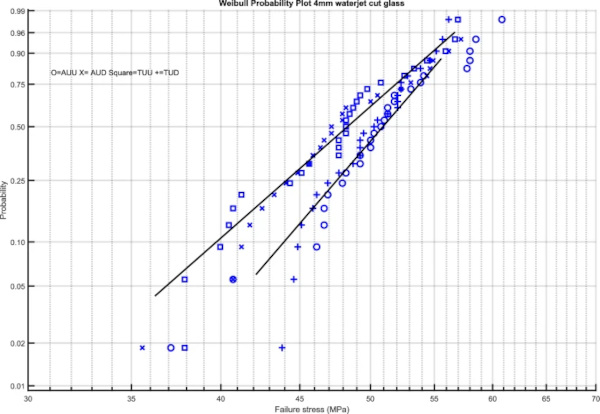
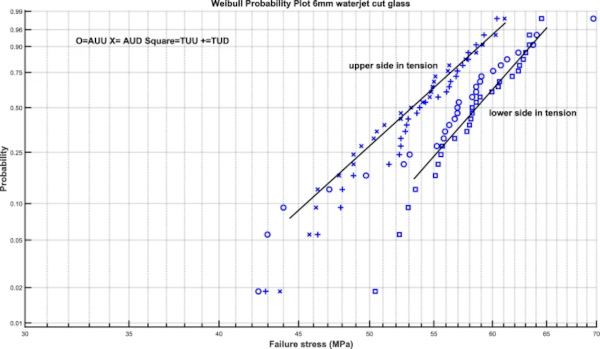
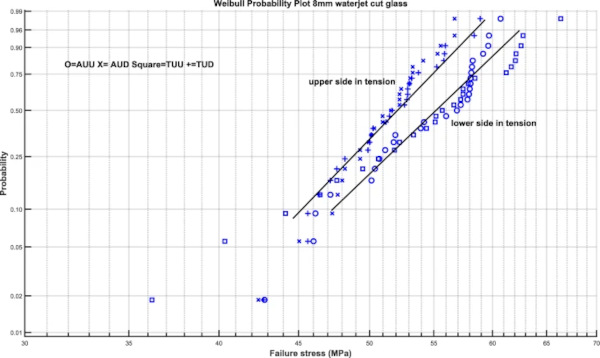
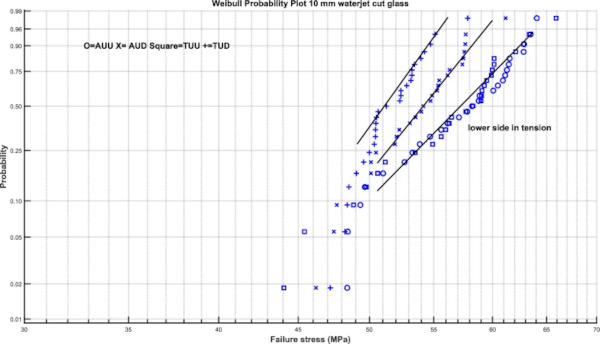
Figures 8, 9, 10 and 11 give Weibull plots for the 4 test series in each thickness. The Weibull plots show that for the 6 and 8 mm thick glass there are two distinct groups, which corresponds to the observation regarding the higher mean strength of specimens tested with the bottom side in tension. For the 4 and 10 mm tests this is more complex.
It is however clear that the difference between Tin side and air side is small and non-systematic. There is however a statistically significant difference for the 6 mm and thicker specimens between the side that is on top when cutting and that is on bottom when cutting (Figs. 12, 13, 14).
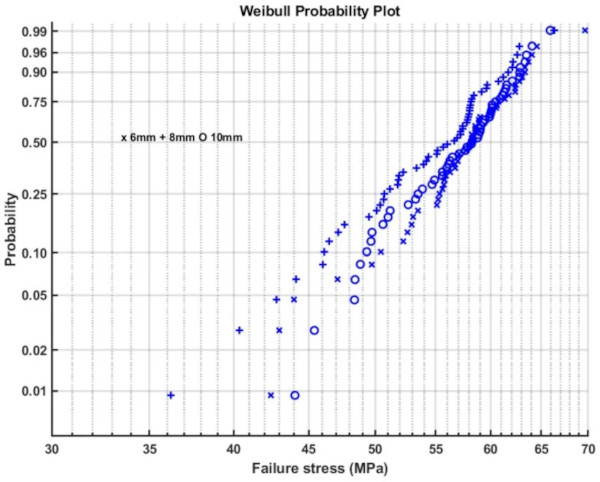
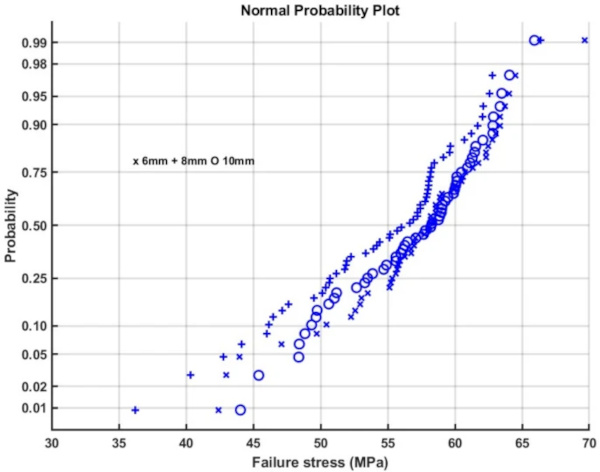
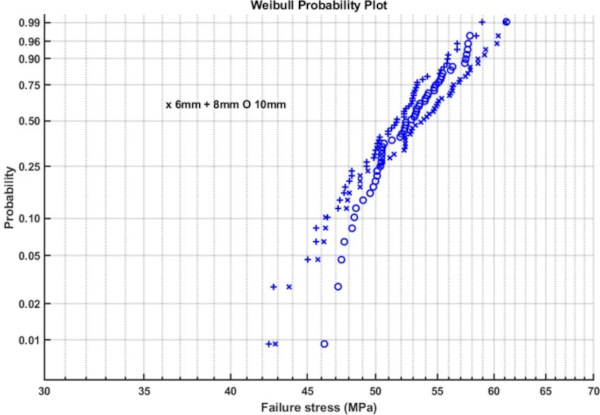
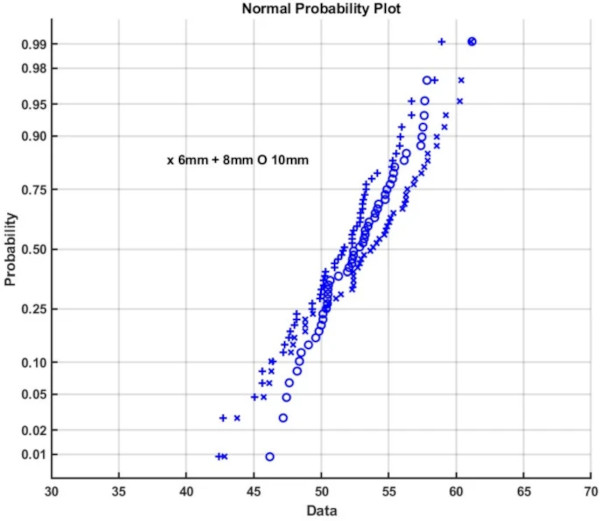
Figures 12 and 14 give Weibull plots for the 6, 8 and 10 mm test results for the lower and upper side respectively. It is clear that some results fit better using the Weibull distribution than others. Figures 13 and 15 show the normal probability plots, which again fit some data sets better than others.
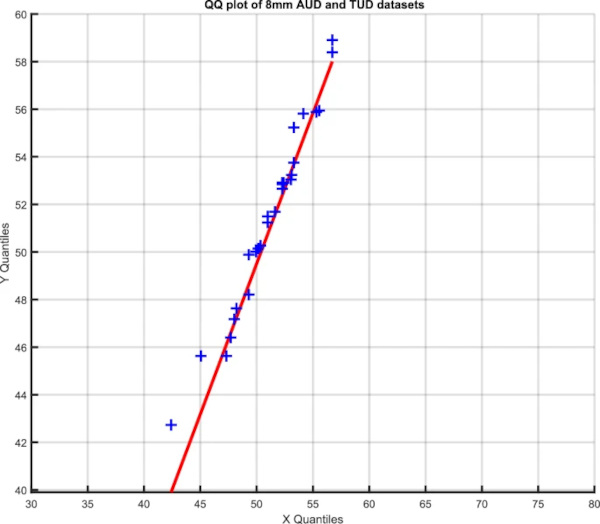
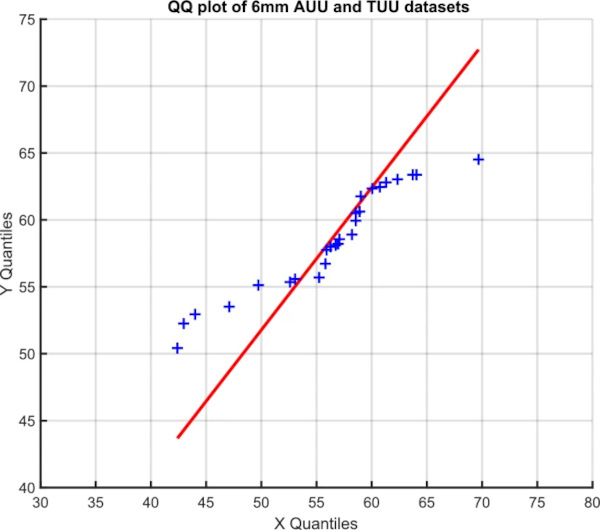
This raises doubts whether all data sets can be statistically compared to each other. Figures 16 and 17 give a Quantile–Quantile plot for the 8 mm upper and 6 mm lower data sets. The QQ plot gives a straight line when both data sets have a comparable distribution. In Fig. 16 this is the case and the two data sets have a comparable distribution. However Fig. 17 shows the two 6 mm data sets cannot be analysed using the same statistical distribution. Thus not all data sets can be validly compared. This implies that rather than a single set of variables controlling the process there are factors involved that occur randomly in time and make statistical comparison of series impossible.
3.1 Fracture patterns
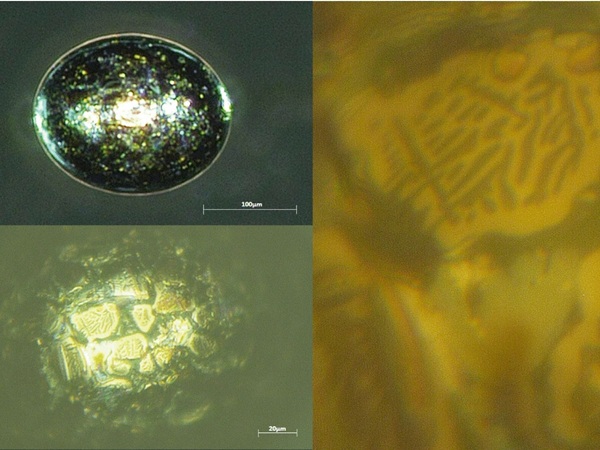
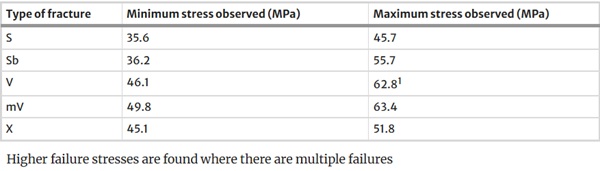
The crack patterns observed are the same as in earlier research, Veer (2024), namely simple, simple branched, V, multiple V and X. These are illustrated in Figs. 18, 19, 20 and 21. In these test careful observation shows that although to the naked eye, V crack appear to start at the edge, as Fig. 22 shows, there is a small initial straight crack of 1 mm or less, which rapidly branches into a V crack. The different crack morphologies relate to the failure stress, each crack type is associated with a range in failure stress as shown in Table 3.
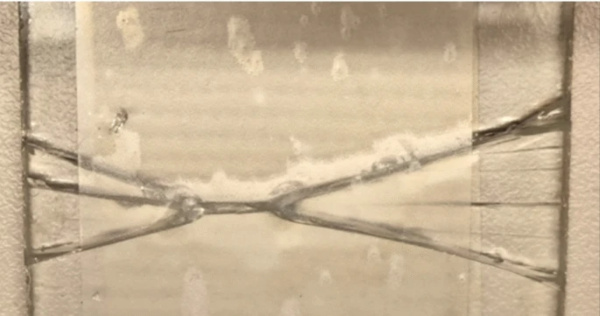
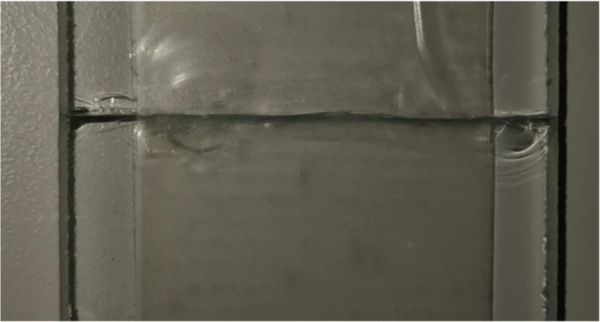
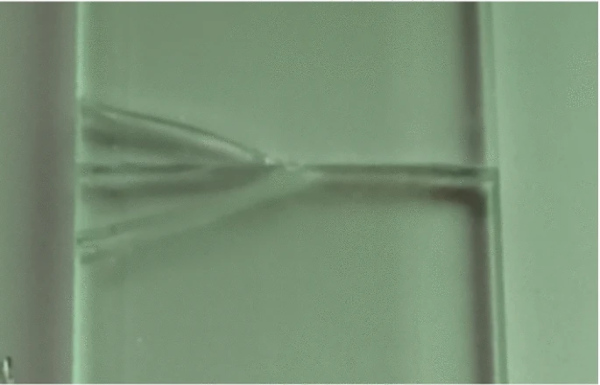
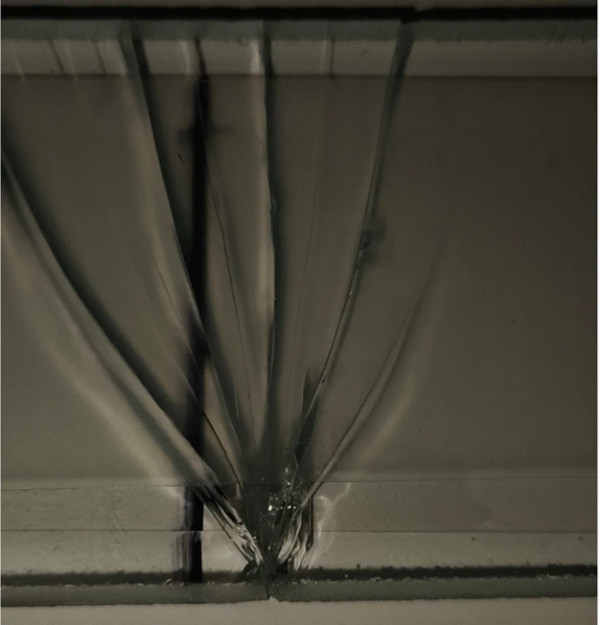
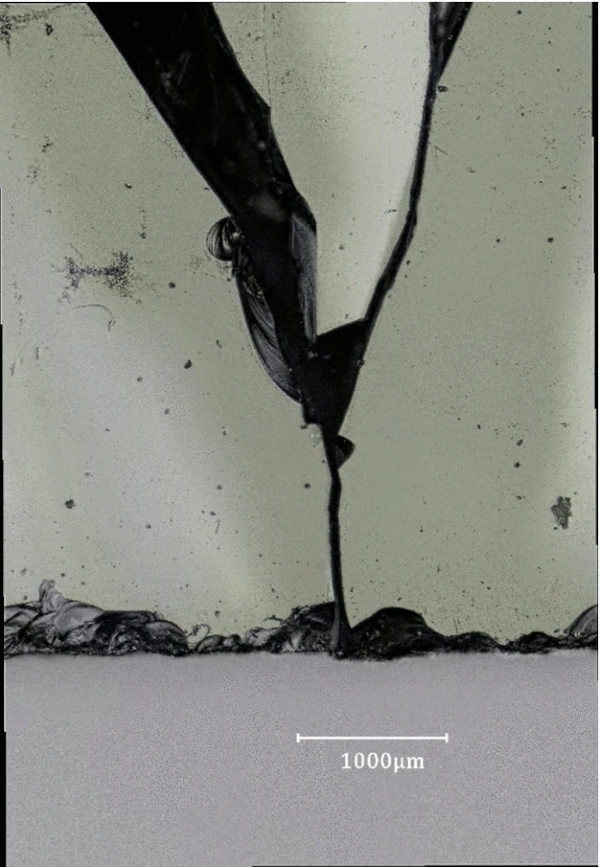
Table 3 Stress range for fracture patterns, single failure only - Full size table
Where the results differ significantly from earlier tests on cut, arrised, ground and polished glass, Veer (2024), is that in many cases multiple failures are observed, see the last column in Table 2. An example is given in Fig. 23, where 3 V failures are visible in a single specimen. Figure 24 shows another specimen with a V and Sb failure. Looking at for instance Fig. 3 this is not surprising as the lower edge is a continuous set of defects, while the upper edge also has at least one major defect per mm of length. With multiple large defects existing along the stressed edge, it is probable that at a high stress level multiple defects (near) simultaneously initiate into cracks, which would result in the results seen in Fig. 23. The pattern of a Sb and V crack in a single specimen seen in Fig. 24 can be explained by the V crack starting first and the Sb crack having a slight delay, the available elastic energy already being consumed by the V crack and thus reducing the energy for crack bifurcation available to the Sb crack.
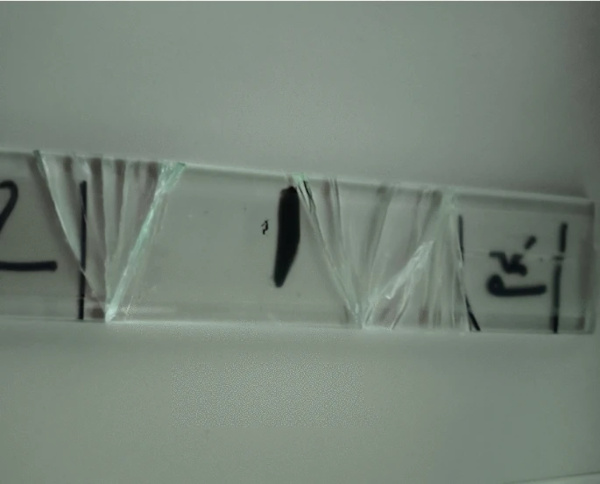
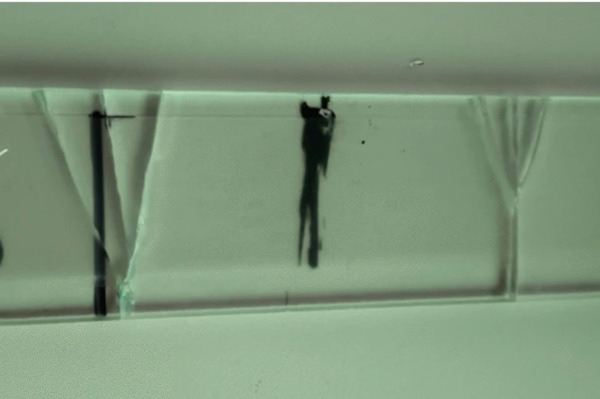
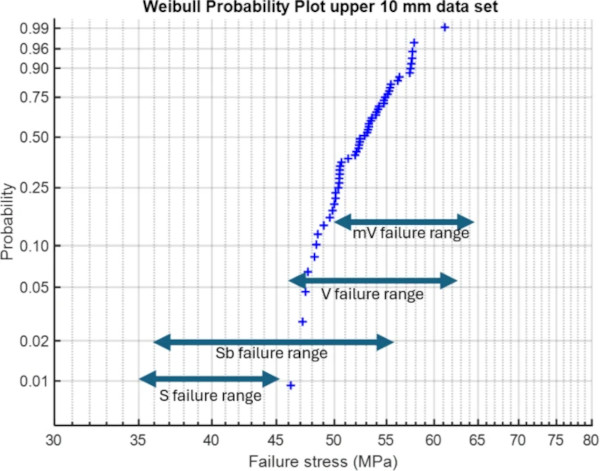
Figure 25 shows the failure strength ranges for the various crack morphologies in a Weibull plot of the upper 10 mm data set. There is no relation between changes in the slope of the Weibull plot and the changes in crack morphology. It is thus assumed that the changes in crack morphology are only the result of higher or lower amounts of elastic energy that need to be dissipated.
3.2 Crack initiation
The fracture initiation sites of a number of selected specimens were investigated with digital microscopy. For the specimens with the bottom side in tension, the damage is more easily seen. Figures 26 and 27 illustrate this. In Fig. 26 the two side of the broken specimen have shifted about 0.1 m horizontally on fracture by stretching the Temflex tape. Specimens are not forced back into alignment to avoid damaging the fracture surface. It is clear that the failure started at a clear defect some 0.3 m deep. Left of the initiation point is what looks like a larger defect, but the end of it is shallow. The defect at point of initiation is more like a penny shaped crack and thus has a higher stress concentration.
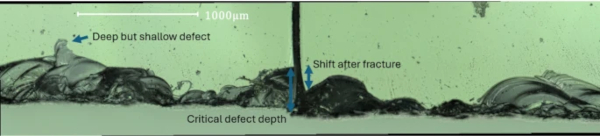
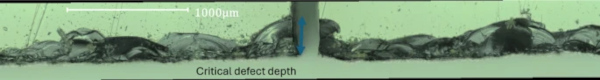
Figure 27 shows a similar specimen but here the defect initiating the fracture is clearly the largest local defect visible. The shape is approximately penny shaped both in cross section and in the plane of the specimen.
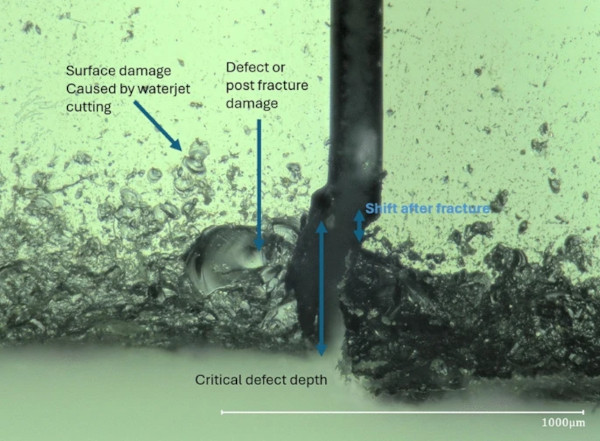
Figure 28 shows an example of a crack initiation point on the upper surface where the waterjet started cutting. There is again a small shift of the two sides of the specimen on fracture, but the defect has some 0.4 mm of depth. It is however clear that the edge damage is much less defined on the upper side than on the lower side. Directly adjacent to the point of crack initiation is an area with a different surface texture. Although this could be damage created after fracture, the morphology of this area is similar to that of the damage zones caused by the water jet cutting close to the edge. This suggests that this area was also produced by the water jet cutting. As this damage is better defined and directly adjacent to the crack initiation point it is probable that the stress concentration produced by this area under tension plays a role in the initiation of the crack.
3.3 Fracture analysis
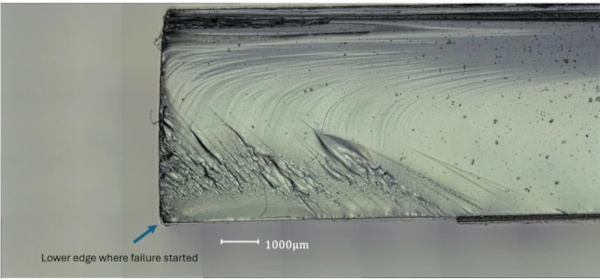
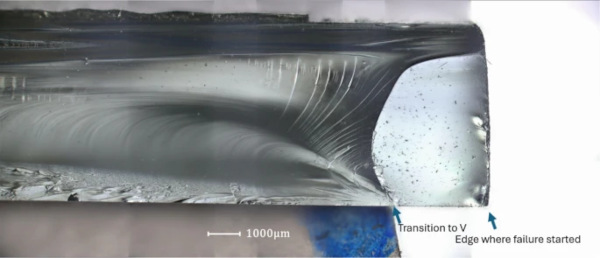
Selected specimens were carefully disassembled so the fracture surface could be studied. Figure 29 shows the fracture surface of the beginning of a Sb crack of a 6 mm specimen. The lower edge where the crack initiated is on the bottom left. Figure 30 shows the fracture surface of a V crack in a 6 mm specimen. The crack initiating as a straight crack in the lower right corner and transitioning to a V crack at the spot shown. In both cases the conventional mist mirror hackle pattern is absent. This was also observed in 6 mm out of plane bending tests on conventionally processed glass, Veer (2024). Fractography for these tests does not help in analysing the relation between defect shape/size and failure strength.
4 Discussion
Although the primary objective result is that waterjet cut glass has a strength comparable to that of conventionally processed glass, the coefficients of variation are smaller. This is summarised in Table 4. In contrast to conventionally processed glass there is no difference in strength between Tin and air side of the glass. Figure 31 shows a plot of the ratio of measured strength to average strength plotted against measured strength for the 8 mm waterjet cut glass, 6 mm poly V polished glass, Veer (2024) and ring on ring tests on new and weathered glass, Veer et al. (2023). This plot also has a horizontal line where the ratio is 1. The intersection of this line and the data lines shows the average value. The slope of the line is a measure of the spread of the data while the vertical range is a measure of the coefficient of variation.
Table 4 Comparing the bending strength of water jet cut float glass with cut, arrised and poly V polished float glass - Full size table
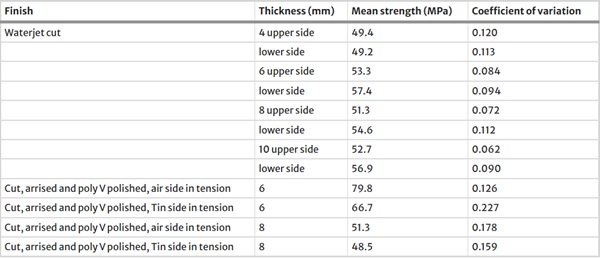
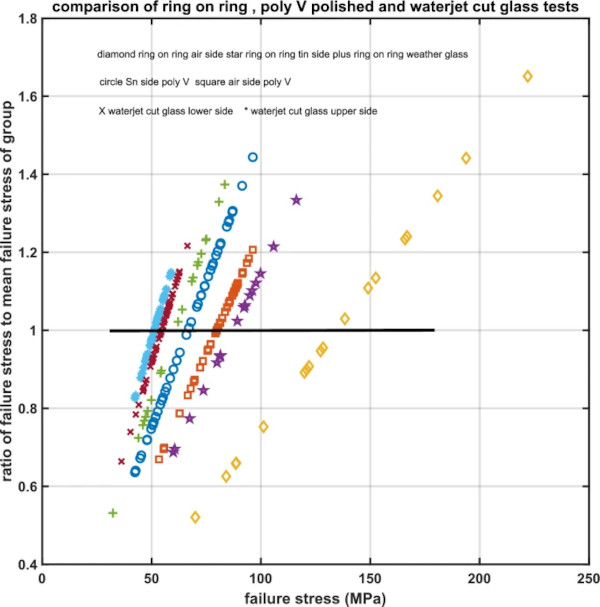
Figure 31 shows clearly that the water jet cut glass is the weakest of the test series shown, however it also has the smallest spread and variation. It also illustrates the critical relationship between strength and damage. The new float glass with air side in tension being on average the strongest, because it has the least damage, while the upper face of the water jet cut glass has the lowest strength because it has the most damage, while statistically also being the most reliable. In engineering terms although the waterjet cut glass has a lower average strength, this strength is much more reliable because of the much lower scatter.
There is however a significant difference between the upper side of the glass which faces the water jet and the lower side. The upper side being some 4 to 8% stronger. At first glance this is not logical because as Figs. 1, 2, 3 and 4 show the lower edge is a continuous line of defects. However these defects are well rounded and thus have lower stress concentrations. On the upper face the number of defects is far lower, but the defects are more angular and thus have higher stress concentrations. So the volume of damage is less important than the geometry of damage. Although the microscope does not reveal any micro-cracks on upper or lower side, the more angular damage decreases the strength of the upper side compared to the lower side.
The 4 mm glass has lower strength and higher coefficient of variation than the thicker glass. Although the defects in the 4 mm glass appear similar and comparable to the defects in thicker glass, see Figs. 1, 2, 3 and 4, there is a clear effect on strength. The author presumes that as the 4 mm glass has lower stiffness and the water jet cutting process applies a non-constant force vibration in the glass during cutting could influence defect shape and size and thus decrease strength.
A complication is the statistical distribution of the strength. Although some data sets show the uni-modal or bi-modal Weibull distribution expected from glass. The data sets seem to differ individually. Figures 12 and 14 show Weibull probability plots for the 6, 8 and 10 mm results of the lower and upper sides respectively. The distributions are very varied, in Fig. 12 the 8 mm results are almost Weibull uni-modal while the 10 mm results are clearly Weibull bi-modal. Figures 13 and 15 give normal probability distributions. For the lower side test results this does not give a better fit than the Weibull distribution, but for the upper side the normal probability plot appears a better fit than the Weibull probability plot. Comparing what should be comparable data sets using the QQ plots in Figs. 16 and 17 shows for instance that the 8 mm AUD and TUD data sets are statistically comparable while the 6 mm AUU and TUU data sets are not. This suggests that for some data sets independent and unpredictable factors are involved. This could for example be the result of variations in the waterjet pressure or grit feeding rate. Although this does not influence the average strength significantly, it implies that some data sets could be less statistically reliable than others.
The crack morphologies observed are similar to those in previous research. The changes in crack morphology are unrelated to changes in slope of the Weibull plot. The water jet cut glass however differs from conventionally processed glass in that many cases with multiple independent cracks are observed. This is assumed to be the result of the observed high defect density along the edges. The presence of many large defects with comparable severity allowing the quasi-simultaneous start of multiple cracks.
The results of fractography are similar to earlier results on conventionally glass of comparable thickness tested in out of plane bending in that the mist mirror hackle pattern is not observed. Thus fractography for these specimens does not provide insights to the relation between defect size and failure stress.
5 Conclusions
Waterjet cutting of float glass results in specimens with a mean strength comparable to float glass specimens processed by conventional methods. The coefficient of variation is however lower.
The waterjet cutting process results in edge damage on both surfaces after cutting. On the lower surface, facing away from the water jet, the damage is near continuous while on the upper (water jet facing) surface the damage is more local. No micro-cracks are observed on the lower or upper face.
The more damaged bottom side however has better strength than the less damaged upper side. The bottom side although continuously ragged along the length, has mostly rounded damage. The upper side appears to have less damage, but the damage is more angular and thus affects the strength more.
Whether the air or Tin surface of the glass is facing the waterjet does not influence the strength.
Failures of waterjet cut glass initiate at the edges. The number of surface failures is much lower than in previous tests on conventionally processed glass. Many specimens fail with multiple cracks, which start quasi-simultaneously. This is attributed to the high defect density along the edges.
Statistically the data sets can be incomparable. This implies that there are occasional random factors in the waterjet cutting process, for instance temporary differences in water pressure or grit feed rate. Thus at certain moments in time the normal statistical distribution is affected by these random events. This seems to only affect certain data sets but makes it impossible to make any general statements on the best statistical distribution for the strength data. The observed effect of these random events on the average strength and scatter is however minor and thus does not affect the reliability of the engineering strength of waterjet cut glass.
Data availability
No datasets were generated or analysed during the current study.