Source:
Challenging Glass 7
Conference on Architectural and Structural Applications of Glass
Belis, Bos & Louter (Eds.), Ghent University, September 2020.
Copyright © with the authors. All rights reserved.
ISBN 978-94-6366-296-3, https://doi.org/10.7480/cgc.7.4602
Authors:
Thorsten Weimar
Christian Hammer
Universität Siegen, Institute of Structural Design

1. Introduction
Laminated glass consists of at least two glass panes and one or more polymer interlayer. The interlayer is made of polymer plastics, which is primarily intended for shock resistance and splinter binding in case of glass breakage, DIN in relation to EN ISO 12543-1 (2011).
Additionally, it determines the load-bearing capacity in some scenarios, for example in case of impact loads. The stiffness of the laminated glass depends on the shear transmission and the elasticity of the various layers, Schneider (2016).
Compared to glass as an isotropic and linear elastic material, the polymer interlayer shows a more complex material behaviour. The challenge there lies in the translation of the thermo-mechanical parameters derived from small test specimens to the actual building component scale, due to considering type and duration of the mechanical and thermal stress, Kraus (2019).
According to Rösler (2016), non-linear viscoelastic material behaviour can be specified as various biaxial hypotheses of effective stress. The planar stress field, which initially only depends on the strain, has to be developed according to loading rate and temperature. However, the material models used in numerical calculations have to be experimentally validated in component tests.
In case of bending tests, values of rotation, curvature and surface strain are determined by any bending differential equation with pre-identified deformation, cross-sectional stiffness and bearing conditions. However, if the analysed structure is not clearly captured by one theory, such as plate or sandwich theory, it is not possible to derive deformation values at any certain location. Since the material properties of the interlayer can only be measured indirectly during component testing, a distributed system providing gradient values complements any discrete-location measurements.
For both, verification and further development of existing material and structural models, innovations in the field of measurement technologies are required. In addition to inductive displacement sensors and strain gauges, which are generally applied at discrete measuring points, fiber optic sensors are used in tensile and bending tests. A gradient-based system of measuring surface strain at the various interfaces of laminated glass enables an expanded representation of the load-bearing behaviour and the determination of material properties of viscoelastic interlayers.
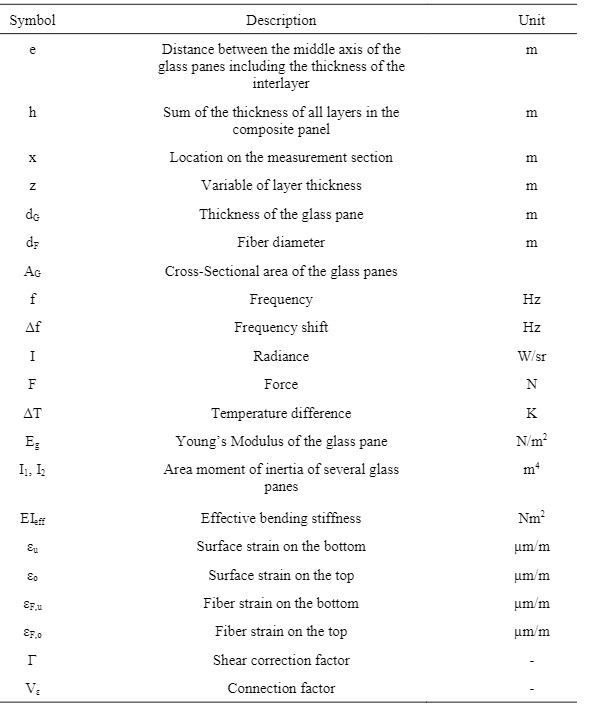
Table 1: Symbols used in the study.
2. Locally distributed fiber optic strain measurement
2.1. Fields of application
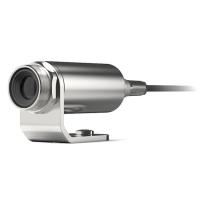
Fiber optic sensors are currently used for strain measurement in various areas of structural analysis. For example, in curved laminated glass, strain is determined at equidistant points along a measurement section using fiber Bragg grating sensors, Fildhuth (2016). With a diameter of approximately 0.2 mm, these thin, transparent glass fiber sensors represent an advanced measuring technique compared to strain gauges, especially if the measuring points are located in a short distance apart.
Going further, fiber sensor technology based on Rayleigh signal analysis represents the next step, since it provides individual strain values for the distance between the Bragg gratings. The theoretical measuring point distance lies in the range of less than 1 mm and enables quasi-continuous strain and temperature profiles.
Glass fiber sensors with this measuring method are also applied for analysing reinforced concrete components, especially in the determination of surface strains with large gradients, in the early localisation of cracks and in the detection of bond stress between reinforcing steel and the concrete matrix, Schmidt-Thrö (2016). They are also used in systems monitoring delamination and stress peaks in fiber composite components, Duffner (2019) and Rajan (2017).
2.2. Rayleigh signal analysis and determining the strain coefficient
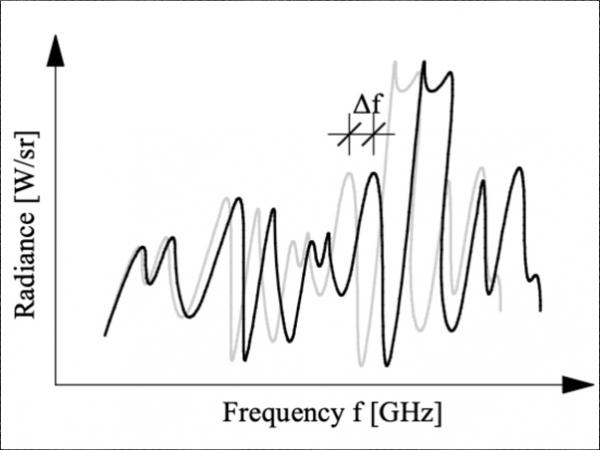
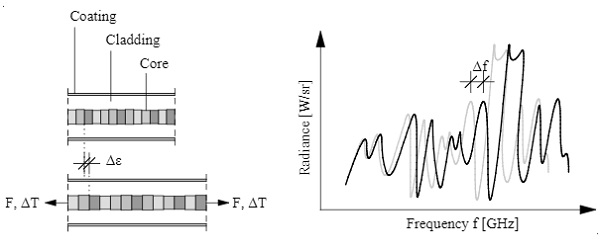
In commercially available glass fibers, a coherent optical frequency domain reflectometer is used for the characterisation of the intensity curve of the Rayleigh scattering. Production-caused fluctuations in the refractive index of the fiber core lead to fluctuations in the intensity of the Rayleigh scattering, Samiec (2011). The intensity is described as a function of the frequency of the backscattered light for each defined fiber section with constant characteristic frequency patterns.
Changes in external conditions, such as temperature or load-induced stress, results in a variation of the fiber length and a shift in the frequency pattern. The frequency shift is converted into strain and temperature values using the corresponding correlations. Figure 1 shows the strain of the refractive index profile and the associated shift in the frequency pattern.
After converting the frequency signal, the non-linear relationship between frequency shift and temperature difference is specified by using a fourth-order polynomial. The coefficients of the polynomial are defined experimentally according to Froggatt (2006). The surface strain under static load is determined by the linear relationship between the measured frequency signal and the fiber strain, expressed by a strain coefficient.
The strain coefficient is determined by a tensile test with three test specimens made of float glass referred to EN 572-2 (2012) with a size of 40 mm by 250 mm and a thickness of 5 mm. Uniaxial strain gauges are applied parallel to the bonded fiber. The measuring section of the fiber is positioned at the same height as the strain gauges. Figure 2 shows the experimental set-up and the curve of recorded surface strain values in tensile tests using strain gauges and fiber optic sensors in intervals of 25 time steps and a measuring rate of 1 Hz.
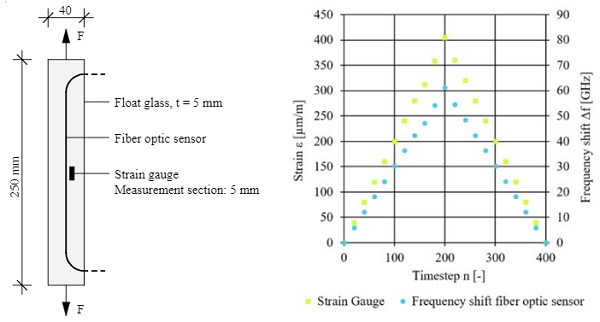
The cyanoacrylate adhesive applied, Weiss Chemie (2016), generates a stiff, and elastic connection between glass surface and fiber optic sensor. The difference in displacement between glass fiber and the adhesive matrix is insignificant, with an expected expansion spectrum of around 500 μm/m. In cyclical, path-controlled tensile tests with a rate of 0.01 mm/min and a maximum load up to strains of 405 μm/m, compressive stresses in the fiber in the range of 4 μm/m remain even after relieving due to the irreversible slip between fiber coating and adhesive down to 6 μm/m. Using linear flaw distribution in the expansion spectrum, this corresponds to a deviation of approximately 1.5 %.
The strain coefficient is expressed by the quotient of strain-to-frequency. The tensile tests find it to be 6.61 μm/(GHz m). This agrees with the strain coefficient determined on aluminium samples for the pure glass fiber, which is 6.58 μm/(GHz m), deviating by just 0.45 %, Frogatt (2006). Under tensile stress, this means that 99.6 % of the strain is transferred from the glass surface to the glass fiber.
2.3. Conversion of fiber strain to surface strain
Due to the distance between the fiber axis and the glass surface, measured strain values have to be adjusted in the case of variable strain through the height of cross-section. Starting from a full transfer of the strain between the glass fiber and the glass surface, the surface strain is determined by linear interpolation.
The two limit states of constant stress and variable stress in the glass layer are considered with a maximum gradient. As shown in Figure 3, the correction results in the ratio of the edge expansion. If the expansion ratio changes over the measuring section due to various bond properties between the layers, the correction is given as a function of the expansion ratio depending on the measuring location.
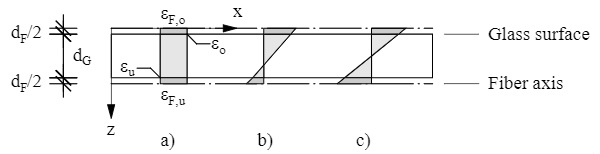
Geometric analysis gives equations 1 to 3, which provide corrected strain values based on the values measured from the fiber axis and coordinate system defined in Figure 3. The strain at the top edge, εo, results from equation 2, whereas the bottom edge strain εu, comes from equation 3.
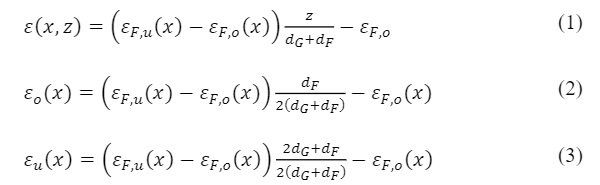
A higher strain gradient means that the deviation between measured and surface strain values increases. If the ratio of top strain, εF,o, to bottom strain, εF,u, changes along the length of the fiber, the values are corrected along the entire measuring section.
3. Bending tests
3.1. Four-point bending test on monolithic glass panes
The strain coefficient determined in the tensile test is validated in a four-point bending test on three monolithic glass panes with a thickness of 10 mm. The size is defined with 250 mm by 1,100 mm, which results in beam-like bending with negligibly low bending stresses in the transverse direction, Blank (1990). The linear elastic material behaviour of float glass as well as their simple numerical model are suitable for assessing whether the previously calculated strain coefficient holds up.
The load is operated with a rate of 0.2 mm/min up to a maximum deformation of 10 mm in the middle of the field. For the strain measurement, a fiber-optic sensor is installed as a loop on the top and bottom of the glass pane. The four measurement sections are shown in Figure 4 with the arrangement of the sensor as well as the results from linear calculation using the finite element method (FEM) by the software RFEM.
Due to the large sensor length of 5.2 m, including measuring sections and loops, there is a fluctuation in the strain values in the range of approximately ±15 μm/m, which is compensated for using sliding median analysis. Figure 5 shows the strain at the top and bottom in the middle of the bending beam with a load of 685 N as an example, with the associated 10 mm deformation in the centre. The maximum strain values measured in this test are ±460 μm/m and, with slight deviations in the tensile zone of around 10 μm/m, correspond to the calculated strains.
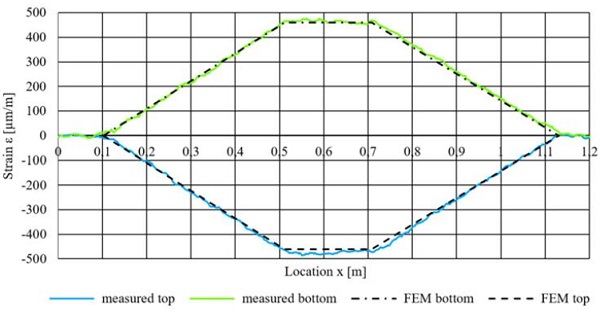
After converting the measured values in the fiber sensor to the level of the glass surface, the measured strain shows fine agreement with the values got of numerical calculation. Both, the strain coefficient found in the tensile test as well as the cyanoacrylate adhesive are therefore suitable for use with fiber sensor technology in order to be able gain accurate, quantifiable data of surface strains on glass panes in the measured expansion range.
3.2. Four-point bending test on laminated glass panes
Correctly determining the load-bearing behaviour of laminate and composite constructions rests on ascertaining both the mechanical properties of the materials used as well as applying a suitable bending theory. According to Sackmann (2008), the shear modulus is best established experimentally in a four-point bending test. The calculation of the shear modulus is predicated on the measured deformation and the surface strain in the centre of the beam. This is done by the differential equation of the composite beam while maintaining the Bernoulli hypothesis of flat cross-sections for each individual layer according to Stamm (1974).
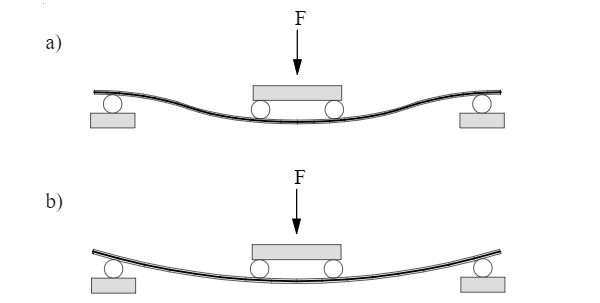
The derivation of the shear modulus is based on a constant value across the beam axis. This produces a beam bending line without any turning points. However, the test results on composite beams show a change in curvature between the support and load application points. This is due to a non-constant value of the shear modulus along the longitudinal beam axis.
Figure 6 shows, qualitatively, the bending line of laminated glass for the longitudinal axis with different stiffness properties for the interlayers. As can be seen, the bending line for both stiff and soft interlayers shows no change in curvature. In the case of interlayers with medium stiffness, however, the resulting stiffening on the supports does indeed cause a change in curvature. There, the stiffening depends on the increased shear modulus that occurs as a consequence of the larger differential deformation between the glass panes in the support area.
Measuring the distributed surface strain at the composite interlayers in the axial direction allows for the gradation of the shear transmission between the glass panes to be specified as a function of the shear modulus depending on the axis location. The calculation is based on the geometrical linear sandwich theory and the ratio of the measured surface strain compared to the deformation over the beam axis.
The deformation line then results from numerical integration of the curvature, which is given from the surface strain at the edges of the lower glass pane by using the bending differential equation for geometrical linear calculation. The boundary conditions come from the geometry, support, as well as deformation measured at the end and in the middle of the beam.
The effective bending stiffness, with the area moments of inertia I1 and I2 from the glass layers and the shear correction factor Γ, results from equation 4.

with

Equation 5 results in the surface strain ε(x) for a rectangular beam with the ratio of the distance between the load application and the support axis of x/L.
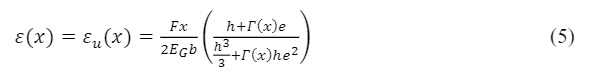
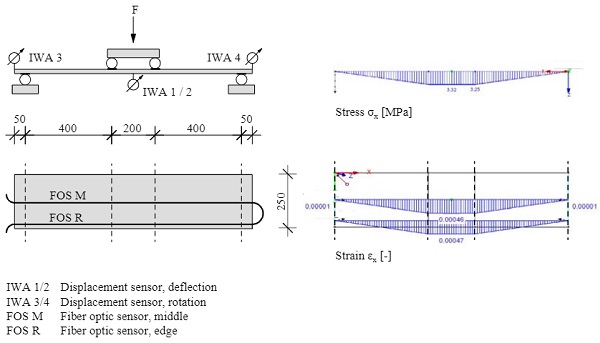
Figure 7 illustrations a composite beam with the size of 250 mm by 1100 mm and two glass panes with a thickness of 4 mm each. The interlayer of polyvinyl butyral (PVB) comes with a thickness of 0.76 mm. Additionally, it shows the surface strain gradient of an equivalent monolithic beam made of float glass with a cross-sectional height of 8.76 mm and the composite factor Vε. As a result of the variable shear modulus being dependent on the shear displacement, the composite stiffness also displays a variable trajectory along the beam axis.
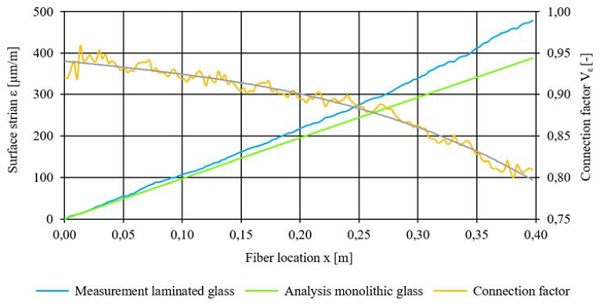
The connection factor Vε is defined according to Gräf (2003) as the ratio of the calculated strain εR(x) from a monolithic glass cross-section equivalent to the laminated glass cross-section to the measured strain ε(x) and is given in equation 6.
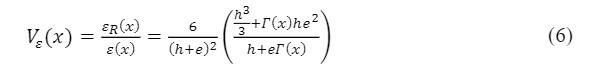
Equation 6 enables to determine the shear correction factor as a function of the fiber location. If, for instance, implemented in software, this could also include the measured shear displacement as a function of the shear angle. Because the correction factor and its derived modulus is now available as a function, it is possible to give an improved description of the load-bearing behaviour compared to a shear modulus that only uses discrete surface strain values.
4. Conclusion
The quasi-continuous strain measurement with fiber optic sensors enables detection of the variable mechanical behaviour of polymeric interlayers in laminated glass along longitudinal cuts. The material properties are first determined in component tests and then, using differential equations, mapped to the sandwich beam with a maximum deformation in the geometrical linear range. In addition to point-to-point measuring systems, such as strain gauges, a distributed sensor system is therefore also suitable for quantifying the shear modulus of physically non-linear interlayers.
Additional studies lead to the derivation of the material properties for polymeric interlayers under geometric non-linearity with large deformations as well as to the development and validation of material models on sandwich panels with a biaxial plane stress state according to Altenbach (1996). Furthermore, the influence of grading the interlayer properties as a function of temperature and loading rate for the materials polyvinyl butyral (PVB), ethyl envinylacetate (EVA), thermoplastic polyurethane (TPU), and SentryGlas® (SG) is examined.
5. References
Altenbach, H., Altenbach, J., Rikards, R.: Einführung in die Mechanik der Laminat- und Sandwichtragwerke. Stuttgart: Deutscher Verlag für Grundstoffindustrie (1996)
Blank, K., Grüters, H., Hackl, K.: Constribution to the size effect on the strength of flat glass. Glastechnische Berichte 63, Nr. 5 (1990)
Cyanacrylat-Klebstoff COSMO CA 500.120, Technichnical Datasheet. Weiss Chemie + Technik GmbH & Co. KG, Haiger (2016)
Duffner, E., Mair, G. W., Munzke, D., Eisermann, R., Szczepaniak, M.,Schukar, M.: Lebensdauerversuche an Faserverbund-Druckbehältern überwacht mittels Schallemissionsprüfung und optischen Fasern. 22. Kolloquium Schallemission und 3. Anwenderseminar Zustandsüberwachung mit geführten Wellen. Deutsche Gesellschaft für zerstörungsfreie Prüfung (DGZfP). Karlsruhe (2019)
EN 572-2: Glass in building – Basic soda lime silicate glass products – Part 2: Float glass. Berlin: Beuth, (2012)
EN ISO 12543-1: Glass in building – Laminated glass and laminated safety glass – Part 1: Definitions and description of component parts. Berlin: Beuth,(2011)
EN ISO 12543-2: Glass in building – Laminated glass and laminated safety glass – Part 2: Laminated safety glass. Berlin: Beuth (2011)
Fildhuth, T., Knippers, J.: Entwicklungen zur Anwendung faseroptischer Sensoren für die Spannungsmessung in Glaslaminaten. Glasbau 2016. Berlin: Ernst & Sohn (2016)
Froggatt, M, Gifford, D. Kreger, S., Wolfe, M., Soller, B.: Distributed strain and temperature discrimination in unaltered polarization maintaining fiber. Optical Fiber Sensors. Optical Society of America, ThC5 (2006)
Gräf, H.: Untersuchung zum Tragverhalten von Verbund-Sicherheitsglas bei linienförmiger und punktueller Lagerung. Dissertation. Technische Universität München. München (2003)
Kraus, A., Schuster, M., Botz, M., Schneider, S., Siebert, G.: Zur Normung thermomechanischer Untersuchungen an polymeren Verbundglaszwischenschichten. Glasbau 2019. Berlin: Ernst & Sohn (2019)
Rajan, G., Gangadhara Prusty, B., Iniewski, K.: Structural health monitoring of composite strucures using fiber optic methods. Boca Raton (USA): CRC Press (2017)
Rösler J., Harders, H., Bäker, M.: Mechanisches Verhalten der Werkstoffe. Wiesbaden: Springer (2016)
Sackmann, V.: Untersuchungen zur Dauerhaftigkeit des Schubverbunds in Verbundsicherheitsglas mit unterschiedlichen Folien aus Polyvinylbutyral. Dissertation. Technische Universität München. München (2008)
Samiec, D.: Verteilte faseroptische Temperatur- und Dehnungsmessung mit sehr hoher Ortsauflösung. Photonik, Heft 6. Fellbach: AT-Verlag (2011)
Schmidt-Thrö, G., Scheufler, W., Fischer, O.: Kontinuierliche Faseroptische Dehnungsmessung im Stahlbetonbau. Beton- und Stahlbetonbau 111, Heft 8. Berlin: Ernst & Sohn (2016)
Schneider, J., Kutsche, J., Schuler, S., Schneider, F., Wörner, J.-D.: Glasbau. Berlin: Springer (2016)
Stamm, K., Witte, H.: Sandwichkonstruktionen. Berlin: Springer-Verlag (1974)