Source:
Challenging Glass 7
Conference on Architectural and Structural Applications of Glass
Belis, Bos & Louter (Eds.), Ghent University, September 2020.
Copyright © with the authors. All rights reserved.
ISBN 978-94-6366-296-3, https://doi.org/10.7480/cgc.7.4487
Authors:
Marcus Glaser a
Jörg Hildebrand a
Jean Pierre Bergmann a
Benjamin Schaaf b
Pietro Di Biase b
Carl Richter b
Markus Feldmann b
Mascha Baitinger c
Marcel Reshamvala c
Barbara Siebert d
Tobias Herrmann d
Andreas Haese d
a Department of Production Technology, Technische Universität Ilmenau, Germany
b Institute of Steel Construction, RWTH Aachen University, Germany
c Verrotec GmbH, Mainz, Germany
d Ingenieurbüro Dr. Siebert, München, Germany

The load-bearing capacity of glass as a structural material as well as sustainability and resistance of a built-in glass against appearing loads and forces is assuming an ever-greaterimportance. Next to analytical and numerical calculations of maximum load-bearing capacity and the ultimate limit state, there is no generally accepted standardized non-destructive inspection method available, with which it is possible to estimate the prevalent load situation and predominant stress conditions, particularly in relation to mechanical or adhered connections.
Within the research project “BiGla”, a measuring instrument based on photoelasticity was developed, which enables to measure and monitor occurring load states during the installation process, as well as the utilization of glass components subjected to significant load changes during their life cycle. Based on the combined examination of photoelasticity and its synergism with the finite element analysis it becomes possible to transfer qualitative measurement results into quantitative evaluations of predominant stress conditions. Achieved results, gained during experimental investigations under laboratory conditions, as well as during extensive field tests, are presented in this publication.
1. Introduction
Today’s challenges during planning phase and design process of glass constructions are versatile and mainly driven by the aspiration of increased building transparency and the highest possible reduction of non-transparent attachment points. Furthermore, the load-bearing capacity of glass as a structural material as well as sustainability and resistance against appearing forces is assuming an ever-greater importance. Next to analytical and numerical calculations of maximum load-bearing capacity and the ultimate limit state, there is no generally accepted standardized inspection method available, with which it is possible to estimate the prevalent load situation or predominant stress conditions of a built-in glass, particularly in relation to mechanical or adhered connections.
To confirm the durability of a glass construction, the early detection of damages and, therefore, raise of the construction safety should be attained. For this reason, a generally accepted non-destructive testing method, which allows evaluating the mounting conditions, has to be developed within the research project "BiGla". The underlying approach of the developed measuring device is based on the photoelastic effect in transparent materials and the interconnected synergism with the finite element analysis.
The optical procedure of photoelasticity allows thereby to determine a qualitative valuation of the stress behaviour of a built-in glass and especially in the area around fastening elements with respect to the specifical characteristics of mechanical and bonded mounting systems. Thus, it is possible to visualize the qualitative stresses in glass in-situ and picture critical stress peaks and transgressions. A qualitative statement about the glass stress behaviour can be defined and then converted into a quantitative statement via correlation of experimental and numerical simulation results. This proceeding provides a substantial improvement and contributes in detection of possible failures and imperfections within regular examinations.
2. State of the art
2.1. Photoelasticity
The optical effect of photoelasticity is based on the visualization of the birefringence of optically isotropic or polarised light in transparent materials and can therefore be used to visualize specific components of the present stress distribution. In this context, it is of no importance whether the considered object is loaded externally or, for example, as often in the case of glass, has an impressed stress state due to tempering, since loaded glass shows the property of so-called birefringence due to the stress state in the material.
Photoelasticity is based on the physical properties of light, as it propagates in space as a transverse electromagnetic wave (wave model). The oscillation directions of the individual waves emitted by a light source are perpendicular to the direction of propagation and stochastically distributed. A distinction can be made between monochromatic light with one specific single wave length and white light, which contains a wave spectrum. By the use of a so-called polariser, all oscillation directions that do not correspond to the polarization direction are blocked and thus polarised light is created.
This polarised light has a clearly defined way of oscillation, while linear and circular polarised light are the main representative forms. The difference between these two types of polarization is that in linearly polarised light, there is a directional dependence of the light oscillation (sinusoidal wave in the plane), while with circularly polarised light, there is no directional dependency and the light wave oscillates circularly around the direction of propagation. The arrangement of optical components such as polarisers or quarter-wave plates (in case of circular polarised light) in order to exploit the effect of photoelasticity is defined as a polariscope.
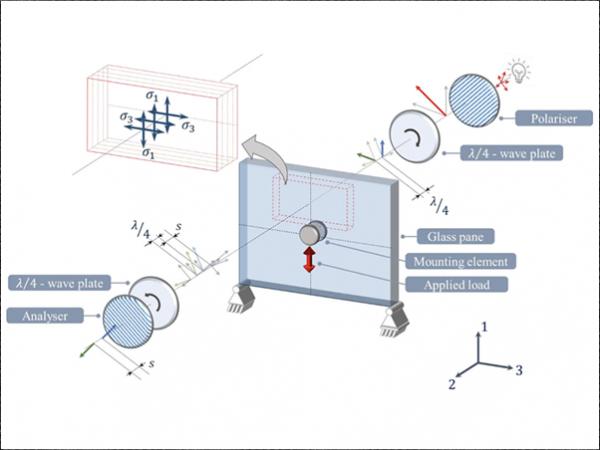
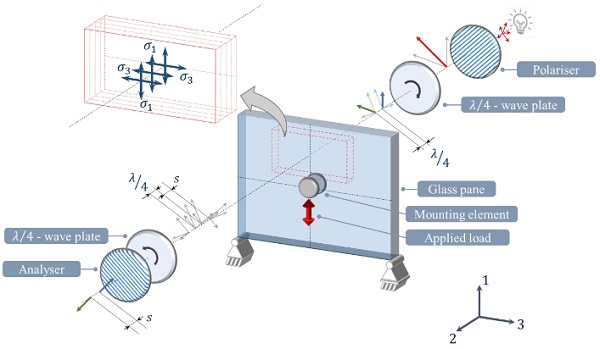
A birefringent object, such as a loaded glass element, in a polarised light field causes the used (monochromatic or polychromatic) polarised light vector to be split into the two perpendicular vector components, in accordance to Brewster's law (Föppl 1972). The directions of these vectors are equal to the two principal directions of stress in the material σ1 and σ3, perpendicular to the glass thickness. However, stress components, with parallel orientation to the propagation direction of light, have no photoelastic influence.
After passing through the birefringent medium, the two components undergo an optical retardation due to stress state within the specimen. The optical retardation is dependent on the material, taken into account the so-called photoelastic constant C and the principal stress difference over the specimen thickness (Hildebrand 2010). Depending on the principal stress differences and the type of light used, the optical retardation appears as colourful patterns in the glass. The optical retardation can be determined with suitable measuring methods, as described in (Feldmann 2017) and (Schaaf 2017), for example.
The usage of the effect of photoelasticity allows to screen and evaluate a specific surface area and is crucial for the indication of the in-situ state of stress for different types of glass under various load scenarios. Furthermore, alterations during the lifecycle can be detected reliably.
Nevertheless, it is only a quantitative determination of the optical retardation and it is impossible to derive a direct conclusion about the stress state in terms of quantitative values. To achieve this, the gained measurement results must be converted and then used as a comparative value for comparison with numerical finite element simulations, in order to obtain the distribution of the "true" values in the glass, taking into account the knowledge and experience of the boundary conditions.
2.2. Simulation of photoelasticity using the finite element method
As it is depicted above, the polarising filter images gained within experimental examinations can neither be used to determine the magnitude of the individual stress components nor is it possible to estimate inner stress conditions as the resulting retardation only represents an integrative quantity, composed via the glass pane thickness. In other words, the optical retardation does not allow any conclusions to be drawn about the individual stress components in the glass. Any information about the height and orientation of the stress components is lost during the transmission of the light through the glass body (Deuschle 2005).
To get more information about the individual stress components over the glass pane thickness, the concept of experimentally generated photoelastic images and measured retardation values needs to be expanded by comparison with simulated polarising filter images. These virtual calculated photoelastic images are based on the results of the commercial finite element simulation programs ANSYS Classic (Version 18.2) and ANSYS Workbench (Version 2019 R2). For the numerical simulation, volume elements are used to model the structural components, since it is desired to obtain information about the stress state in all three spatial directions. Even though this involves a much higher calculation effort compared to the 2D case, it is indispensable for the following evaluation.
Fig. 2 shows the essential process steps for generating the simulated polarising filter images by means of finite element analysis. First, the numerical model is created under consideration of prevailing boundary conditions. Subsequently the structural component is calculated based ona reference force, which can correspond, for example, to a maximum force determined within the experiments on which the comparison is based. As will be shown later on, there is a linear relationship between load level and optical retardation, which is why results can be interpolated or extrapolated linearly sufficiently accurate.
It should also be mentioned that the selected meshing structure influences the calculation process in particular. Local mesh refinements are therefore carried out especially in those areas, where stress concentrations can be expected (e.g. areas close to boreholes). The resulting stress data is then processed node-based and exported. Depending on the selected mesh size and the associated high number of elements, this can be a relatively time-consuming process. Therefore, the data is exported unsorted, so that efficient sorting algorithms of MATLAB (Version 2018b) can be used afterwards to process the data in short time.
Subsequently, a virtual polarising filter image is calculated from the processed stress data with the aid of analytical photoelastic fundamentals. Accordingly, it is assumed that in the optical setup of a polariscope, the optical retardation s is recorded as a measured quantity, directly influenced by the prevailing state of stress. The corresponding mathematical relationships are based on the model for optical retardation according to (Pathak 1999; Deuschle 2005; Deuschle 2006; Babu 2006) and are shown in Fig. 2.
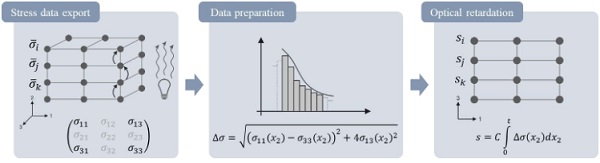
As it is mentioned in Chap. 2.1, the stress components perpendicular to the direction of the transmitting light as well as their corresponding shear stress are relevant for the calculation of the resulting optical retardation. These values are exported for each node and sorted according to their geometric coordinates. The decisive approach for the following work steps lies in the methodical subdivision of the glass pane via its thickness t (spatial direction χ2 corresponding to Fig. 2) into a finite number of layers, dependent on the stress state, in which the transmitting light is successively influenced.
Therefore, the incremental stress differences Δσ are integrated over the glass thickness according to the formula shown in Fig. 2. Finally, the optical retardation can be calculated under consideration of the photoelastic constant C. A detailed description of the underlying sequence of steps can be found in (Schaaf 2018) and (Glaser 2019).
In this way, a two-dimensional virtual polarising filter image is obtained which describes the integrated optical retardation over the flat glass pane surface, based on a three-dimensional numerical simulation. The comparison of retardation values from real polarising filter images with qualitative statement withthe quantitative assessment of virtual polarising filter images ispossible. Furthermore, retardation values can be directly compared with the real polarising filter images via their geometric coordinates or with the aid of inserted paths. As a result, detailed conclusions about the actual state of stress present in the glass pane can be drawn.
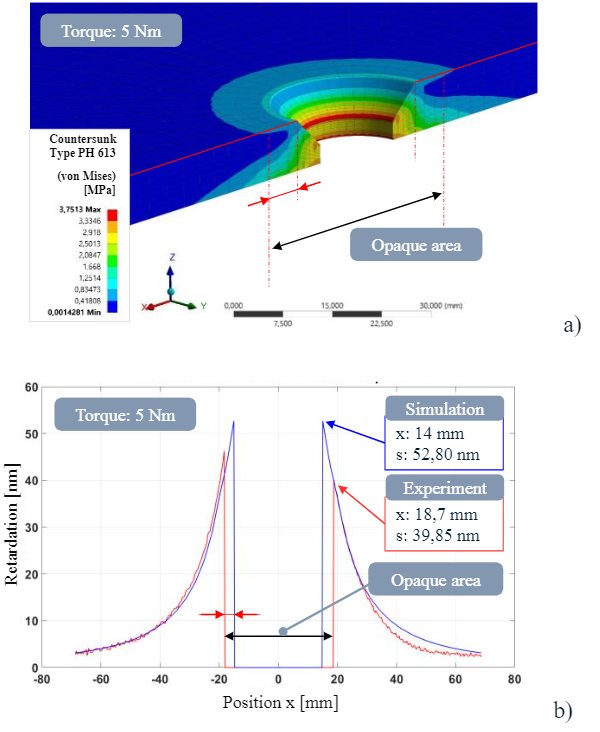
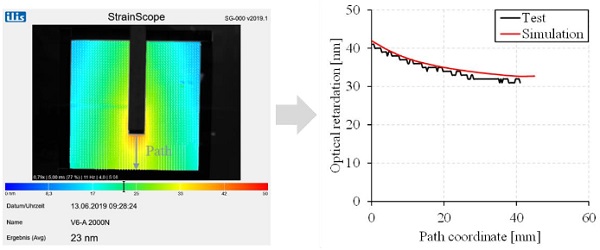
The possibilities arising from the described methodology are shown in more detail on the basis of the following example. In this case, a countersunk point holder of type Glassline PH 613 was subjected to a prescribed tightening torque of 5Nm. Among other variants, this type of point-supported mounting element is often used as a common solution, as they meet the aspiration and requirements of modern architecture to further increase the transparency with simultaneously sufficient load capacity and safety against failure. After load application, the resulting retardation was examined with a laboratory setup of a linear polariscope based on the principle of a StrainScope S3/180 by ilis GmbH, Erlangen, Germany.
As it is shown in Fig. 3, it is possible to compare retardation values of virtual as well as real polarising filter images, if the boundary conditions of the structural components are known. After calculation of the resulting load conditions, the retardation along the main axis may be specified and comparative superposition with experimental measurement data gets possible. It can be seen that the course of the virtual calculated values is very similar to the characteristic of the real retardation curve. A decreasing retardation as a result of creep effects of inner rubber materials was no specific subject of this investigation, but was carried out in other works (Glaser 2019).
During the life cycle of a build in glass, different kinds of influencing factors occur, depending on the used mounting system. Thereby the challenge is to derive the stress situations for each system with respective installation conditions and significant changes during the use phase. Possible influence factors that have been considered during the research project are tightening torques deviate from the specific value, uneven hardening of adhesives, ageing, creep effects and special part behaviourof the plastic components, to name just a few.
The presented results shown in Fig.3 therefore clarify a further advantage of this examination method as it gets possible to estimate the resulting retardation values and the correlating stress conditions in areas that are not observable with the optical method of photoelasticity like the shown countersunk area.
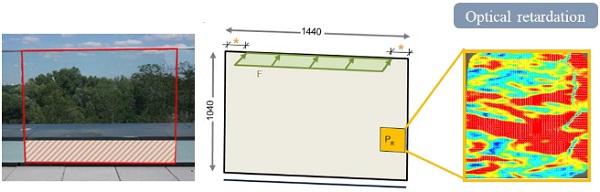
As another special feature, the application of the photoelastic measurement concept also allows to evaluate the influence of plastic interlayers within laminated glass as a result of external environmental influences and weather conditions. For example, the influence of moisture on the plastic interlayer, especially in the edge area of the glass composite, was also investigated. For this purpose, 500x300x8mm panes of the type Float-Float 44.2 were placed vertically in water to a depth of 50mm to continuously observe the photoelastic influence on the edge area over a total period of four weeks (photoelastic measurement results shown in Fig.4).
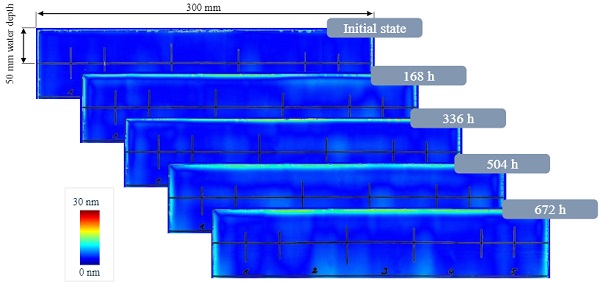
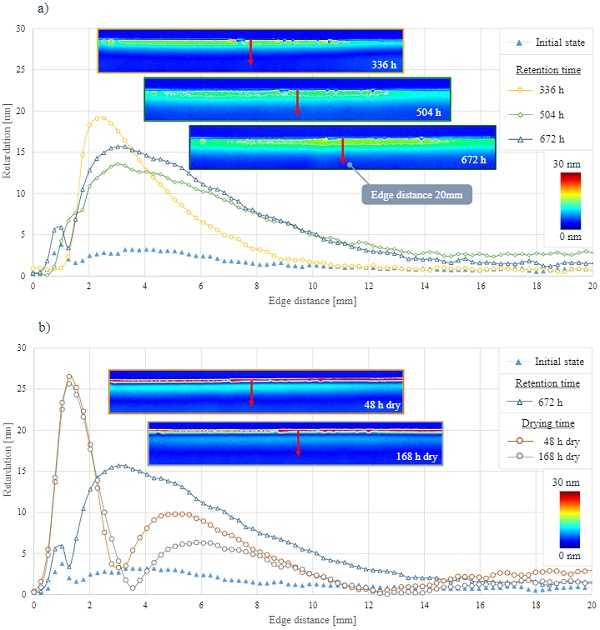
These experiments on water retention show that with increasing retention time, a significant increase of photoelastic influence can be detected at the edge region. The shown measurement curves in Fig. 5a) display the course of the measured photoelastic retardation along a measurement path orthogonal to the edge of the laminated pane. Over time of storage, the water increasingly penetrates the laminated pane and influences the photoelastic measurement.
Subsequently the course of the photoelastic influence as a function of the drying phase after a total storage time of four weeks is shown in Fig. 5b). A reduction in the residual moisture between the glass panes as a result of decreasing photoelastic influence can be detected after only 48 hours. However, the edge area (up to approx. 5mm from the edge) remains irreparably damaged and represents a weakening of the bond, which in reality would favour the further penetration of water, ice and dirt.
The possibility of investigating influenced edge areas in laminated glass represents a great potential of the planar photoelastic investigation on real installed glass panes and underlines the importance of the development of such a measuring device.
3. Mobile measuring device
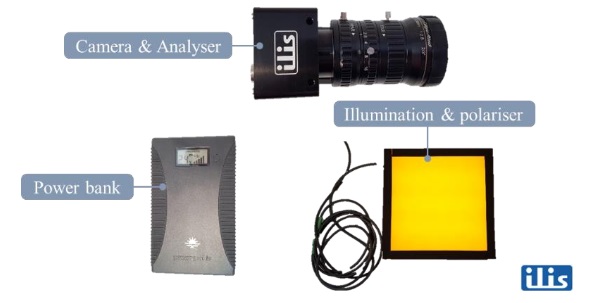
For mobile use at the building site, a device should be used which is optically decoupled, easy to set up and dismantle and, if possible, can be operated without external power supply. In particular,the limited accessibility for many types of fastening systems have to be considered. These requirements are met by a new type of decoupled measuring system from ilis GmbH, Erlangen, Germany.
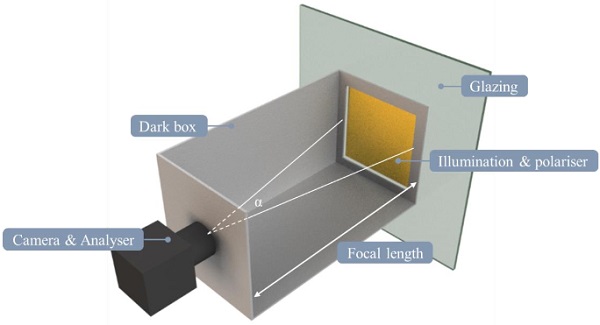
The setup of the system is shown in Fig.6. The main components of the system are an illumination unit with built-in polariser, which can be supplied with power via a power bank, and a camera with built-in analyser, which is operated with a laptop due to the control and analysis software. The camera is supplied with the power necessary for operation via the connection to the laptop. Thus, the mobile measuring device canbe operated without an external power source. This allows flexible use even on components without a nearby power supply. The camera is always positioned with a tripod, ensuring a proper alignment.
The illumination unit can either be placed directly on the glass with a vacuum lifter or with a tripod. Slight misalignments are automatically corrected by the software. Since circularly polarisedlight is used instead of linearly polarised light, the rotation of the camera or illumination unit around the direction of illumination causes nearly no measurement errors as long as the components are aligned parallel to each other. This measuring device is used to perform measurements on real objects. In order to test the method as well as to ensure the handling of the device and the reproducibility of the results, laboratory tests are first carried out under defined boundary conditions.
4. Laboratory tests with mobile measuring device
In the first step, a large number of laboratory tests were carried out to test the mobile measuring device. The main focus was on in-and out-of-plane loading of the bonded and mechanical connecting systems. In the following, results of the laboratory investigations will be presented and compared with numerical simulations.
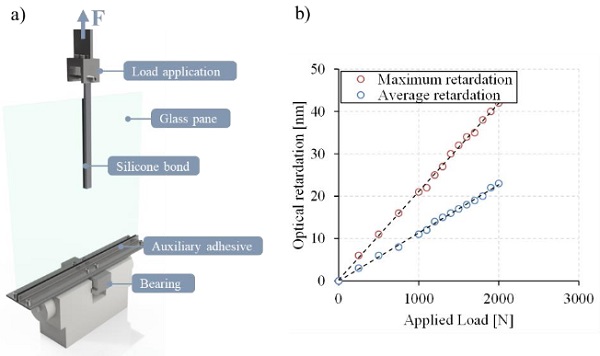
A shear load of a typical SSG bond according to (EOTA 1998) is studied. For this purpose, an appropriate test setup was designed to apply this load to the bond using a uniaxial testing machine (Zwick Z100). Several bonded test specimens made of float glass with the dimensions 500 x 500mm² and different thicknesses were prepared. The dimension of the silicone bond was 250 x 20 x 7mm³ for all specimens. Normal to the load direction, the body is irradiated with circularly polarised light emitted by the illumination panel of the mobile measuring device.
The camera module with built-in analyser is placed on the other side of the glass pane. The size of the optical measuring field is 400 x 400mm². The test setup is shown in Fig. 7a). The optical measuring unit provides a continuous monitoring of the stress state in the glass caused by the shear load. The tests were conducted with displacement control at a speed of 5mm/min. Up to a load of 1000N a polarising filter was generated every 250N, then up to a load of 2000N every 100N. To evaluate the optical retardation the software StrainScope 2019 by ilis GmbH was used.
StrainScope allows a multitude of adjustment options and evaluation methods and is continuously updated and further developed by ilis GmbH. All results can be transferred to other programs for further use via an appropriate interface. A linear relationship can be found between the applied load and the measured optical retardation for any location within the optical measuring field.Fig.7b) shows this relationship in terms of the maximum value measured and the average value of the overall optical measuring field. With knowledge of the boundary conditions of the bonding as well as the glass, it is possible to draw conclusions about the load level in the glass and the bonding by evaluating the optical retardation.
For the accurate analysis of the stress state in the glass, however, the use of a numerical simulation model is indispensable. For this reason, corresponding numerical models were provided using ANSYS and virtual polarising filter images were generated using the method presented in Chap.2.2. In general, any finite element program can be used for the supporting simulations. However, it is important that the components can be modelled using solid elements. Numerical investigations have shown that the use of shell elements can lead to considerable differences in the calculation of virtual polarising filter images.
Fig. 8 exemplarily shows the comparison between the recorded optical retardations in the experiment and the virtual calculated optical retardations of the simulation. A very good accordance can be found, here presented as a path analysis at the lower edge of the adhesive layer where the highest optical retardations occur. The very good agreement between experiment and simulation is achieved for all shear tests, regardless of glass thickness or load level.
5. Tests on real structural components
5.1. Implementation and evaluation
In order to test the mobile measuring device with respect to its usability and evaluation of measurement results, numerous construction elements have been analysed. Within the research projectnon-destructive tests (measurements) were carried out on real objects using the mobile measuring device.
Thereby the functional efficiency as a mobile device was examined in particular with regard to measuring accuracy and sensitivity even after repeated assembly and disassembly. Furthermore, the limits of use of the mobile device have been demonstrated. The extensive experience allowed a statement on the robustness of the measuring system and the reproducibility of the measured values.
The examined constructions were selected in such a way, that as many different boundary conditions as possible could be taken into account. The examined glass products varied (laminated safety glass, insulating glass units, mono-panes, annealed glass, thermally toughened glass) and the bearing arrangements were deliberately chosen differently in order to achieve a high significance of the measurements (linear bearing arrangements in facade and window systems, linear bonded joints, point fixed glass panes).
The measurements and their analysis were carried out with particular consideration of the following aspects:
- Applicability/handling of the software on the construction site/at the object
- Flexibility with regard to the use on different facade or glass constructions
- Preparation of the measurement results: fast recognition of the relevant parameters, presentation of the optical retardation
- Reliability of the measurement results – detection of errors and inaccuracies
- Interpretation of measurement results
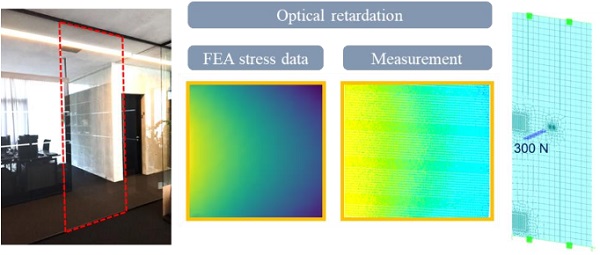
Fig. 9 shows exemplary one test setup realised on a real construction element. Within the test a two-side beared glass pane, consisting of laminated annealed glass has been loaded by a defined punctual load in the center of the glass pane, in order to consider the measured retardation. The aim was to reproduce the constraints of the glass pane by evaluating the optical retardation. Therefore, the system has been analysed by finite element methods and the resulting FEA stress data has been compared with the measurements. A good conformity has been detected (see Fig.10).
![Fig. 9 Test setup of a real construction element (two-sided beared laminated glass) and external loading, geometry in [mm].](/sites/default/files/inline-images/Fig9_61.jpg)
Nevertheless, as expected, actually the limit of the measurement method has been determined especially with regard to thermal toughened and heat strengthened glass. As seen in Fig. 11 the influence of the surface stress caused by thermal prestress doesn’t allow to eliminate constraints caused by external loads. Further investigation, especially on evaluation methods, are required.
5.2. Improvements on the device and the process of measurement
Tests on real structures unveiled some issues that could be fixed to some extent by modifications on the assembly of the components and the procedure. A dark box prevented flare light and reflections. The analyseris fixed to it, so the focal length corresponds to the depth of the box. Hence, the adjustment of the viewing angle for each measurement is no longer required.
Fig. 12 shows the used schematic assembly. Measurements can be carried out considerably faster and the dark box protects the lens of the analyser. There is no need for a tripod anymore because the dark box with analyser can be held by hand to the glazing. A further upgrade would be suction cup mounts for both illumination unit and dark box. These would allow a single person to carry out the measurements.
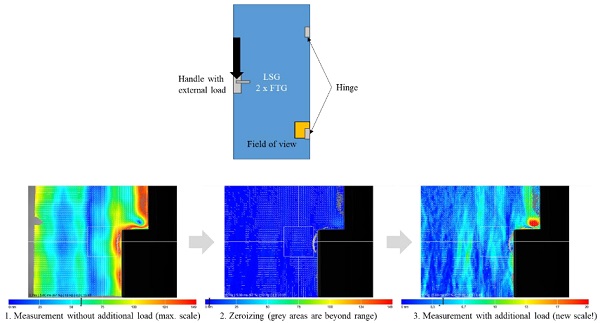
Measurements of thermal toughened or fully tempered glass always result in pronounced retardation figures (e.g. refer to Fig.11) that are caused by anisotropy. Their absolute values of retardation often exceed those caused by external loads. Hence,it is proposed to zeroize the analysing device after the first (unstressed state) measurement.
In a second step an external load has to be applied and measurement is repeated without moving the assembly referred to the first measurement (suction cup mounts, see above). The retardations of the second measurement now give a clearer sight of the (external) stresses in the glass. By now, this approach is limited to the analyser’s range of measurement as anisotropies claim the majority of it (refer to Fig.13).
For a quick assessment of the determined retardation image it would be helpful, if the corresponding retardation plot could be determined directly in the FEM-analysis program. Especially as most high stressed glass applications are made of pre-stressed glass, the procedure with setting the retardation to zero after arranging the measurement setup and applying an additional load afterwards is the most relevant. In these cases, usually different load scenarios and load steps are applied and an easy “post-processing” would help for an in-situ assessment. These and other requirements as well as challenges will be further investigated in following projects.
6. Summary and Outlook
The material glass is characterised by specific material properties. Particularly because of its brittleness, failure does not appear slowly but suddenly and usually with no prior evidence. Until now, it is only possible to perform a subsequent damage analysis by visual inspection. Within the research presented in this article, the approach of the combined application of two methods was followed.
Firstly, the application of photoelasticity on build in glass panes in a mobile way was examined. An isolated consideration of the optical retardation allows only limited interpretability, where an unambiguous statement on the state of stress over the glass pane thickness, which could be composed of a multitude of possible combinations of the occurring stress components, is only conditionally possible.
Therefore, the combined application of photoelastic analysis and finite element simulation was used to compare experimental results and virtual calculations. The comparison of simulated and experimentally generated polarising filter images allows a qualitative assessment of the numerical calculations and makes it possible to qualitatively assess the stress conditions of build in glass panes.
Using the presented mobile measuring deviceit is possible to evaluate the state of stress not merely on a point basis but a rather larger critical area of a built-in glass pane. Therefore, it ispossible to predict critical overloads and prevent damages by taking counter measures beforehand. This enables to measure and monitor occurring load states during the installation process, as well as the utilisation of glass components subjected to significant load changes during their life cycle.
By monitoring the glass, it is also possible to draw conclusions about the load on the joint, e.g. a bond. In addition to monitoring of stresses it is shown that also water ingress into laminated glass could be detected by photoelasticity. Aqualitative assessment of transparent facade elements, panes or railing elements in a mobile way is enabled, so that this is the base for extensive monitoring and prognosis concepts. However, an increase in the measuring range is still necessary for proper use with tempered glass products.
Moreover, it is also possible to use the described method for measuring stresses in defined tests of glass components. Where strain gauges only allow a punctual evaluation of stresses, photoelasticity and the related simulations could be used to obtain measurement data over a large area. Thus, knowledge of the location of the maximum stresses would not be necessary in advance in order to place a strain gauge precisely. With a sufficiently sized measuring field, large areas could be easily covered. For this purpose, however, sufficient space has to be taken into account in order to arrange the hardware accordingly.
7. Acknowledgements
This work was developed within the framework of the research project "Development of a mobile device as a functional model - consisting of hardware and software - for evaluating the current in situ stress state in glass BiGla” (AiF 2017) funded by the German Federal Ministry of Economics and Energy within the framework of the "Zentrales Innovationsprogramm Mittelstand" (ZIM). The authors would like to thank the funding agency. Furthermore, we would like to thank ilis GmbH, Erlangen, Germany, for the pleasant cooperation.
8. References
AiF ZIM Projekt: Entwicklung eines mobilen Gerätes als Funktionsmuster –bestehend aus Hard-und Software –zur Bewertung des aktuellen In situ -Spannungszustandes im Glas –BiGla, funded by the German Federal Ministry of Economics and Energy, ZF4075115AG6 (2017)
Babu, P., Ramesh, K.: Development of photoelastic fringe plotting scheme from 3D FE results. Commun.Numer.Methods Eng. p. 809 –821(2006)
Deuschle, H.M., Wittel, F.K., Kröplin, B.-H.: Simulation von Spannungsoptik im Rahmen der FEM, 17. Deutschsprachige ABAQUS-Benutzerkonferenz, Nürnberg. (2005)
Deuschle, H. M. et al.: Investigation of progressive failure in composites by combined simulated and experimental photoelasticity. Comput. Mater. Sci.38, p. 1-8 (2006)
EOTA: ETAG 002 - Guideline For European Technical Approval For Structural Sealant Glazing Kits (SSGK), 1040 Brussels, Belgium (1998)
Föppl, L., Mönch, E.: Praktische Spannungsoptik. Springer-Verlag Berlin, 3. Edition, ISBN 978-3-540-05534-1 (1972)
Feldmann, M., Kasper, R., Di Biase, P., Schaaf, B., Schuler, C., Dix, S., Illguth, M.: Flächige und zerstörungsfreie Qualitätskontrolle mittels spannungsoptischen Methoden, Glasbau 2017, p. 327-338,Ernst und Sohn Verlag, Dresden(2017)
Glaser, M., Hildebrand, J., Bergmann, J. P. et al.: Flächige Bewertung des Spannungszustandes an Baugläsern mittels Spannungsoptik. Glasbau 2019, Ernst und Sohn Verlag, Dresden (2019)
Hildebrand, J., Werner, F.: Experimentelle Ermittlung der spannungsoptischen Konstante für Glas und Kunststoff mittels bildgebender Messmethode, Werkstoffprüfung 2010, 02. -03. Dezember 2010, Neu-Ulm, p. 401–406 (2010)
Pathak, P. M., Ramesh, K.: Validation of Finite Element Modelling Through Photoelastic Fringe Contours. Commun.Numer.Methods Eng.p. 229-238(1999)
Schaaf, B., Di Biase, P., Feldmann, M., Schuler, C., Dix, S.: Full-surface and non-destructive quality control and evaluation by using photoelastic methods, Glass Performance Days 2017, Proceedings, Tampere, Finland (2017)
Schaaf, B., Abeln, B., Richter, C., Feldmann, M., Glaser, M., Hildebrand, J., Bergmann, J.P., Baitinger, M., Reshamvala, M., Tsaklakidis, M. and Siebert, B.: Development of a mobile device for the evaluation of the current in-situ stress condition in glass –Experimental and numerical analysis for bonded and mechanical joints. Engineered Transparency 2018, p. 557 –566. Berlin, Ernst und Sohn Verlag(2018)
Winter, E., Hildebrand, J.: Anwendung derspannungsoptischen Messmethode bei querkraftbeanspruchten Punkthaltern. Bauhaus-Universität Weimar, Weimar (2014)