Source: Glass Structures & Engineering
Authors: Maximilian Möckel, Matthias Seel, Gregor Schwind & Michael Engelmann
DOI: https://doi.org/10.1007/s40940-025-00296-1
Abstract
High temperatures, especially non-uniform temperature distributions, on glass structures can induce stress relaxation, viscous material behaviour and glass fracture. Temperature exposure of toughened glass to 290 °C and above can result in a partial reduction in strength of the glass component and, in case of fracture, a change in the fracture pattern due to stress relaxation. To achieve a better understanding of the heat transfer in monolithic and laminated glass, test series in an electric furnace on different glass specimens were carried out. The specimens were made of two compositions, namely monolithic or laminated made of soda-lime silicate glass in a variety of thickness. The test set-up was chosen in a way to create an inhomogeneous temperature distribution from the heat source through the glass in order to create a more realistic load case than an assumption of homogeneity. The results of the experimental examinations were used to develop a first numerical model that was used to visualise details (e.g. temperature and stress distribution). The paper presents results of experimental and numerical examinations to the determination of the temperature and stress distribution in different glass compositions and experimental examinations of the stress relaxation during high temperature exposure and effects on fracture pattern in thermally toughened glass plates. This will pave the way towards understanding glass structures exposed to heat and fire and, as a vision, will form the fundamentals of a design concept.
1 Introduction
High temperatures in glass, particularly when combined with mechanical loads, can cause stress relaxation, viscous material and component behaviour, loss of strength, glass breakage, and ultimately, loss of structural integrity (loss of load-bearing capacity and residual load-bearing capacity). Glass structures and products are often subjected to high temperatures during manufacturing processes, such as chemical and thermal toughening, heat soak tests, vacuum insulation glass production, and photovoltaic thin-film production, as well as in the event of a fire. The complexity is further increased by inhomogeneous temperature fields, which can be caused by localized temperature effects or multi-layer glass components, such as glass beams. The evaluation of the load-bearing capacity and post fracture load-bearing capacity of glass structures at temperatures above 100 °C depends on several significant variables.
These include the homogeneous and inhomogeneous temperature and pre-stress distribution throughout the structure, the temperature and time-dependent deformation behaviour, and bonding behaviour of the individual layers with each other, as well as the fracture pattern morphology and their distribution. Analysis of highly thermo-mechanically stressed glass structures is currently challenging due to the non-linear material behaviour of the glass and the interlayer material. Reliable assessment and design can only be achieved through complex and costly component tests. The evaluation of glass structures requires a fundamental and systematic analysis of the influencing parameters and causal mechanisms of highly thermo-mechanical effects. The topic of understanding temperature distribution and induced stresses in glass, as well as stress relaxation in prestressed glass under high thermo-mechanical stress, is currently in our focus of research.
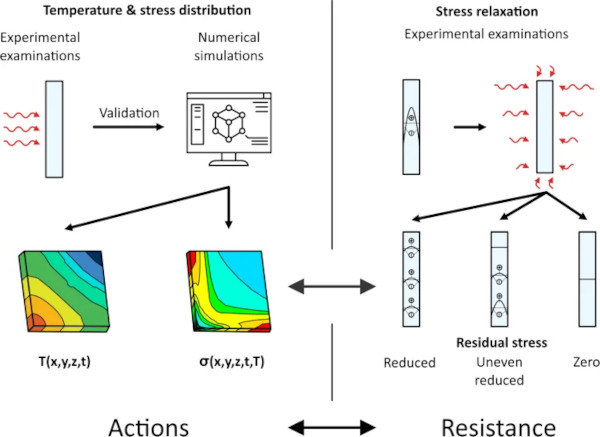
The main objective of the research is to design a model for estimating the fire and post-fire load resistance of structural glass elements including the residual stress distribution. As a long-term vision: this will be achieved by using a validated calculation method. The objective of the examinations presented here is to provide an initial data base for the validation of thermo-mechanical simulation models in an initially reduced temperature range. The temperature results in residual stress relaxation, which is largely unknown above 371 °C (Glass Association of North America 1986) or 400 °C (Schneider et al. 2016a, b). This can lead to a change/reduction in strength and fracture pattern. The experimental and numerical examination of the temperature and stress distribution represents the action on the glass, while the experimental examination of the stress relaxation in dependence of the temperature represents the resistance of the glass.
Both design values—stress and strength—depend on the temperature–time relationship and are essential for the design process of glass structures under high temperature exposition. This interaction between temperature (including radiation) and stress development as well as the reduction of the glass strength due to stress relaxation requires a combined approach/ perspective. Figure 1 illustrates the interaction of these two areas and the objectives of this article. This paper comprises an experimental and numerical examination of the actions and the resistance, independently of each other. The subsequent development, combination and comparison of the findings from these examinations will be a pivotal aspect of further research.
2 State of the art
2.1 Heat flux through glass and fracture behaviour
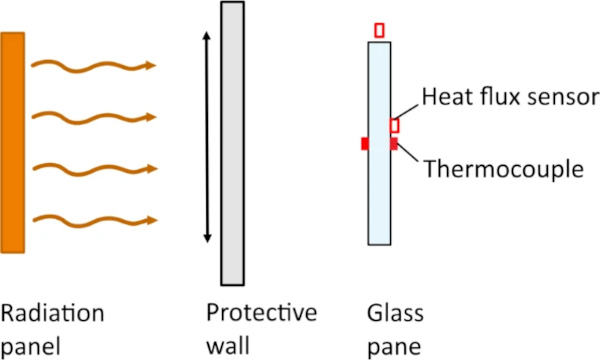
There are three types of heat transfer in thermodynamics: radiation, convection and conduction. The determination of heat flux includes all three types. It is important to distinguish between different types of material. Due to the physical nature of glass, convection within the glass volume can be disregarded. Consequently, within the glass only radiation and conduction are considered. However, convection outside the glass pane must be accounted for. Previous research has experimentally examined the heat flux through glass. Ahmad and Javed (2016); Debuyser (2015); Debuyser et al. (2017); Honfi et al. (2022); Kunkelmann (2013); Jorgensen et al. (2018); Jorgensen et al. (2022) examined the heat flux through glass panes and the fracture behaviour in dependence of the temperature of different compositions (monolithic and laminated) and thicknesses. In all tests the glass panes were mounted on all four sides of a frame and exposed to a gas-driven predetermined distance. The panel was heated by a defined power. The protective wall separating the test specimen and the panel was removed, exposing the glass pane to the heat radiation of maximum 15 kW/m2 (Fig. 2). The temperatures on the side facing away from the energy source and towards the heat, as well as the heat flux density behind and next to the test specimen, were measured during the tests.
Furthermore, (Yang et al., 2018a) and Wang et al. (2023) examined the temperature gradients within small-format glass panes (100 mm × 100 mm) in a cone calorimeter and their fracture behaviour under uniform and non-uniform heat exposure. The outcome of the experiment demonstrated that annealed glass breaks at a lower temperature gradient than fully tempered glass. Furthermore, the temperature gradient was found to be higher in the thickness direction than in the lateral direction when exposed to homogeneous heating. In addition, the temperature gradient in the lateral direction was found to be higher than in the thickness direction when additional shading was applied to the edge area. In both tests, the fracture origin of the test specimens was consistently located in the edge area. In both papers, the tests were accurately represented by a numerical model, which was subsequently validated with the test results. Furthermore, the numerical model of Yang et al. (2018a) was further developed and refined in Yang et al. (2018b). The results of the aforementioned tests can only be extrapolated to reality to a limited extent due to the small size of the test specimens. Furthermore, only monolithic, annealed glass was utilised.
2.2 Deformation behaviour under fire load
According to EN 1990 (2021), fire is an accidental action. Design models for glass in the event of fire are missing in the current state of the Eurocode 10 (CEN TS 19100-1; CEN TS 19100-2; CEN TS 19100-3) and in the standards for the fire behaviour of construction products and building elements EN 13501-1 (2019) and EN 13501-2 (2016). The distribution of temperature in glass during a fire is a complex phenomenon that depends on various boundary conditions, such as the component’s dimensions, positioning in relation to the fire, and the type and size of the fire. Previous research, as described below, is insufficient to validate a numerical model that accurately describes the mechanisms involved in this process. Due to the transparency and solid state of glass, the material heats up both by absorbing radiation and by heat conduction. The relative contribution of each process is influenced by a multitude of external factors, resulting in a range of possible outcomes across different applications. Therefore, it is not possible to define a generalised load case. Due to a lack of understanding regarding the mechanisms of temperature distribution in glass and its behaviour under high thermo-mechanical loads, it is currently not possible to establish general design principles or determine necessary safety factors.
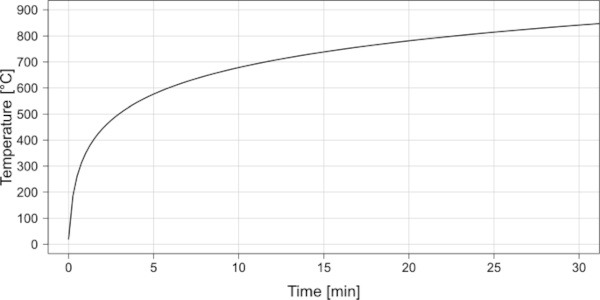
The temperature development during a fire is generally determined using a standard temperature–time curve (STC) in accordance with EN 13501-2 (2016) (Fig. 3). The STC delineates the temporal evolution of the air temperature proximate to the component during a fire. It is important to note that STC reaches the transformation temperature of glass, which is approximately 525 °C for soda-lime silicate glass (SLG), within approximately 5 min. However, it is unclear when this temperature is reached inside the component due to its design. The viscosity of the glass decreases with increasing temperature and causes the material to soften. Critical orders of deformation occur, which are safety-relevant but cannot be determined with certainty at present.
Research on the load-bearing behaviour of glass under thermo-mechanical stress or fire load was conducted by Veer et al. (2001) and Bokel et al. (2003). The study examined glass beams with dimensions of 400 mm in length and 40 mm in height. Both monolithic (6 mm) annealed panes and chemically toughened SLG beams laminated with polycarbonate (three glass panes and two polycarbonate layers) were tested. The samples were loaded in four-point bending while being exposed to a constant flame of a gas torch with a temperature of approximately 650 °C between the inner bracings (see Figs. 3 and 4 in Veer et al. (2001)). The temperature was measured in front of the flame and in the back of the glass beam.
The tests demonstrated that chemically toughened glass and laminated glass exhibit 15–20 times greater fire resistance than annealed monolithic glass. These results indicate that the use of thermally or chemically toughened glass and protective layers of fire-resistant, intumescent materials can significantly enhance load-bearing capacity during the event of fire. The tests and research described below are only preliminary and therefore not statistically relevant due to the limited number of test specimens analysed and the test setups used.
Heinemeyer et al. (2014) conducted experiments to examine the fire behaviour of overhead glazing. Laminated glass panes made of SLG were placed on all four sides of a box and clamped in the corners with point fixings (see Figure 3–1 in Heinemeyer et al. (2014)). A burner was used to expose the inside of the box to flames. Temperature measurements were taken on both sides of the glass pane during the tests. Bubbles formed in the lowest interlayer when the temperature on the side facing the fire reached approximately 290 °C. The test was terminated when the glass pane facing the flame broke, which occurred between 480 and 530 °C. These examinations offer an initial understanding of the behaviour of laminated safety glass when exposed to fire. However, a fundamental understanding of the temperature behaviour of laminated safety glass (LSG) requires further in-depth investigations. Heinemeyer et al. (2014) noted that although the test setup used represents an installation condition, the heating rate used varies greatly from 20 to 160 K/min and is not comparable to the STC (Fig. 3).
Bawa et al. (2014) present the basics of highly thermo-mechanically stressed glass structures and the underlying requirements for structural fire protection. In addition, the authors describe a numerical model and a first experimental test on the behaviour of a load-bearing glass structure under fire exposure (see Fig. 5 in Bawa et al. (2014)). As a result, the specimen failed after about 6 min of fire exposure. The authors conclude that fire is a complex topic in glass construction, requiring a substantial body of experimental and theoretical knowledge to fully comprehend it, particularly in the context of load-bearing glass. Furthermore, Nodehi (2016) presents further fire tests with monolithic glass panes in both horizontal and vertical position heated from one side inhomogeneous and from alle sides homogeneous (see Figure 5.84 in Nodehi (2016)). Only monolithic test specimens of one dimension of 1.5 m in length and 0.3 m in height and a single thickness of 10 mm were used including six panes of annealed glass, two panes of heat strengthened glass (HSG) and two panes of fully tempered glass (FTG), all made of SLG. Seven of which were tested under dead load only. Three panes were additionally loaded mechanically. All tests were carried out with the STC. The aim was to examine the behaviour of the glass panes in the event of fire at different levels of tempering and mechanical loading. As a result, annealed glass broke and fell after maximum 3 min of exposure to fire. HSG and FTG, on the other hand, withstood temperatures of up to 550 °C without fracture. Beyond that temperature, the material changed to a visco-elastic state and the components fell out of the supports.
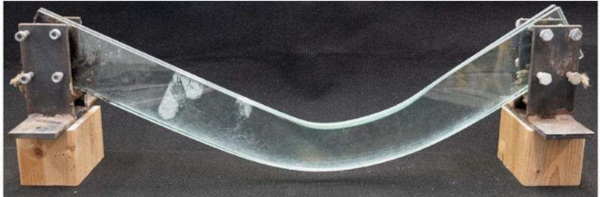
Different researches (Louter et al. 2021; Möckel et al. 2022; Sturkenboom 2018) carried out four-point bending tests under fire exposure and mechanical loading on laminated SLG glass beams made of annealed glass, HSG and FTG with dimensions of 1000 mm length and 100 mm height (Fig. 4), extending the results of Louter and Nussbaumer (2016). The objective of the tests was to evaluate the fire resistance of the glass beams based on the level of prestress. To assess this, the deflections of the glass beams were measured during the tests. Thermocouples were embedded in the centre of the laminated safety glass specimen to measure the internal temperature of the structure.
A significant difference between HSG and FTG or PVB (polyvinylbutyral) and SG (SentryGlass®) regarding the time of failure or the failure temperature was not recorded. However, the investigation revealed that the core temperature of the beam exerts the most significant influence on the failure time. The test results of Möckel et al. (2022) and Sturkenboom (2018) show that glass beams made of this specific glass composition and dimensions cannot achieve the target of fire resistance class R30 according to EN 13501-2 (2016b). Therefore, they may pose a safety risk in case of a fire. The tests indicate that lateral-torsional buckling cannot be ruled out, even with a component height of only 100 mm. This is due to a reduction in the lateral-torsional buckling resistance caused by a significant drop in the modulus of elasticity and shear modulus.
Bedon (2017) summarises the current research on glass structures under fire load, while Ensslen et al. (2023); Galuppi et al. (2023) and Schwind et al. (2022a, b, 2023) provide an overview of the current state of research on glass in construction under climatic actions and fire load. All publications mentioned highlight the current gaps in research. Currently, there are no clear normative regulations on the fire behaviour, fire resistance, and general thermo-mechanical behaviour of glass, particularly load-bearing glazing. The authors note that current regulations regarding fire protection in structural glass are often formulated in general terms and are not tailored to the specific application in glass construction EN 1365-3 (2000). Thermally induced stresses during a fire have not been thoroughly examined.
The research conducted by Li and Wang (2024) examined the fracture behaviour of annealed glass and fully tempered glass when subjected to fire. The monolithic glass panes (815 mm × 815 mm) were mounted in a frame with shading in the edge area and exposed to a fire. In order to examine the influence of the position of the fire on the failure of the pane, the position of the fire was changed in the laboratory oven. The results demonstrated that the position of the fire significantly influenced the temperature distribution in the oven and the glass pane, as well as the time until failure. A maximum temperature gradient of approximately 400 °C was recorded on the glass. The fire tests were numerically simulated using an FDS model. The results were subsequently validated by experimental results. The experiments demonstrate the complexity of the fire and its impact on the glass. The results provide a solid foundation for further experimental and numerical examinations. Nevertheless, the present study did not examine the fire behaviour of load-bearing glass.
The experimental examinations presented in this chapter focused on the performance of monolithic and laminated glass panes. Nevertheless, the heat-related stresses that occured in the glass are only mentioned briefly but not examined thoroughly. The examinations presented in chapters 3 and 4 are intended to provide an initial approach to understanding thermally induced stresses during inhomogeneous heating of glass. Furthermore, the specimens from the tests were not analysed for thermal prestress conditions, which was most certainly reduced by the heat input. The aspects relating to the reduction of prestressing in glass are presented in general terms in Sect. 2.3 and are investigated experimentally in chapter 3.4.4.
2.3 Stress relaxation in thermally pre-stressed glass
In simplified form, glass is an amorphous solid below glass transition temperature TG (525 °C for soda-lime silicate glass—SLG) and viscous above TG. Above the working point (Tw, SLG 1030 °C), glass can be deformed very well under load without breakage, as the viscosity is sufficiently low. The material behaviour of glass in the range of TG ± 150 °C is viscoelastic (Schneider 2001). Stress relaxation of thermally pre-stressed glass, like heat strengthened glass (HSG according to EN 1863-1 (2012) and fully tempered glass (FTG according to EN 12150-1 (2020), occurs at high temperatures but still below TG. The desired surface compressive pre-stress of thermally pre-stressed glass and thus also the strength is reduced at temperatures above 290 °C depending on the temperature exposure time (Schneider et al. 2016a) due to relaxation mechanisms in the glass. The relaxation mechanisms (named as stress relaxation in the paper) in the viscoelastic area are shear, volume and structural relaxation. Investigations on heat-treated FTG in Schneider et al. (2016a) show that the surface compression pre-stressing is reduced by approx. 5% to 10% (at 290 °C for 24 h).
At higher temperatures, the residual stresses are reduced to a greater extent due to the viscoelastic material behaviour (Glass Association of North America 1986; Schneider et al. 2016a). In the study by Schneider et al. (2016a), the effects of subsequent homogeneous temperature treatment on the fracture pattern of FTG were also investigated. A reduction in the fragment density was clearly recognisable for the specimens (FTG, 140 × 150 × 4 mm3) with an additional heat treatment at a temperature of 290 °C (holding period 4 h) and can generally be explained by the thermally induced stress relaxation. Further investigations were performed in Glass Association of North America (1986) with FTG up to 371 °C. In the case of fire or other design cases, higher temperatures can occur and the holding duration is shorter or non-existent. The investigations presented in this paper are intended to be conducted at higher temperatures and short holding times of 30 min in order to investigate stress relaxation and its effect on the fracture pattern.
2.4 Numerical simulation of temperature and fire tests
The experimental tests on heat flow, mentioned in Debuyser (2015) and Debuyser et al. (2017), were numerically mapped in the respective papers and taken up in Kozłowski et al. (2018). The calculations were extended to include the calculation for three-sided loading (load on the glass edges), and the inhomogeneous heating due to partial insulation. However, these extended calculations for the experimental investigations were not experimentally validated. Furthermore, a numerical model (1D) was validated using the results from Debuyser (2015) and Debuyser et al. (2017) in Bedon et al. (2018). It was thus determined that a 1D model can only be used for an initial estimation. 2D and 3D simulations are capable of mapping the complexity more effectively. Honfi et al. (2022) numerically simulated the experimental tests mentioned above, validating all models up to a temperature of 350 °C. To gain a deeper understanding of the temperature distribution in the glass, it is necessary to examine the temperatures around its transformation range. In previous research studies on the thermal properties of soda-lime silicate glass, changes in the specific heat capacity (Musgraves et al. 2019), the modulus of elasticity (Rouxel 2007) and the coefficient of thermal expansion (Nodehi 2016) have been observed in this range.
The fire tests on horizontal glass panes carried out in Nodehi (2016) were analysed in Bedon and Louter (2018), numerically modelled, extended by a parametric model and compared with the experimental data. The examinations revealed that the load-bearing capacity of glass under fire load depends on many factors such as glass thickness, glass composition and distance of the fire. However, further experimental tests are required to obtain more detailed results.
Kozłowski and Bedon (2021) present numerical models for temperature distribution in glass under fire exposure. The models were applied to square glass plates with partial insulation in the form of a support structure, which were loaded from below with the STC. The analyses indicate that the material temperature exceeds the thermal shock resistance of annealed glass (40 K, EN 572-1 2016), HSG (100 K, EN 1863-1 2012), or FTG (200 K, EN 12150-1 2020) after just a few minutes. Exceeding the permissible values may cause glass breakage. However, these calculations have not been validated by experimental tests.
Hassan et al. (2023) present a study on the influence of interlayer materials on the fire behaviour of laminated glass. Small-scale tests were conducted using a cone calorimeter to determine the fire behaviour of the laminated films and the glass. The results of the tests are comparable to those of a single burning item test in accordance with EN 13823 (2020) and can therefore be visualised on a much smaller scale.
3 Examination of temperature transfer through glass and thermally induced stresses
3.1 Approach
Experimental examinations were conducted using a laboratory oven (model: linn elektro therm lk 312.11) to understand the temperature distribution within monolithic and laminated glass panes. The oven is equipped with electric heating wires on two sides and the top to generate radiation. There is no ventilation system included. Therefore, natural convection takes place inside. The oven has a maximum heating range of 50 K/min with a maximum temperature of 1400 °C.The results were then used to develop and validate a numerical model. As already mentioned, previous research has already conducted experimental and numerical examinations of glass panes under temperature load. The following experiments show the inhomogeneous heating of the glass panes, which can lead to stress peaks and glass breakage. In difference to the previous research the electrically powered radiation oven emits a different amount of wave length of temperature exposure as well as a natural convection inside the oven. A numerical model was developed to demonstrate this phenomenon (Fig. 5).
3.2 Specimens and test set-up
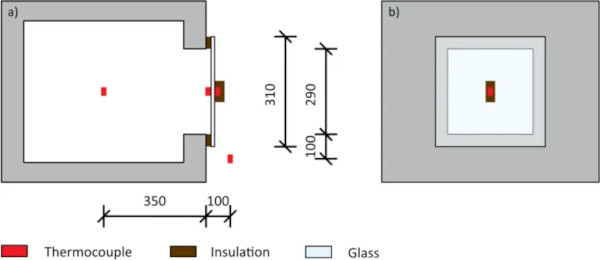
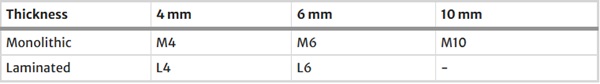
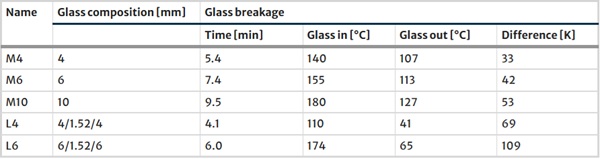
A temperature transmission test was conducted to determine the heat transfer through glass. The test specimens were square panes made of annealed glass out of SLG with an edge length of 310 mm and a polished edge (KPO). Table 1 provides an overview of the specimens. The laminated glass panes contained conventional polyvinylbutyral (PVB) film as the interlayer in a thickness of 1.52 mm (λ = 0.21 W/(mK), Kuraray 2024). The glass panes were fixed in front of a laboratory furnace with two aluminium plates (see Fig. 6) and exposed to a constant temperature increase. Figure 5 shows a schematic illustration of the test setup. The glass pane was supported by a square frame made of mineral wool with a support length of 10 mm. Consequently, the material was subjected to an inhomogeneous heating process.
The temperature was measured using Type N thermocouples placed at various locations including the centre of the oven, the centre of the inside and outside of the test specimen, and in front of the oven. In order to prevent the thermocouples from being obscured by radiation, they were affixed to the surface using tape. Figure 5 shows the position of the thermocouples and the dimensions of the glass pane and the opening of the oven. By measuring the temperature on the inner surface of the glass pane, the direct exposure temperature could be recorded. Additionally, mineral wool (70 mm × 50 mm, λ = 0.035 W/(mK)) was used to cover the outer thermocouple in order to reduce the impact of external convection of the glass surface. The additional insulation of the outer thermocouple resulted in an additional inhomogeneity in the lateral direction of the glass pane. However, this was not accounted for in the temperature measurement.
Table 1 Overview of the specimens and their labelling - Full size table
The tests started at a room temperature of 26 °C. The temperature was increased with a rate of 30 K/min. The tests were stopped when 400 °C was reached or when the glass broke.
3.3 Experimental results
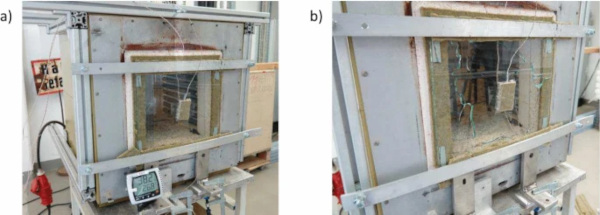
As a result of these experimental tests, all specimens broke due to thermal fracture from the edge. Figure 6 shows one example before and after the test. The glass pane was fixed to the furnace at the outer edge with mineral wool as an intermediate layer. This can create inhomogeneous temperature fields in the edge area, leading to stress peaks and potential thermal fractures. The picture on the right shows the glass pane broken from the edge. Figure 7 illustrates the results of the temperature measurements. Blue lines show the results of the glass panes with a thickness of 4 mm (monolithic and LSG 2 × 4 mm), the green lines represent the thicknesses of 6 mm (monolithic and LSG 2 × 6 mm) and the orange lines represent the thickness of 10 mm.
The first row of graphs shows the results of the monolithic specimens and the second row shows the laminated specimens. The coloured dotted lines represent the temperature measured in the centre of the oven, the dashed lines represent the temperature on the inside glass surface (glass in) and the straight line shows the temperature on the outer glass surface (glass out). The vertical black dashed line represents the time when the first glass pane broke. The tests of the monolithic specimens were stopped after the glass breakage. The tests of the laminated ones were continued until the furnace reached 400 °C. In both laminated glass specimens, the inner glass pane broke, the outer glass stayed intact. About 1 min after the breakage of the inner glass pane bubbles occur in the PVB interlayer.
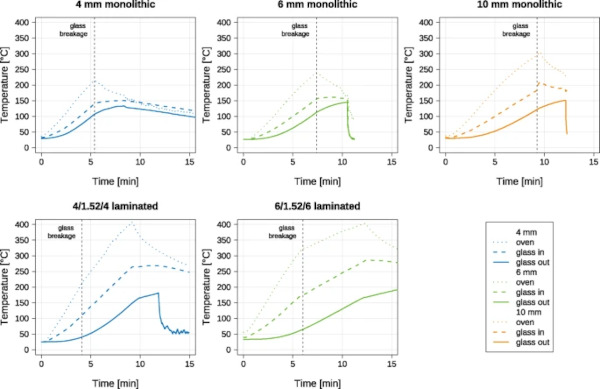
The results indicate a significant temperature difference between the oven’s centre and the temperature measured at the glass inner surface (glass in). A maximum temperature gradient of 170 K was measured here. This suggests that the oven’s temperature distribution is subject to strong fluctuations due to insufficient convection and radiation power. The results of comparing different glass thicknesses indicate that the heating inertia and temperature gradient between the outer and inner surfaces increase with the thickness of glass. The maximum temperature difference in thickness direction observed was 33 K for the monolithic pane with a thickness of 4 mm and 82 K for the pane with a thickness of 10 mm.
As the thickness of the glass pane increases, the temperature distribution within the glass becomes increasingly uneven. The observation that the thicker test specimens failed later than the thinner ones is an unexpected result. Due to the higher thickness, the temperature gradient in thickness direction is higher than in thinner glass panes. Nevertheless, in most cases, the high temperature gradients in the lateral direction cause the glass pane to break. It can be assumed that the maximum gradient within the glass pane was even greater in the edge area due to the mineral wool, as all test specimens experienced thermal fractures. As previously stated, annealed glass has a thermal shock resistance of 40 K according to EN 572-1 (2016a).
The results show that the temperature gradients between the inner and outer surfaces of the laminated glass were significantly higher than for the monolithic specimens. It is not possible to make a qualitative statement as the heating ramps in the oven differed significantly between the tests. The reason for the differences in the heating ramps between 30 and 50 K/min cannot be determined. Quantitatively, the diagrams show that the temperature difference between the inner and outer glass surface was lower in the test specimen with a thickness of 10 mm compared to the laminated test specimen with two 4 mm thick panes (total thickness 9.52 mm).
This is due to the decoupling of the two panes caused by the interlayer foil. On the other hand, the lower thermal conductivity of PVB (0.21 W/(mK), e.g. Kuraray 2024) compared to SLGs (1.0 W/(mK), EN 572-1 2016a) can explain this. Table 2 shows the time stamps and maximum temperatures at the glass breakage of the different specimens. The values represent the temperature difference in the centre of the glass pane. This means that only the gradient across the thickness can be determined. However, it is more probable that the temperature gradient in the lateral direction was responsible for the breakage, as a higher difference is to be expected due to the insulation in the support area.
Table 2 Time stamps and maximum temperatures at the glass breakage and maximum temperature difference between inside and outside glass surface - Full size table
3.4 Numerical simulation
3.4.1 Model
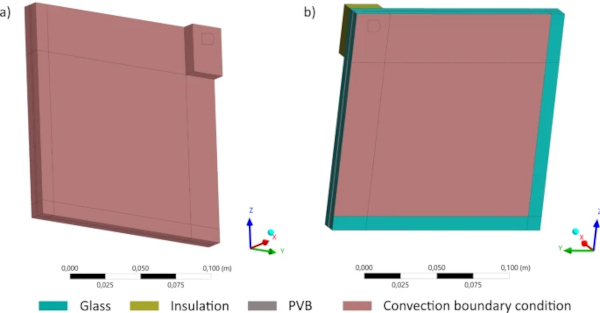
Numerical simulations were conducted to replicate the experimental tests (ANSYS 2023 R1, non-linear static analysis). To achieve this, the test specimens were modelled in ANSYS and subjected to a temperature load. The input temperature was a convection boundary condition on the inner glass pane using the measured temperature inside the oven (see Fig. 7) and 60 W/(m2K). The heat transfer coefficient of 60 W/(m2K) was calculated in accordance with the specifications outlined in (EN ISO 6946, 2018). The convection component was incorporated into the calculation with a value of 25 W/(m2K) assigned to it. This equals a low flow velocity of approximately 19 km/h, which was arbitrary chosen. This value was then superimposed with the prevailing radiation value, which is calculated to be approximately 35 W/(m2K) according to (EN ISO 6946, 2018) assuming a radiation temperature of 300 °C.
The level of the heat transfer coefficients for natural convection and thermal radiation described last represents an initial approach for the numerical simulation of the experimentally determined results. Figure 8 shows both the outside surface of the specimen and the inside surface of the glass pane that were loaded with the convection boundary condition for the simulation. The model includes the support area of a 10 mm strip of mineral wool on all sides and the piece of mineral wool that covered the thermocouple on the outer surface of the glass (Fig. 6). This enabled validation of the models using the experimental results. The outer surface was loaded with a convection boundary condition of 23 C (laboratory condition) and 10 W/(m2K). This convective heat transfer coefficient was calculated assuming an air flow velocity on the outer surface of the oven of approximately 5.4 km/h using (EN ISO 6946, 2018).
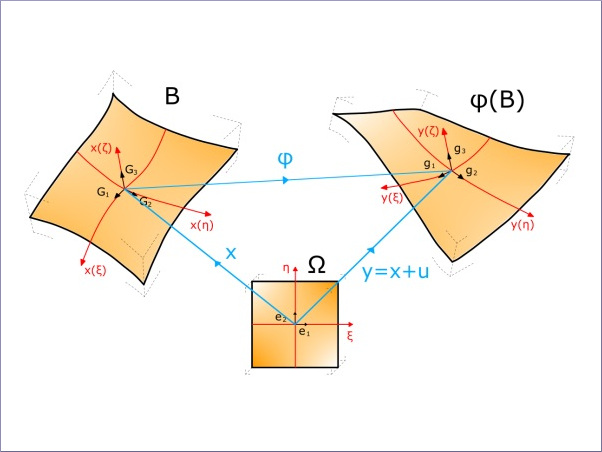
The aim of these examinations was to determine the thermal stresses in the glass due to the inhomogeneous temperature fields in the lateral direction caused by the mineral wool. Figure 9 shows the mesh of the model using the example of the laminated specimen (4/1.52/4). Given that the experimental setup is doubly symmetrical, only 1/4 of the glass pane was modelled. Figure 9a) illustrates the model and the two axes of symmetry that were selected. The same model was used to calculate the thermal induced stresses.
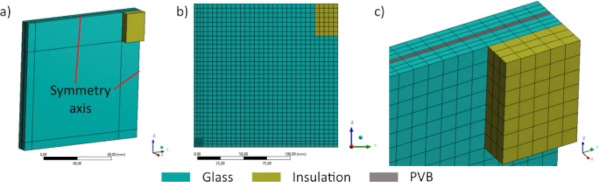
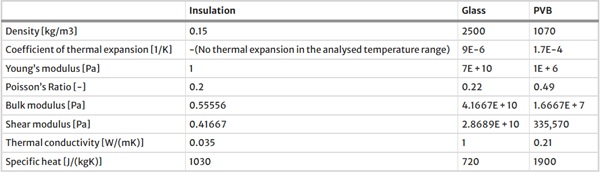
Table 3 shows the chosen material properties for the numerical model. The material properties of interest are known to be dependent on temperature, for example the modulus of elasticity (from 450 °C) and thermal conductivity (from 300 °C). This has already been demonstrated by Rouxel (2007) and Nodehi (2016). In the course of the examinations, temperature-dependent parameters according to the aforementioned literature were incorporated into the modelling. This resulted in a maximum discrepancy of 1% (temperature results) between the results obtained from temperature-dependent and temperature-independent parameters. The maximum difference occurred after 10 min simulation with a temperature results between 198 °C and 200 °C. Short-term exposure is suspected to be the cause for this difference. Consequently, temperature-independent parameters were utilised for the calculations.
Table 3 Material properties of the numerical simulations - Full size table
Based on previous examinations, the element size and type as well as the displacement constraint boundary conditions were determined as follows.
- Three elements in thickness direction
- Element size in lateral direction: 5 mm
- Element size in the edge area: 3.33 mm
- Element type body for thermal calculation: SOLID90
- Element type contact conditions: CONTA174 and TARGE170
- Element type convection: SURF152
- Element type body for static-mechanical calculation: SOLID186
- Clamped in the y and z directions and hinged in the x direction
3.4.2 Temperature results
As expected and mentioned in chapter 3.3, the results of the temperature simulations show that the maximum temperature gradient inside the glass is in lateral direction between the center and the edge of the glass. Figure 10 shows the results and the temperature distribution of the laminated specimen L6 (see Table 1).
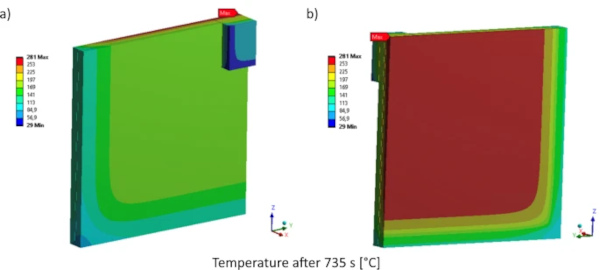
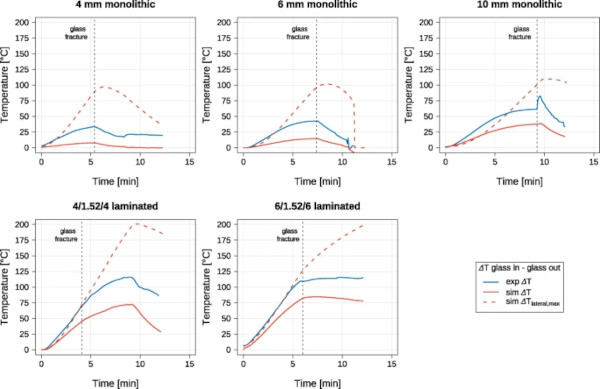
Figure 11 shows the temperature gradients in thickness direction in comparison with the gradients in lateral direction from simulation results. The blue lines represent the experimental results, while the red lines illustrate the outcomes of the simulation. The straight lines represent the temperature gradient in thickness direction and the dashed line shows the gradient in lateral direction. The results show that the temperature gradient in thickness direction in both experiment and simulation, is significantly lower than in lateral direction. Additionally, the difference between lateral and thickness direction is higher for the monolithic specimens than for the laminated specimens. This may cause from the thermal decoupling due to the PVB interlayer. It can be observed that as the thickness of the glass package increases, the difference between the lateral and thickness directions decreases.
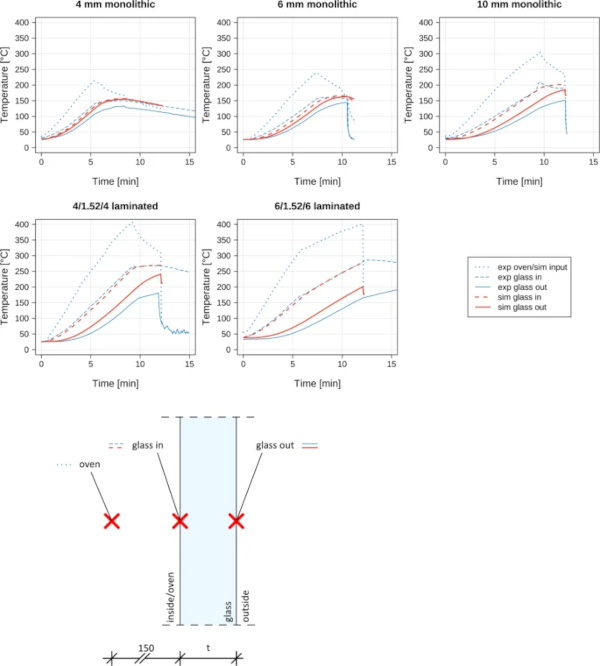
To validate the FE model, simulation results were compared to measured temperatures from experimental examinations. Figure 12 shows both the experimental and simulation results in comparison to each other. The blue lines represent the results experimental test, while the red lines illustrate the results of the simulation. As already mentioned, the input temperature for the simulation as a convection boundary condition is the oven temperature illustrated by the blue dotted lines. The diagram shows that the calculated temperature at the glass surface inside the oven (sim glass in) matches the measured temperature at the same point from the experimental test (exp glass in). The second result can be observed in the comparison between the temperature at the outer glass surface (glass out). For the 4 mm and 6 mm monolithic specimens, the maximum difference in temperature is 12 K, while for the 10 mm monolithic specimen the maximum difference is 38 K (see also Fig. 11). The calculated temperatures at glass out do not align with the measured temperatures at this point.
3.4.3 Thermally induced stress
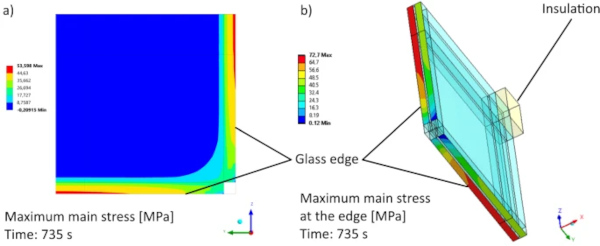
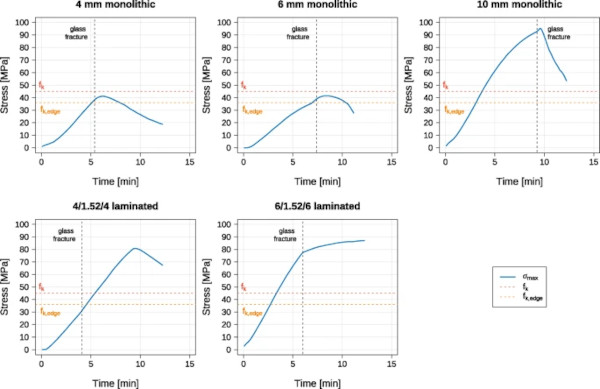
In addition to the temperatures that were observed, the thermally induced stresses were also simulated. As previously stated, the same model was utilised. Figure 13 illustrates an example of the evaluation of the stresses on test specimen L6. The left figure shows the main stress in all bodies. The glass in the centre of the pane expands more than the cooler edge areas due to the heating. This results in tensile stresses in the edge area and compressive stresses in the centre of the plate. Figure 13 right reveals that the maximum stresses occur in the centre of the edge of the inner glass pane. This is consistent with the observations made during the experimental test, as the test specimens consistently broke from this position. Figure 14 illustrates the maximum stresses in the test specimen (blue lines) and the characteristic strength in general (fk) and for the glass edge (fk,edge) for annealed glass in accordance with DIN 18008–1 (2020) and EN 572–1 (2016a) (dashed lines). The time of glass breakage is indicated for each test specimen. For the laminated test specimens, only the inner glass pane was examined, as the outer pane remained intact in both cases.
It should be mentioned that the diagrams show the maximum stresses with no specific location of the edge. There are slight discrepancies between the stress curves of the monolithic glass panes. The curve for the 10 mm thick pane is steeper than that of the 4 mm and 6 mm thick panes. The increased rise in stress observed with a thickness of 4 mm as compared to 6 mm can be attributed to the faster rate of heating (oven temperature reached 200 °C after 5 min at 4 mm and 170 °C after 5 min at 6 mm). The significantly steeper increase in stress at 10 mm can be attributed to non-linear effects and the higher thickness of the glass pane in comparison to M4 and M6. This implies that it also attains the characteristic strength at an earlier stage than the thinner panes. This finding is not in accordance with the results of the experimental tests, which demonstrated an increasing failure time with a higher glass thickness. The rise in stresses in the laminated panes is steeper than in the monolithic ones. This can be attributed to the elevated heating rate. Furthermore, the characteristic strength fk or fk,edge was attained for all specimens.
It has to be mentioned that the specimen L4 exhibited a premature failure prior to attaining either of the two characteristic strengths. However, the chemical reaction of hydrolysis is associated with crack growth in glass (Michalske & Freiman 1983). It can be generally stated that increasing temperature, without further control of humidity, leads to a decrease in relative humidity, thereby reducing the number of water molecules available for crack tip growth, thus slowing crack growth and increasing fracture strength (Wiederhorn 1967). This effect is independent of the heating rate itself and only depends on the ambient temperature (Schwind et al. 2021, 2022a, b). It should be mentioned that the small number of specimens in this study is not statistically significant due to the high scattering of strength in the glass.
3.4.4 Summary and constructive criticism of methodology
The temperature results of the simulation show that it does not align with the experimental results. Two reasons can be found for this. One potential explanation for this phenomenon is the positioning of the thermocouples. As they were covered by the mineral wool, it is possible that the measuring head of the thermocouple protruded slightly into the insulation. This created a gap between the glass pane and the thermocouple. It is imperative to note that temperature measurement is sufficiently sensitive that a minimal distance of a few millimetres between the thermocouple and the glass is sufficient to induce a temperature difference. The second reason is the chosen value for the convection boundary condition to model the heat transfer on the surface of the glass pane facing to the oven chamber. As the level of radiation rises with rising temperature, and the amount of convection within the oven cannot be determined precisely, it was only possible to calculate with the assumption of the two values described in Sect. 3.4.1. For the purpose of further examinations, it is necessary to calibrate the numerical model using these two parameters and the experimental results. It is expected that an adjustment of the heat transfer coefficients on the interior (60 W/(m2K)) and exterior surfaces (10 W/(m2K)) can improve the results.
4 Stress relaxation in thermally pre-stressed glass–experimental examination
4.1 Specimens and test series
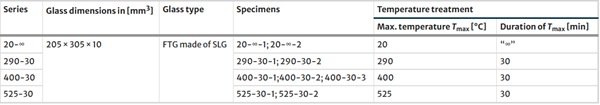
The investigations were performed on fully tempered glass according to EN 12150-1 (2020). The plan dimensions of the flat glass amount 205 mm x 305 mm with a nominal thickness of 10 mm. All specimens belong to the same batch. The configuration and the location of each specimen within the tempering oven are unknown. Generally, minimum of two specimens were analysed for each series. The low number of specimens is due to the nature of the tests, in this case screening tests. All series with corresponding parameter settings are listed in Table 4. The temperature values were selected based on the heat soak test for FTG (EN 14179-1 1999) and the conditions in Schneider et al. (2016a) extended to 525 °C. Series 20-∞ serves as a reference series without temperature treatment (Fig. 15).
Table 4 Overview of specimen series with parameters - Full size table
4.2 Examination methods
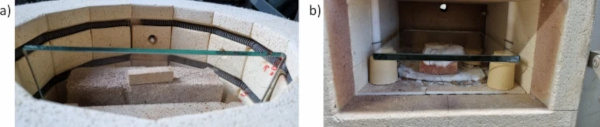
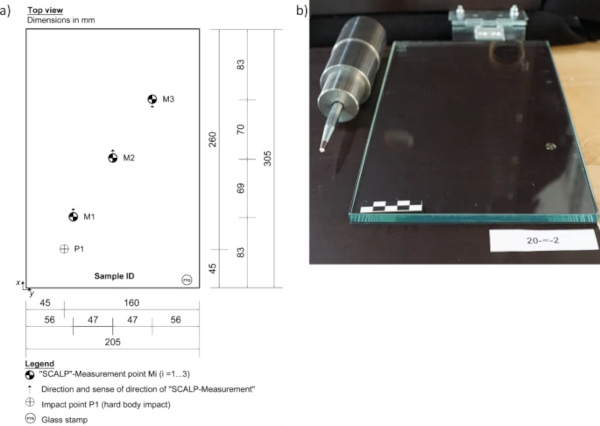
Anisotropy scanning (device line scanner, Softsolution) and residual stress measurements (device Scalp-05, Glassstress) were carried out on each specimen before and after the temperature treatment. The residual stress values were determined in one direction at three measuring points (M1, M2 and M3) according to the image in Fig. 16a. Three individual measurements were carried out at each measuring point Mi (i = 1, 2, 3) on the “stamp side” of the glass pane. The mean value of the three measurements is given as the result in this paper and the standard deviations are below ± 2 MPa. The heat treatment was performed with 2 ovens. The first oven—Kittec CB20, see Fig. 15 a)—was used for heating (heating ramp 3 K/min.) and keeping the maximum temperature for 30 min. After the 30-min holding period, the specimens were transferred by hand within 15 s from oven one to the second oven—Nabertherm LT24/11/P170, see Fig. 15b—for slow cooling. In order to reduce the undesired stress relaxation process in the second oven, this oven was preheated to 230 °C and switched off after the specimens had been loaded and cooled down to room temperature naturally.
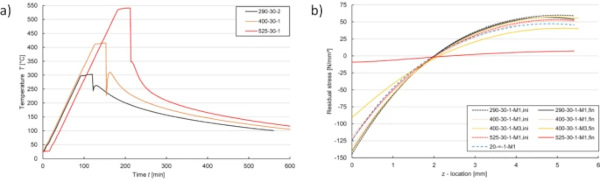
One calibrated thermocouple (type K) per oven recorded the temperature for at least one specimen per series. The thermocouples (measuring point) were placed in the first oven between two stones next to the glass pane and in the second oven between the glass and a ceramic disc. The specimens were deposited in the ovens in such a way that convection was possible. The temperature was regulated via the respective controllers, each with its own thermal sensor. The measured temperature curves for 290 °C, 400 °C and 525 °C are shown in Fig. 17a. The difference in the maximum temperatures between the oven parameters and the measured temperature can be explained by the different positions in combination with the thermal inertia of the thermocouples. The test setup with one specimen within the two ovens is shown in Fig. 15a and b. During the specimen transfer of series 525–30 in the second oven, glass breakage occurred due to thermal shock. The crack lines of specimen 525–30-1 and 525–30-2 are located in the area of the thermocouple measuring point.
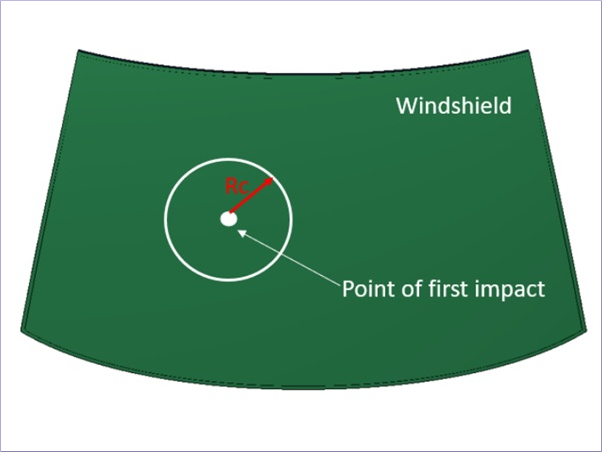
After the temperature treatment the specimens were broken with an impact body (mass 2.4 kg, drop high 70 mm, steel body with centre punch, fall energy of 1.7 Nm) in the corner area. The glass specimens were supported continuously on a rigid plywood panel. In Fig. 16a the location of the measuring points (Mi) for the residual stresses in the glass pane and the impact point (Pi) for the fracture test are given. In Fig. 16b the test setup for the fracture test is given. Here the used impact body (centre punch) can be seen. For the initiation of further cracks in the already fractured specimens of series 525–30, the impact energy had to be increased to 5.9 Nm and a further impact point P2 was applied in the corner area of these specimens. Immediately after the panes were impacted, the fracture pattern distribution was recorded with the Culletscanner (company Softsolution). The quantity of fragments in the area of the coarsest fracture pattern was determined in consideration of the distances (impact point and edges) in accordance with EN 12150-1 (2020).
4.3 Results
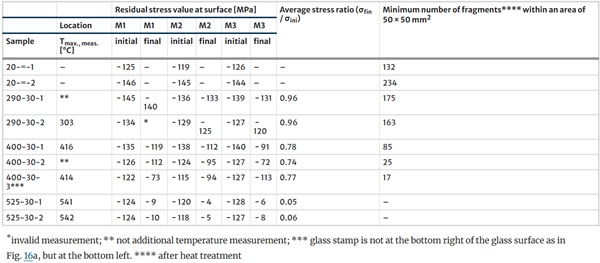
In Table 5 the residual stress values (surface “stamp side”) are listed for each specimen before and after temperature treatment. Also, an average stress ratio is given there. This ratio is determined out of three measured values (M1, M2 and M3) after the temperature treatment and the three measured values in the initial state. Exemplary stress profiles over the glass thickness for some specimens are shown in Fig. 17b. The initial stage curves (dashed line, ini) show similar characteristics. Only samples 20-∞-1 and 525-30-1 show lower pre-stress values (absolute values) at the surface than the other three curves. All values in the initial state and the values for series 290–30 after temperature treatment (final state) are in the range of FTG according to Schneider et al. (2016a, b). The comparison between the initial state and the final state shows that the residual stress reduction at 290 °C is approx. 4%, at 400 °C 22% to 26% and at 525 °C over 95%. The stress reduction effect can be seen clearly in the profiles (see Fig. 17b, especially for specimen 525-30-1 and 400-30-1 at measuring point M3. A noticeable observation is that the stress reduction varies across the measuring points. This can be explained by the vertical arrangement of the measuring points in the first oven. Measuring points at the top have lower residual stress values (absolute value) than those at the bottom. Therefore, it is assumed that an inhomogeneous temperature field was present in the first oven.
Table 5 Residual surface stress (mean values) of three measurement locations before (initial) and after (final) temperature treatment, average stress ratio and minimum number of fragments (area 50 × 50 mm2) - Full size table
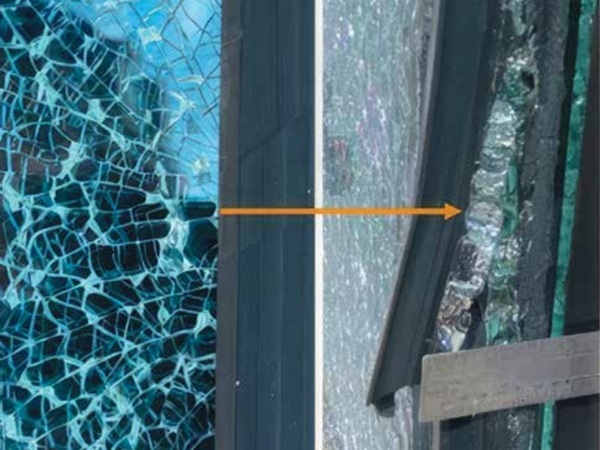
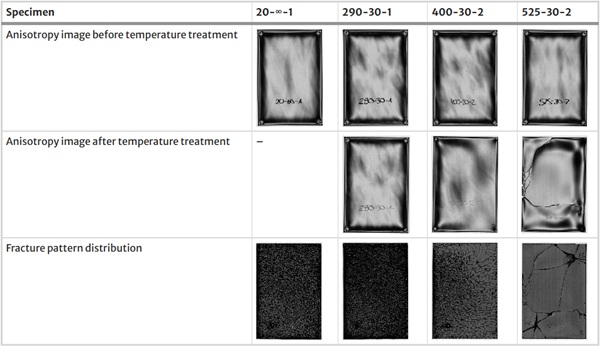
An overview of the anisotropy images before and after the temperature treatment as well as a corresponding image of the fracture pattern are shown in Table 6. The comparison of the anisotropy images and the fracture pattern images shows that a visual change did not occur at 290 °C, which corresponds to the residual stress reduction of around 4% as mentioned before. The specimens which were exposed at 400 °C and 525 °C (30 min) differed significantly from the reference series and the anisotropy scans before the temperature treatment. Temperature treatment at 400 °C and above shows clear changes in the fracture pattern towards a coarser structure and the minimum number of fragments has decreased compared to the reference series.
The minimum number of fragments for two of three specimens of series 400–30 is below the minimum number of 40 fragments for 10 mm thick FTG according to EN 12150-1 (2020). The number of fragments was not determined for series 525–30. The fracture pattern of this series due to the described thermal shock corresponds to annealed glass. Furthermore, the fracture pattern distribution, the residual stress values and the anisotropy scans of the specimens of series 400–30 show very clearly that inhomogeneous relaxation occurred within temperature treatment. The reason is probably the uneven heating of the specimens due to the vertical storage in the first oven. This should be taken into account in subsequent analyses.
Table 6 Anisotropy image of one specimen per series before and after temperature treatment and corresponding image of fracture pattern distribution - Full size table
5 Conclusion
5.1 Temperature transfer through glass and thermally induced stresses
This paper presents the experimental and numerical examinations into the temperature transfer through monolithic and laminated glass, and the resulting thermally induced stresses as well as the strength reduction of fully tempered glass due to temperature exposure. The results of the experimental examinations of the temperature transfer through glass indicate with a constant heating rate that fracture occurs later the thicker the glass pane is. It should be noted that the number of test specimens used is less for a real statistical analysis, and that the examinations only represent preliminary tests. The numerical simulations conducted have corroborated this outcome. The temperature curves of the exposed surface of the glass could be successfully recalculated, and the thermally induced stress demonstrated that the failure strength is exceeded at a later point in time, with increasing thickness of the glass pane. The numerical simulation of the experimental tests has demonstrated the necessity for recalibration of the model, with particular reference to the parameters of radiation and convection. However, improvements are also required in the experimental examinations, specifically with regard to the positioning of the thermocouples. This can be addressed by increasing the number of thermocouples and fixing them to the glass pane.
The outcomes of the temperature measurements and the numerical simulations corroborate the findings of the preceding research. The measurement of temperature is a complex process that is influenced by a multitude of external factors. Furthermore, the temperature gradients in the lateral direction are considerably higher than in the thickness direction, which results in the maximum thermally induced stresses at the edge of the glass pane. However, the maximum temperature gradient that was recorded before fracture of the glass was about 100 K, which is much higher than the maximum regulated temperature gradient of annealed glass of 40 K according to EN 572-1 (2016a).
5.2 Stress relaxation in thermally pre-stressed glass
The results of the experimental examinations on the stress relaxation of FTG with subsequent temperature treatment confirm the general findings in Schneider et al. (2016a). The specimens examined here with a thickness of 10 mm show small changes in the residual stress values at a temperature of 290°C with a holding period of 30 min. The specimens of the series 400–30 and 525–30 show a clear stress relaxation. The stress relaxation amounts 24% for series 400–30 and 95% for series 525–30 due to the subsequent temperature treatment. The reduced pre-stress will cause a reduction in strength, which will fall to the strength of annealed glass in case of total relaxation. As a result of the imperfect heat treatment, inhomogeneous stress distributions and fracture patterns occurred in the specimens which were exposed to 400 °C for 30 min. Furthermore, the phenomenon of stress relaxation is contingent upon both temperature and time. A longer storage period of over 30 min can cause a greater degree of stress relaxation in the glass. In practice, such inhomogeneous temperature fields occur at "low" temperature levels up to approx. 120 °C (e.g. solar irradiation of insulating glass) but also at higher temperatures up to approx. 1000 °C (e.g. fire). The influence of inhomogeneous temperature fields on stress relaxation and the resulting strength and fracture pattern distribution of large glass structures is not sufficiently researched to derive design rules for these load cases.
5.3 Comparison between action and resistance
Thermally induced stresses resulted in a value of up to 100 MPa for a maximum temperature of 400 °C, which falls within the resistance range of fully tempered glass. However, if stress relaxation has taken place as a result of the temperature effect, the resulting stress can exceed the value of the remaining strength. In the tests presented, it could be demonstrated that the boundary between action and resistance begins to blur at a temperature of 290 °C and above. The resistance (characteristic strength) is influenced by the effect (temperature and time). On the one hand, the effect of temperature leads to design-relevant stresses in tempered glass panes. On the other hand, it also influences the strength values and the fracture pattern above a temperature of approx. 290 °C. These aspects show that a combined design approach for glass structures at high temperatures will be necessary in the future to enable a realistic analysis.
6 Outlook
The results presented in this paper demonstrate the complexity of temperature measurement in and on glass. Further examinations are required to obtain results that are both comprehensible and reproducible. The precise positioning of the temperature measurements has a significant impact on the quality of the outcomes. Furthermore, it is of the utmost importance to meticulously document and analyse the precise temperature distribution within the oven that is to be utilised for further experiments. This will facilitate a better understanding of how the temperature distributes inside the oven and on the glass surface. In order to ensure statistical relevance and to facilitate the processing of data for a design model, it is necessary to analyse a greater amount of test specimens per test series (recommendation min. 3 specimens per series). In addition, it is essential to record and document all boundary conditions of the laboratory furnace used in order to enable reproducibility and to facilitate deeper insights in the temperature distribution.
This could potentially enable the inclusion of a design model in Eurocode 10 (CEN TS 19100-1 2021; CEN TS 19100-2 2021; CEN TS 19100-3 2021). However, relevant stress relaxation was observed at temperatures of approx. 400 °C. This interaction between thermally induced stresses and stress relaxation due to temperature exposure needs to be examined in more detail, especially in the case of inhomogeneous temperature fields. In order to develop a design model for higher temperatures and, in particular, for the case of fire, further complex temperature and fire tests are required. However, future examinations may be able to make the results for a design model for temperatures above 350 °C possible, thereby reducing the number of component tests required.
Future examinations will focus on numerical simulation of stress relaxation as a function of temperature exposure, the precise understanding of temperature distribution in the glass with homogeneous and inhomogeneous temperature exposure from 400 °C, and the effects of a simultaneous mechanical load on the glass.