Source:
Challenging Glass 7
Conference on Architectural and Structural Applications of Glass
Belis, Bos & Louter (Eds.), Ghent University, September 2020.
Copyright © with the authors. All rights reserved.
ISBN 978-94-6366-296-3, https://doi.org/10.7480/cgc.7.4440
Authors:
Wim Stevels, Eastman Chemical BV, Netherlands
Pol D'Haene, Solutia Europe bvba, Belgium

1. Introduction
Over the last five years, a number of developments have taken place that have influenced the determination of interlayer modulus properties, and their use in laminated glass design.
Significant research has been undertaken by academia and industry, to optimize, compare and expand measurement methods and data processing methodology, complemented with sensitivity analysis and, in some cases, inclusion of these data in standards.
An extensive review of predominantly academic work and standards has been recently published (Kuntsche et al. 2019), and other relevant academic publications are available (Andreozzi et al. 2014; Botz et al. 2018(1); Schuster et al. 2018; Kuntsche et al. 2015). Examples of additional or complementary industrial work are mostly available as conference contributions (Stevels 2019; Stevels et al. 2016;Haerth et al 2019). The combined effort has led to a better understanding of best practices for methods and data treatment and validation.
After many years of discussion and development, EN 16612(2019) and the associated interlayer characterization standard EN 16613 (2019) were published in 2019. Significant changes to the scope as compared to the enquiry versions of 2013 and 2017 have occurred, which limits this standard to guidance for the lateral load resistance of linearly supported glazed elements used as infill panels, ina class of consequence lower than those covered in EN 1990.
Particularly to the use of interlayer properties, emphasis has shifted from use of effective thickness methods and stiffness families with default shear transfer coefficients to direct use of interlayer properties in FEM design. Two known shortcomings in standard EN 16613 are the limitation to a single DMA method and the lack of guidance with regards to data processing for generation of master curves.
Whereas in earlier versions of EN 16613 an element of conservatism to the modulus data with regards to glass design was implemented through the use of default conservative shear transfer coefficient values, that safeguard was lost in the transition to emphasis on FEM calculations, where these values are used directly.
Much progress has been made on the development of a Eurocode on glass design, resulting in (pre-)publication of a precursor technical specification for further development in the coming years. Different levels of using interlayer properties are likely to be recognized, including layered limit states, effective thickness models and-for the purposes of finite element calculations-viscoelastic models based on Prony series.
It was with these developments in mind, that the properties of three different PVB (conventional, acoustic, stiff) formulations have been determined using current methodologies, with the results expressed as a viscoelastic model in Prony series format. These models were benchmarked against independently determined viscoelastic models, and validated by four-point bending experiments on laminated glass.
2. Experimental approach
Dynamic mechanical analysis (DMA) experiments were carried out on three different Saflex® interlayers from commercial production, all at a nominal thickness of 0.76 mm. These interlayers were respectively Saflex Clear 0.76mm (formerly Saflex RB41-conventional PVB type), Saflex Structural 0.76 mm (formerly Saflex DG41 or DG41XC-stiff PVB type) and Saflex Acoustic (formerly Saflex QS41-acoustic trilayer PVB type). For the latter product, an additional separate effort in validation was made that is described elsewhere (D’Haene and Stevels, 2019). The geometry used was a parallel plate set-up as per ISO 6721-10: 2011, having a diameter of 8 mm (Fig. 1).
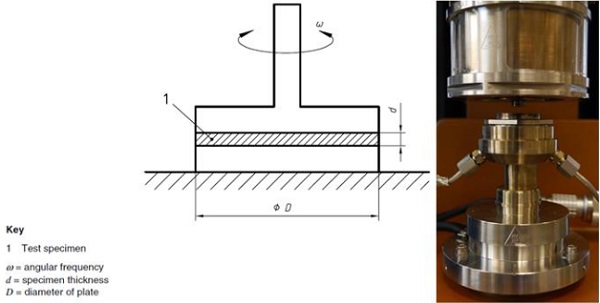
Using a larger plate diameter in combination with low temperature experiments and higher frequencies generally results in an overload of the transducer which is not recommended. For each temperature it was verified that the applied strain was maintained within the linear viscoelastic region.Experimentally, frequency sweeps were carried out in a frequency interval ranging from 0.1 rad/s to 100 rad/s. The temperature of the experiment was increased from -30°C to 90°C, starting far below the glass transition temperature of the interlayers.
For the dynamic experiments, the shape of the measured sine wave was monitored to assure that no slippage at the interface of the sample occurred. Only horizontal shifts of the frequency shifts curves on the frequency axis were used to generate the mastercurve. Time-temperature superposition principles were applied using the Williams-Landel-Ferry (“WLF”) equation to determine shift factors aτ. The relaxation spectrum was directly generated by the instrument software from the measured shear and loss storage modulus data. The relaxation spectrum was determined from the obtained master curve, at a reference temperature of 20°C, using a model containing 10-11 relaxation times and shear relaxation moduli.
During the fitting process both parameter sets were considered as variables. The resulting relaxation data were interpolated to relaxation times regularly spaced in decades for user convenience and associated with the corresponding shear relaxation modulus values. The results of the model were compared to automatically generated mastercurves at different temperatures for reasonable fit.
Reference viscoelastic models were provided by the Institute for Statics and Construction, Technical University Darmstadt, Darmstadt, Germany based on independent experimentation and evaluation (Schuster and Schneider, 2019).
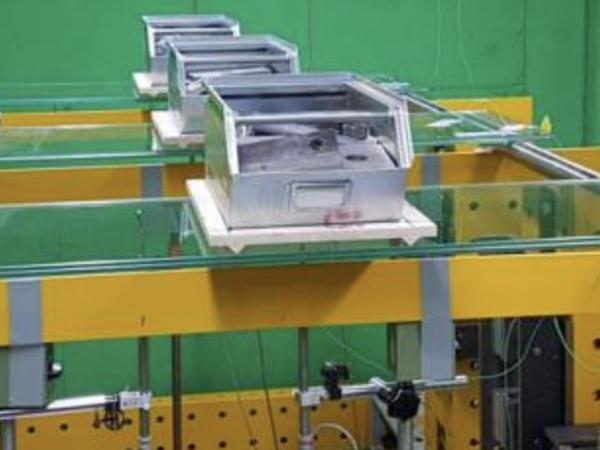
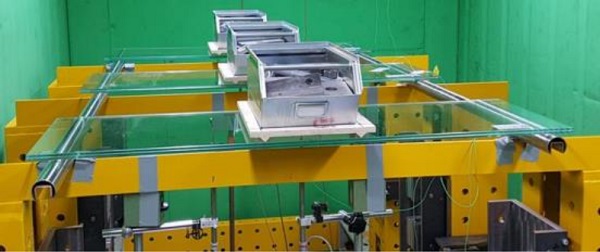
Results from four-point bending experiments were provided by Institute of Structural Engineering, University of the German Armed Forces, München, Germany based on independent experimentation and evaluation (Kraus et al. 2019).An overview of the four-point bending test set-up is provided in Figure 2. Both measurement reports can be provided upon request to the author.
3.Results and discussion
3.1.General
In fitting the experimental data, a Prony series comprising 10-11 elements was chosen to balance accuracy with practicality as a model for G(t). This function is a mathematical representation of the molecular motion taking place in the polymer, which can be described mechanically as a series of Maxwell models:
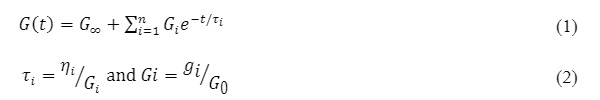
in which the modulus Gi reflects the relative magnitude of each process while the relaxation time τiindicates its timescale. Curve fitting was optimized over the number of elements disregarding the exact values of the relaxation time, which were later interpolated to more rounded relaxation times, while reviewing retainment of fit. For all products, a temperature shift function was developed based on the WLF equation of type:

Thus, for each Prony series, values are provided for gi, τi, G0, G∞, C1and C2.
3.2. Conventional PVB type (Saflex Clear)
Although conventional PVB interlayers were not designed to contribute structural properties, some standards associate a certain level of shear transfer with this polymer class, either through a low default shear transfer coefficient for wind loads (NBNS-23-002: 2016); NF DTU 39: 2017), or complete shear transfer at short durations and modest temperatures, or longer durations at cold temperatures (e.g. snow loads) (ASTM 1300: 2012).
In many cases, taking into account a limited amount of shear transfer as derived from the properties of a conventional PVB type can help reduce deflections or stresses in laminated glass. Over the years, a number of models have been proposed for conventional PVB types (Bennison et al. 1999; D’Haene and Savineau 2007; Hooper et al. 2012; Andreozzi et al. 2014; Piscitelli 2018).
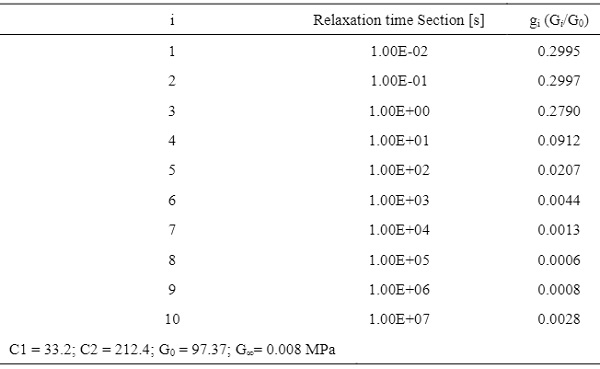
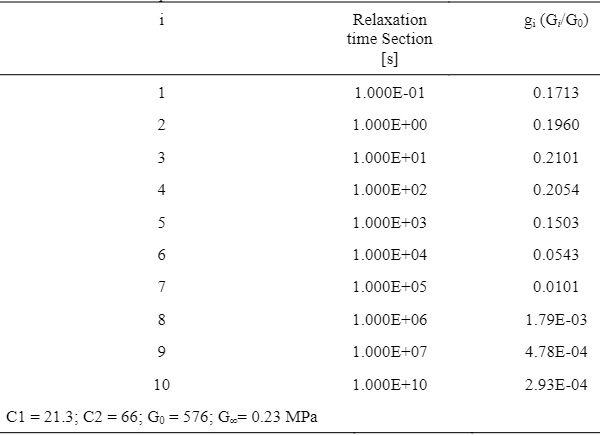
One of these material models has been incorporated as such in Dutch standard NEN 2608: 2013as a reference for material properties of this kind. In earlier work, a material model for conventional Saflex PVB was published by one of the authors (D’Haeneand Savineau 2007 –“DHS”model. A more recently developed Prony series for conventional PVB Saflex Clear is represented in Table 1, along with the WLF parameters C1 and C2 (Schuster and Schneider 2019, “TUDa” model)
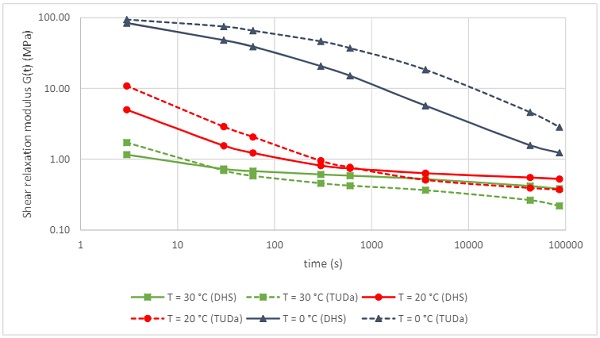
The shear relaxation modulus derived from this model for Saflex Clear is plotted in Figure 3 for temperatures of 0, 20, and 30 °C, as well as data from the DHS model. Over this temperature domain, values for shear relaxation modulus range over more than three decades. The shape of the master curve is consistent over both models.
The model of Table 1 is more conservative at higher temperatures and longer durations as compared to the DHS model, as is readily apparent from the 20 and 30 °C curve.For glass design purposes, use of the more conservative and more contemporary model is desirable, and it was decided to use the model of Table 1 as basis for validation with four-point bending.
Table 1: Model parameters for the evaluation shear relaxation modulus G(t,T) for Saflex Clear RB (Tref= 20 °C).
Four-point bending experiments on laminated glass specimens of 360 *1100 mm were executed over a 0 to 40 °C temperature range at the University of the German Armed Forces (Munich, Germany) following the generic guidance of EN 16613 taking into the remarks made in Botz et al 2018(2). The details of the experimentation can be found in Kraus et al. 2019. A comparison of the modulus values derived from these measurements to the model of Table 1 is given in Figure 4.
In the fully coupled limit state (for modulus values > 10 MPa at e.g. 0 °C), four-point bending is not able to determine an exact value of the interlayer modulus and a large deviation is observed with the values obtained from the model of Table 1. Note that under these conditions, structural glass designs become insensitive to the exact absolute value of the interlayer modulus, even if the effect of commercial glass thicknesses is disregarded. At higher temperatures, where shear coupling starts to reduce, the alignment of the model from Table 1 with the four-point bending results is very good, and the model can be considered validated.
![Fig. 4 Shear relaxation modulus for conventional PVB for durations between 3s and 24 hours at different temperatures for the model of Table 1 (DMA, solid lines), and as derived from four point bending experiments (dotted lines, [15]).](/sites/default/files/inline-images/Fig4_123.jpg)
3.3. Acoustic PVB (Saflex Acoustic)
Although acoustic interlayers are not designed to contribute structural properties and are relatively soft, these interlayers still bond the glass panes between which they are laminated, and thus their properties will be apparent in the behavior of the glass. Of course, an effectively decoupled state is reached in many more cases than for regular PVB, let alone stiff PVB types.
In some designs where the acoustic requirements are high, it is of interest to calculate with relatively low values of interlayer modulus to limit the stiffness of the laminates, to reduce the stress on clamped glass. An example in this category is e.g. a double-laminated IGU of limited size, where the stresses induced by cavity pressure variation can become design limiting. Therefore, there is a need for reliable modulus data even for these interlayer types.
The interlayer used in this study consists of a multilayer structure with a relatively soft-core layer accounting for the acoustical performance, and skin layers having rather standard mechanical properties for excellent product handling and processing, and contributing to the impact performance of the final laminate. The presence of the soft-core layer has a significant effect on the mechanical properties of the laminated glass.
From first principles, it is not obvious whether the time-temperature superposition (TTS) can be applied directly on a layered material structure for the development of master curves. It was recently shown that the properties of multilayer acoustic interlayers can be effectively approximated by measurements on the assembly, even if a number of cautions remain in place (D’Haene and Stevels, 2019).
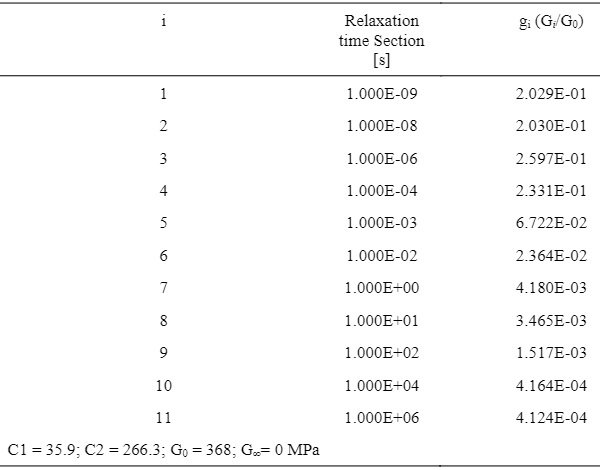
Therefore, direct measurements on an acoustic interlayer were executed. The Prony series developed for acoustic multilayer PVB Saflex Acoustic is represented in Table 2, along with the WLF parameters C1 and C2.
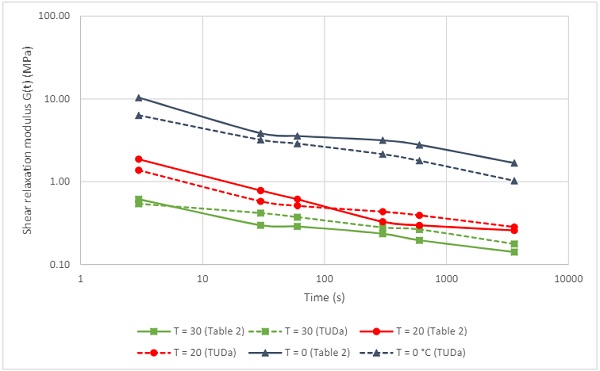
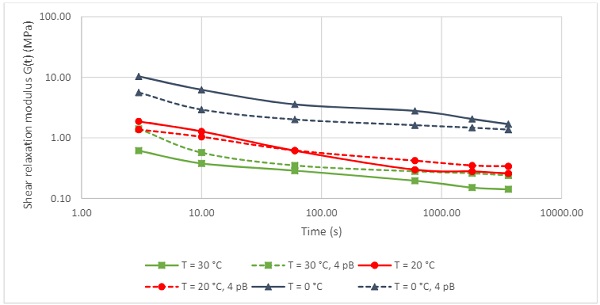
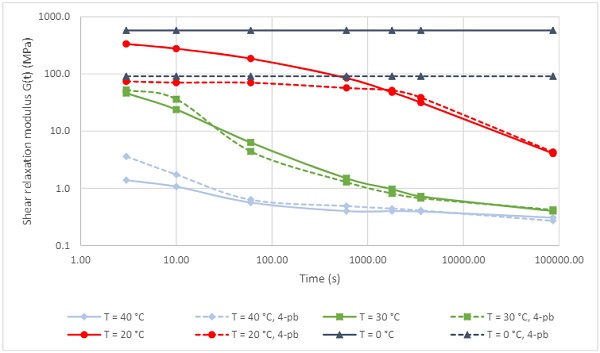
The shear relaxation modulus derived from the model for Saflex Acoustic is plotted in Figure 5 for temperatures of 0, 20, and 30 °C, as well as data from the independently developed model. Relatively low values are observed with this type of interlayer, and plots have been restricted from 3s to 1 hour up to 30 °C to minimize overlap and scaling issues. Over this temperature domain, values for shear relaxation modulus range over three decades.
The shape of the master curve is consistent over both models, and at the reference temperature of 20 °C, the models align well. In some ranges, the effect of two glass transition temperatures is still discernible. The model of Table 3 is more conservative at higher temperatures as compared to the independently developed model, as readily apparent from the 30 °C curve.
Table 2: Model parameters for the evaluation shear relaxation modulus G(t,T) for Saflex Acoustic QS(Tref= 20 °C).
To validate the rheological model of Table 2, additional four-point bending experiments on laminated glass specimens of 360 *1100 mm were executed over this temperature range (detail see previous section). A comparison of the modulus values derived from these measurements is given in Figure 6.
Bearing in mind the specific nature of the trilayer acoustic PVB’s, the very different scales of these experiments, and the significant amount of data processing that is required in both methods for the data generation of Figure 4, the results are in a remarkably narrow range. The model of table 2 is conservative relative to the four-point bending data at temperatures exceeding 20 °C.
3.4. Stiff PVB (Saflex Structural)
Thus far, Prony series for this stiff PVB were restricted to a German national approval (abZZ 70.3-230) (German building Institute 2016) and a single academic publication (Piscitelli 2018). The former provides interlayer properties allowed for design, not necessarily material properties, and the latter used creep relaxation experimentation on multiply laminates, which although feasible, is a labor intensive and time-consuming approach. The Prony series developed for stiff PVB type Saflex Structural using DMA is represented in Table 3, along with the WLF parameters C1 and C2.
Table 3: Model parameters for the evaluation shear relaxation modulus G(t,T) for Saflex Structural DG interlayer (Tref= 20 °C).
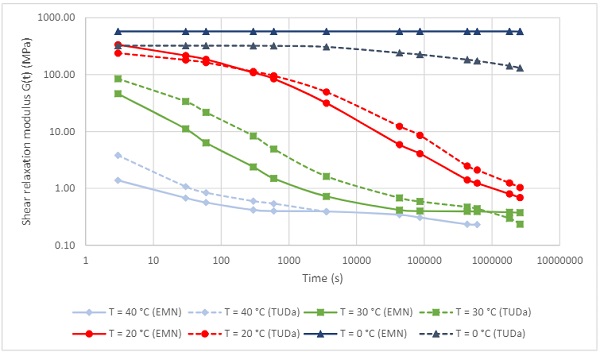
The shear relaxation modulus derived from the model for this Saflex Structural is plotted in Figure 7 for temperatures of 0, 20, 30 and 40 °C, as well as data from the independently developed model (Schuster and Schneider 2019). Over this temperature domain, values for shear relaxation modulus range over four decades. The shape of the mastercurve is consistent over both models, and at the reference temperature of 20 °C, the models align reasonably well.
The model of Table 3 is more conservative at higher temperatures and longer durations as compared to the independently developed model, as readily apparent in the 20 –40 °C range. The largest discrepancy is observed at around the glass transition temperature of 30 °C. Apart from potential differences in samples, equipment and measurement practices, the curve fitting of the temperature shift function plays a major role in the outcome of the models.
In order to optimize fit, a 5th order polynomial function was used for the curve fitting of the external data (dotted lines). In terms of glass design, the less conservative numbers that are generated by the model of Table 3 at low temperatures are unlikely to be critical, as the values exceed the threshold for full shear coupling by a wide margin, at least for durations up to 1 month.
To validate the rheological model of Table 3, additional four-point bending experiments on laminated glass specimens of 360 *1100 mm were executed over this temperature range, for durations up to 24 hours. The details of the experimentation can be found in the references for conventional PVB. A comparison of the modulus values derived from these measurements is given in Figure 8 (note changed scale of x-axis vs. Figure 5). While the exact value of the interlayer modulus cannot be determined above the fully coupled limit using four-point bending, the relaxation behavior of the laminate is very accurately predicted in the 20-40 °C range.
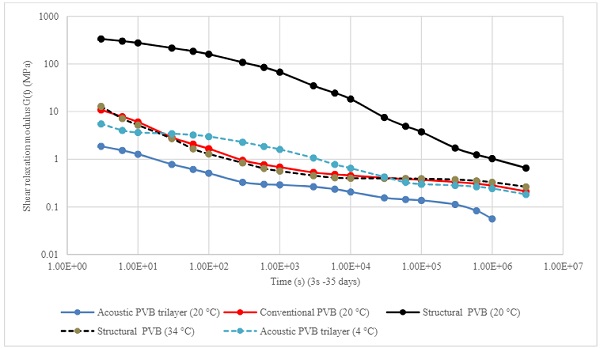
4. Comparison across PVB types, model limitations
With the models for the three different PVB types available, a comparison of modulus properties of these PVB types is readily made. In Figure 9, the generated modulus values are now plotted at the reference temperature of 20 °C for the different PVB types. The shape of the master curve for conventional PVB and structural PVB is very similar, and an additional curve was added for the structural PVB type at the temperature where its rheological properties corresponds most closely to conventional PVB at 20 °C.
This temperature was found to be 34 °C. This temperature difference of 14 °C closely corresponds to the difference in dynamic glass transitions between conventional (Tg ≈ 28 °C) and stiff PVB types (Tg ≈ 43 °C). Using a similar approach for the acoustic trilayer PVB, a corresponding temperature of 4 °C was determined for this PVB type. In this case, the match is not so close because the shape of the curves still echoes the presence of two materials with distinct glass temperatures.
Mathematically, the models developed can be evaluated for any duration and temperature. However, the relaxation times and the number of relaxation times chosen, and the curve fitting,were directed at accurately reflecting changes as relevant for the range of temperatures and duration that glass in buildings routinely experience. Time temperature superposition can only be applied to materials going through a single relaxation process (e.g. glass transition), and care must be taken to not extend the generation of base data outside of this range.
In cases where either the elastic limit state or the viscous limit state is approached, care should be taken to apply these models for the generation of absolute modulus values. In practical terms, the validation of the models can onlytake place over a certain time and temperature range as well. In the time/frequency domain, these models were not developed to accurately reflect the interlayer behavior for very short-term loads (e.g. bomb blast), or very long term loads (e.g. permanent).
In the temperature domain, data can be generated from the models in the range in the 0 to 70 °C range, although the upper and lower limit may differ slightly per product type. The models for conventional and stiff PVB can be considered fully validated for a temperature range between 10 and 60 °C, and durations from3 seconds up to 1 month. For the acoustic trilayer product, the applicable range is more limited to durations of up to 1 hour and temperatures up to 40 °C.
5. Conclusions
Material models for shear relaxation models were developed for all three main commercial PVB types. These models were compared to independently developed models. The model that was more conservative at longer durations/higher temperature was selected for validation with four-point bending experiments at different temperatures. Generically, good agreement was achieved except for assemblies where full shear coupling is achieved. In those cases, four-point bending experiments cannot accurately provide interlayer modulus values.
Although the models can be used to generate modulus values for a wide range of load scenarios, care should be taken to not use load scenarios outside the validated temperature or time range.
6. Acknowledgements
Miriam Schuster (Institute for Statics and Construction, Technical University Darmstadt, Darmstadt, Germany), Michael Kraus, Martin Botz and Alexander Pauli (all Institute of Structural Engineering, University of the German Armed Forces, München, Germany) are gratefully acknowledged for their experimental effort, data evaluation and constructive discussion on the subject of this work.
7. References
Andreozzi, L.,Bari, S.,Fagone, M.,Ranocchiai, G.,Zulli, F.: Dynamic torsion tests to characterize the thermoelastic properties of polymericinterlayers for laminated glass, Constr. Build. Mater 65 1-13(2014).
Association Française de Normalisation, NF DTU 39 Travaux de vitrerie-miroiterie Partie 4: Memento calculs des épaisseurs de vitrages(2017).
ASTM International: ASTM E1300 -12a: Standard Practice for determining the load resistance of glass in buildings (2012).
Bennison, S.J.,A. Jagota, A.,Smith, C.A.: Fracture of glass/PVB Laminates in biaxial flexure, J. Am. Cer. Soc., 1761-1770(1999).
Botz, M., Kraus, M.,Siebert, G.: Sensitivity analysis for the determination of the interlayer shear modulus in laminated glass using a torsional tests, Glass Struct. Eng. 3(2), 355-371(2018).
Botz, M., Kraus, M.A.,Siebert, G.: Experimental determination of the shear modulus of polymeric interlayers used in laminated glass. In: Proceedings GlassCon Global, 31-38(2018).
Bureau voor Normalisatie, NBN S-23-002-2 Berekening van de glasdikte (2016).
D’Haene, P.,Savineau, G.: Mechanical properties of laminated safety glass –FEM study. In: Proceedings Glass Performance Days (Tampere Finland), 594-598(2007).
D’Haene, P.,Stevels, W.:Modelling laminated glass based on multilayer interlayers: effective modulus approach. In: Proceedings GlassPerformance Days (Tampere Finland), 412-415(2019).
European Committee for Standardization: EN 16612 Glass in Building –Determination of the load resistance of glass panes by calculation andtesting (2019).
European Committee for Standardization: EN 16613 Glass in Building –Determination of interlayer mechanical properties (2019).
German building institute: Verbund-Sicherheitsglas aus der Produktfamilie Saflex DG mit Schubverbund. Generic building approval Z-70.3-230,Berlin (2016).
Haerth, M.,Bennison, S.J.,Sauerbrunn, S.: Determination of interlayer mechanical properties for use in laminated glass design. In: Proceedings Glass Performance Days (Tampere Finland), 416-418(2019).
Hooper, P.A.,Blackman, B.,Dear, J.: The mechanical behavior of poly(vinyl butyral) at different strain magnitudes and strain rates J. Mater. Sci47 2564-3576 (2012).
International Organization for Standardization: ISO 6721-10 Plastics –Determination of Dynamic Mechanical Properties_Complex shear viscosity using a parallel plate oscillatory rheometer (2011).
Kraus, M.,Botz, M.,Pauli, A.,Siebert, G.: Investigations on the behaviour of the Saflex PVB in laminated safety glass after glass fracture_Linear Viscoelasticity: Four-Point Bending Tests, Proprietary report (2019).
Kuntsche, J.,Schuster, M.,Schneider, J.,Langer, S.: Viscoelastic properties of laminated glass interlayers –theory and experiments. In: Proceedings Glass Performance Days (Tampere Finland), 143-147(2015).
Kuntsche, J.,Schuster, M.,Schneider, J.: Engineering design of laminated safety glass considering shear coupling: a review, Glass. Struct. Eng.2019-4, 209-228 (2019).
Nederlands Normalisatie-instituut: NEN 2608 Vlakglas voor gebouwen -Eisen en Bepalingsmethode (2013) and revised version in preparation.
Piscitelli, L.: Service ability and post-failure behaviour of laminated glass structural elements, Thesis University of Braunschweig –Institute of Technology (2018).
Schuster, M.,Schneider, J.: Investigations on the behaviourof the Saflex PVB in laminated safety glass after glass fracture Report_Linear Viscoelasticity: DMTA / Rheometer, Proprietary report (2019).
Schuster, M.,Kraus, M.,Schneider, J.,Siebert, G.:Investigations on the thermorheologically complex material behavior of the laminated safety glass interlayer ethylene-vinyl-acetate, Glass Struct. Eng. 3(2) 373-388 (2018).
Stevels, W.: PVB Interlayer Modulus properties in contemporary European standards. In: Proceedings Glass Performance Days (Tampere Finland),56-60 (2019).
Stevels, W.,D’Haene, P.,Zhang, P.,Haldeman, S.: A comparison of different methodologies for PVB interlayer modulus characterization. In Proceedings Challenging Glass 5, Bos, F.; Louter, C.; Belis, J. (eds), Gent(2016).