Authors: Thorsten Weimar & Christian Hammer
Source: Glass Structures & Engineering 7 | https://doi.org/10.1007/s40940-022-00200-1
Abstract
The method of fibre optic strain measurement based on Rayleigh signal analysis enables the detection of the deformation behaviour of laminated glass and the modelling of its load-bearing characteristics. The measurement system is already calibrated for glass surfaces by studies of Chair of Building Structure at Universität Siegen. In addition to discretely measuring systems, such as strain gauges, the distributed measurement system is particularly suitable for the determination of the interlaminar shear modulus. The sensors used in bending tests on laminated glass supplement the deformation measurements taken with strain gauges and inductive displacement sensors. The study describes the results of the shear modulus of viscoelastic interlayers made of polyvinyl butyral and provides the basis to define and evaluate a model for the finite element analysis.
Introduction
General
The origin of the study is the determination of the mechanical properties of polymeric interlayers on a component scale. Previous research on laminated safety glass shows the approximation of the mechanical interlayer properties using discretely measuring sensors such as strain gauges and displacement transducers in standard four-point bending tests (Schuler 2003; DIN EN 16613, 2020). Values of elastic modulus and shear modulus are calculated by using well-known deformation theories of common composite structures (Altenbach 1993). However, the load-bearing behaviour must be known to apply these theories within their validity limits. If the load-bearing behaviour when subjected to a bending load does not clearly allow a theory, such as the plate theory or sandwich theory, the entire deformation state, stemming from a few, discrete measured values, can only be determined with inadequate precision.
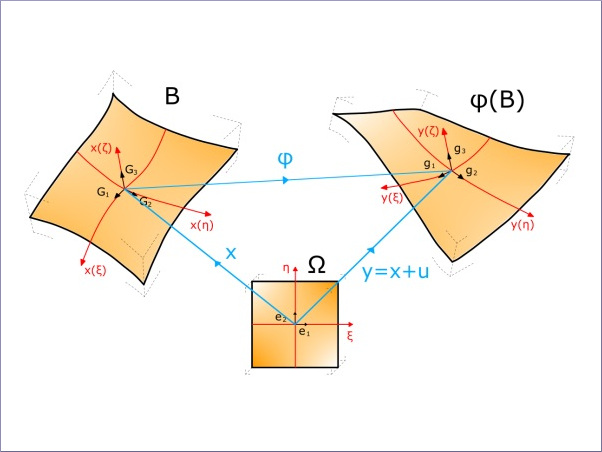
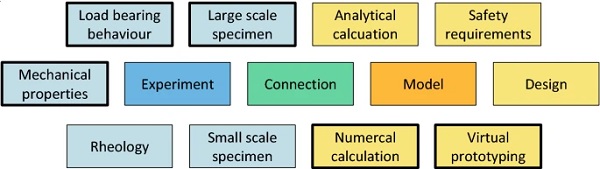
Current research on calculation methods and development of laminated glass deals with various disciplines as shown in Fig. 1. Especially the interlayer properties are examined by the dynamic-mechanical-analysis to define the rheology such as phase transitions as well as the time- and temperature depending on stiffness. Small specimen tests are given by the standard tensile test (DIN EN ISO 527-1, 2012) and various shear tests (Weimar 2012; ASTM D 4255, 2007).
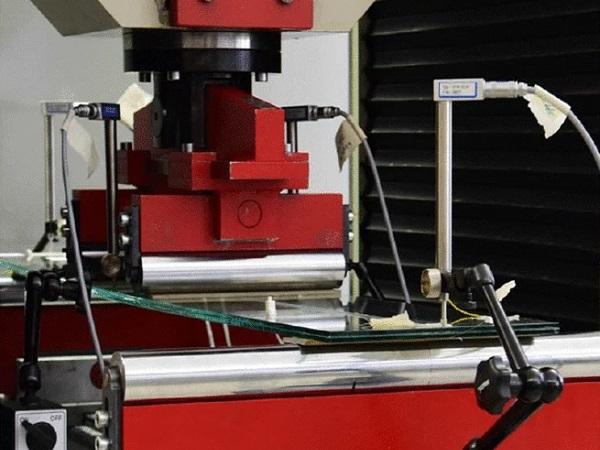
A third common way of determining the mechanical behaviour of interlayers is given by the large-scale test or component test. These tests are recommended for both the determination and the evaluation of the materials behaviour in combination with glass and a multiaxial state of internal stress. Therefore, the study is focussed on advanced standard component tests using an innovative measurement system. The accentuated aspects of the graph in Fig. 1 are of interest in actual and further work. Tests on large-scale specimen are applied to get a sufficient match between experimental and calculated results.
As the material parameters of the interlayer in the component test can be determined, based on test results, local, densely distributed measurement points represent an advantage.
Determining the load-bearing behaviour of composite glass requires an adequately precise model of structure and materials. Completed investigations with laminated glass show that the structure can be very well approximated with models according to the finite element analysis by element and network studies. The isotropic glass can be illustrated with adequate precision owing to the linear-elastic stress–strain behaviour. In contrast, there is the complex, primarily non-linear behaviour of the polymer interlayers, which is the subject of numerous investigations (Schneider et al. 2016; Kraus et al. 2019; López-Aenlle et al. 2019; Schuster 2021). For this reason, innovations in terms of experimental investigations for capturing the deformation values are helpful when trying to improve the illustration of the behaviour of polymer interlayers, particularly in the laminated state.
The distributed measuring of surface strain components other methods of characterising interlayer materials such as the dynamic-mechanical thermal analysis (DMTA) (DIN EN ISO 6721, 2011) as well as small-scale tensile and shear tests. In addition, the distributed measurement of surface strain in a large-scale bending test offers a suitable method for the determination of material parameters such as the elastic modulus and the shear modulus. The measurement applied in this study is mainly used for the examination of the load bearing behaviour of laminated glass panes. It does not replace methods like dynamic-mechanical thermal analysis (DMTA) or temperature- and time-controlled tensile test which are also useful to describe the rheological behaviour of polymeric materials.
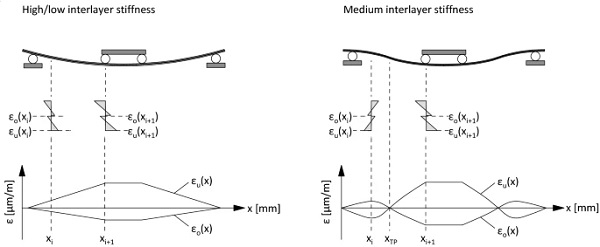
Discretely measured values of strain at the position x1 and x2 do not enable to define the interim values in the range between the measuring points adequately. The derivation of the elasticity based on selected values of strain cannot be used for a sufficient accuracy of the interlayer stiffness in connection with glass panes. Figure 2 shows generally different deflection curves of laminated glass panes due to various interlayer stiffness. Interlayers with medium stiffness result turning points in the bending line caused by the locking effect beyond the support rollers.
In this study the results from shear tests on small test specimens are compared with the results from bending tests with large test specimens. In this context, the interlaminar shear modulus of the polymer interlayer is determined and the discretely measuring strain gauges are compared with continually measuring fibre sensor applications. First, the object of the investigation is the intermediate layer made of polyvinyl butyral at one temperature. The procedure shown can generally be transferred to other interlayers and temperatures.
Fibre-optic strain measurement
The elasticity of materials and structures is investigated by various measurement systems. In case of strain measurement, a couple of methods are established in research and development as shown in Fig. 3. The Digital Image Correlation (DIC) based on photogrammetry is suitable to determine the surface strain during standard tensile test as well as in deformation test on complex curved structures. Fibre optic sensors offer the measurement of strain on the outer surface of specimen as well as embedded into composites to locate stress peaks or defects. Strain gauges provide the high-precision determination of strain on the outer surface of specimen as well as embedded into composites on selected points of the specimen.
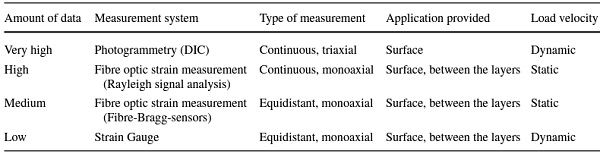
The general difference between the measurement systems consists in the amount of data, the applicability in between of composite structures and the possible load velocity. Regarding to the investigation on the mechanical behaviour of interlayers, the fibre optic strain measurement based on the Rayleigh Signal Analysis provides a suitable system for both measuring strain in between the interlayer and with a minimal distance between the values along the measurement section. Table 1 gives an overview of selected systems depending on the parameters local resolution, type of measurement, application provided and load velocity.
Table 1 Comparison of selected measurement systems for the investigation of strain - Full size table
Fibre optic strain measurement are applied in various disciplines concerning the determination of the mechanical behaviour of structures such as geotechnics (Habel and Krebber 2011), reinforced concrete (Hegger et al. 2021; Galkovski et al. 2021), composite components in light weight structures as well as adhesive joints (Luyckx et al. 2011). Both the location of stress peaks in context of internal imperfections or cracks and the stress monitoring in long term tests. Regarding to fibre optic measurement, a distinction is made between two systems. The fibre optic measurement based on the Bragg scattering uses pre-assembled fibre sensors with equidistant Bragg gratings. The measurement applied in Hegger et al. (2021) or in Galkovski et al. (2021) as well as in this study utilises fibre sensors based on the Rayleigh signal analysis.
In the field of laminated glass the investigation of residual internal stress in cold-bent glass structures is given by Fildhuth and Knippers (2014) using fibre Bragg sensors. The Bragg sensors represent a suitable measurement system to investigate very large component test focussed on stress peaks and the progression of strain on large measurement sections. The fibre optic sensors based on the Rayleigh signal analysis enables high resolution of strain along the fibre axis with a distance between the measuring points of less than 1 mm. That enables the measurement of sections with high gradients of strain as well as the accurate determination of strain values on short sections. Especially the derivation of the interlayer stiffness based on the progress of strain in bending tests in a quantitively way requires a high amount of data.
As well as strain gauges which are used as standard to record local strain, continually measuring fibre-optic sensors (FOS) can generally also be used (Samiec 2011). Semi-continual strain processes at the interfaces in the composite section enable an improved determination of the material parameters of the interlayer in the component test. The glass fibre sensors with a total diameter of 0.16 mm, which are applied to the surface of the glass using a suitable acrylate adhesive, are elongated or compressed parallel to the surface. The strain on the glass surface measured in the fibre axis is converted using the rigid connection of the fibre core with the measurement object. This assumption of the rigid connection is permitted for strains within the range of ± 500 µm/m and the adhesive used.
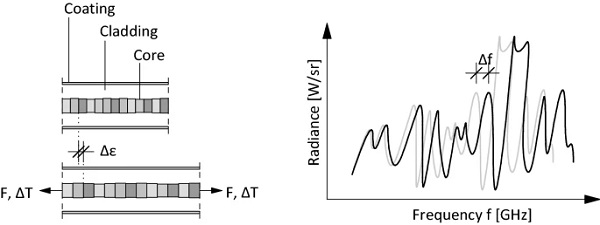
A coherent optical frequency domain reflectometer (OFDR) is used to characterise glass fibres readily available on the market with regard to the intensity changes in the Rayleigh scattering. Manufacture-related variations of the fibre core refractive indices cause fluctuations of the Rayleigh scattering intensity (Froggatt et al. 2006). Depending on the frequency of the back-scattered light, the intensity can be illustrated in a constant, characteristic frequency pattern for each defined fibre section. The alteration of the external effects, such as strain induced by temperature or stress, provokes a length change of the fibres and thus a shift of the frequency pattern, which is converted into strain and temperature values by using the corresponding correlations. Figure 4 shows the extension of the refractive indices and the associated shift in frequency.
The conversion of the frequency signal in GHz for the temperature measurements in K is based on a non-linear connection between the measurement signal and temperature, which can be described with a fourth order polynomial. The coefficients of the polynomial are defined in an experiment according to Froggatt et al. (2006). In the case of strain measurements in the static load test, there is a linear connection between the measured frequency shift Δf and fibre elongation Δs or compression. The proportionality factor between frequency and strain determined in previous investigations is specified as 6.58 µm/(m GHz). The temperature-induced elongation has to be separated from force-induced elongation of the fibre in test with variable temperature. In this study the investigation on the polymeric interlayers is examined at constant temperature. This causes the elongation of the fibre sensor as a result of both tensile and bending stress on the glass surface without temperature effects. The measured values of the surface strain are exclusively caused by deformation of the test specimen.
Application on monolithic glass specimen
Determining the strain coefficient
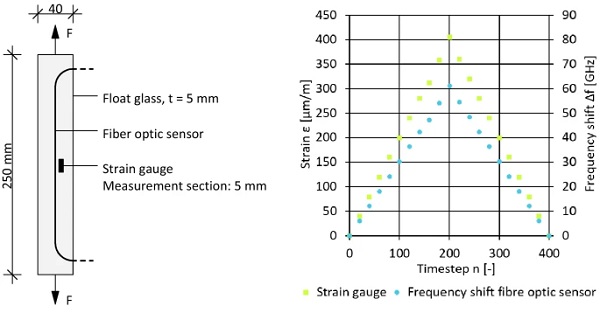
The strain coefficient is determined by a tensile test with three test specimens made of float glass referred to DIN EN 572-2 (2012) with a size of 40 mm by 250 mm and a thickness of 5 mm. Uniaxial strain gauges are applied parallel to the bonded fibre. The measuring section of the fibre is positioned at the same height as the strain gauges. Figure 5 shows the experimental set-up and the curve of recorded surface strain values in tensile tests using strain gauges and fibre optic sensors in intervals of 25 time steps and a measuring rate of 1 Hz.
The oxygen-curing cyanoacrylate adhesive applied, generates a stiff and elastic connection between glass surface and standard polyimid-coated fibre as it can be applied in telecommunication systems. The fibre is not preconditioned for the measurement. The difference in displacement between glass fibre and the adhesive matrix is insignificant, with an expected expansion spectrum of around 500 µm/m. In cyclical, path-controlled tensile tests with a rate of 0.01 mm/min and a maximum load up to strains of 405 µm/m, compressive stresses in the fibre in the range of 4 µm/m remain even after relieving due to the irreversible slip between fibre coating and adhesive down to 6 µm/m. Using linear flaw distribution in the expansion spectrum, this corresponds to a deviation of approximately 1.5%.
The strain coefficient is expressed by the quotient of strain-to-frequency. The tensile tests find it to be 6.61 µm/(GHz m). This agrees with the strain coefficient determined on aluminium samples for the pure glass fibre, which is 6.58 µm/(GHz m), deviating by just 0.45% (Frogatt et al. 2006). Under tensile stress, this means that 99.6% of the strain is transferred from the glass surface to the glass fibre.
Conversion of fibre strain to surface strain
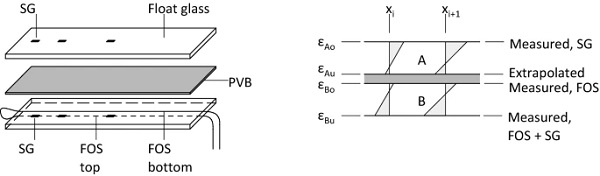
Due to the distance between the fibre axis and the glass surface, measured strain values have to be adjusted in the case of variable strain through the height of cross-section. Starting from a full transfer of the strain between the glass fibre and the glass surface, the surface strain is determined by linear interpolation. The two limit states of constant stress and variable stress in the glass layer are considered with a maximum gradient. As shown in Fig. 6, the correction results in the ratio of the edge expansion. If the expansion ratio changes over the measuring section due to various bond properties between the layers, the correction is given as a function of the expansion ratio depending on the measuring location.
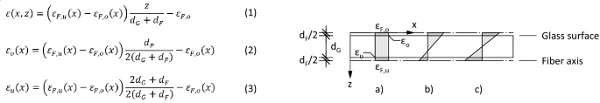
Geometric analysis gives Eqs. (1)–(3), which provide corrected strain values based on the values measured from the fibre axis and coordinate system defined in Fig. 3. The strain at the top edge, εo, results from Eq. (2), whereas the bottom edge strain εu, comes from Eq. (3).
A higher strain gradient means that the deviation between measured and surface strain values increases. If the ratio of top strain, εF,o, to bottom strain, εF,u, changes along the length of the fibre, the values are corrected along the entire measuring section. Figure 7 includes the test setup of the bending test on a pre-stressed monolithic glass pane with a nominal thickness of 10 mm. The results show a good match between the values measured by strain gauges and fibre sensors (Weimar and Hammer 2020).
Experimental study on laminated glass
Principles
As the material parameters to be derived from the measurement results in the bending test are evaluated with models according to the finite element analysis, analytical processes which cannot be clearly allocated to the existing structure in advance, and which capture the present discontinuities in the border area and load introduction area with only inadequate precision do not take place.
The lamination process is a non-autoclave process using a panel compound system including the vacuum bag process using a silicone membrane. The lower glass panels are positioned in place on a bottom heating plate, while the upper glass panels are later placed on the interlayer. The de-aeration is provided by a technical vacuum in the range of − 800 to + 900 hPa using the silicone membrane. During the lamination process the pressure on the top and the vacuum on the bottom of the membrane initiate edge stress on the glass-interlayer composites. Sensors applicated at the top will be severely bent at the edge and thus become damaged. During the manufacture of laminated glass, the highly sensitive glass fibres are therefore only located on both surfaces of the bottom glass pane.
As the measurement values of the strain gauges on bottom of the composite cross section quantitatively exactly match the measurement values of the fibre optic sensors in the load spectrum investigated, individual strain and stress values in the thickness direction can be defined with the equilibrium conditions at the composite cross section. Strain gauges on top of the composite panel are used in addition to monitor the validity of system-inherent linearity. The state of pure bending causes a symmetric progress of internal stress along the cross-section height. The limit of deflection during the bending test is given by the limit of conformity of the strain on both sides of the composite panel. Regardless of the load-bearing behaviour of the overall structure, this observation applies to adjacent measurement points with an infinitesimal distance on the longitudinal axis.
As the values of the continually measuring fibre optic sensors exist as a closed line according to the data processing, strains at any point on the longitudinal axis and across the cross section height can be calculated. The influence of the principal bend stress in the transverse direction is negligibly low for test specimens with a smaller width in the sense of the uniaxial bend. In Fig. 8, the left side shows the arrangement of strain gauges and fibre optic sensors, and the right side shows the composite cross section with the different distribution of strain.
In the case of unknown behaviour of the polymer interlayer under static load, we can generally assume a gradation of rigidity, in a way that areas with greater rigidity also store more deformation energy. Depending on the rigidity distributed over the component axis, both the stress state and the deformation figure are generated. Based on this, a linear connection between stress and strain as a basis for the interlayer, as well as the assumption of an ideal-elastic, time-independent material behaviour, present a special case which can be ruled out.
The time, temperature and strain-dependent mechanisms of relaxation or retardation, hardening and flowing, which act simultaneously, must be weighted differently in the modelling of polymer materials (Grellmann and Seidler 2015). Based on previous investigations, a linear-viscoelastic material behaviour can be assumed for thermoplastic interlayers such as polyvinyl butyral. Polyvinyl butyral partially dissipates the stress energy which builds up at the beginning of the load by converting it into friction heat which is linked with irreversible deformation under long-term load conditions. The behaviour of linear-viscoelastic material, dependent on both time and strain, can be described using the Boltzmann superposition principle (Sackmann 2008).
The interlayers such as polyvinyl butyral (PVB), ethylene vinyl acetate (EVA) and thermoplastic polyurethane (TPU), frequently used in the production of laminated glass, each have a characteristic behaviour depending on time, temperature and strain. The mechanical parameters represent the relaxation or retardation modules depending on load duration and strain (Rösler et al. 2008). When comparing tensile and shear tests with small test specimens and bending tests with large test specimens, elastic module as well as shear module serve as a function of strain or shear angle, as well as load duration.
Mechanical tests on interlayer material
In this study, the parameters of bend-loaded components made of laminated glass using models according to the finite element analysis are evaluated using fibre optic sensors, which enable an extended illustration of the test specimens in the bending test. The test specimens for the shear and bending tests have an interlayer made of polyvinyl butyral (Trosifol® Clear/UltraClear 2019) with thickness of 1.52 mm. In all tests, the intention is to have three test specimens with float glass made of soda-lime-silicate glass (DIN EN 572-2, 2012), each of which run through five load stages at a constant temperature.
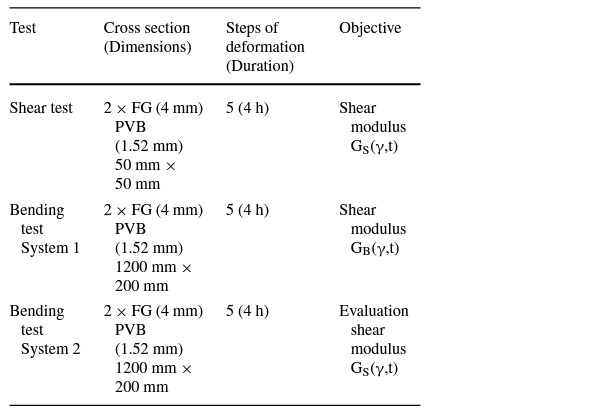
The influence of temperature fluctuations is ruled out by constant climatic conditions with a temperature of (+ 23 ± 1) °C and a relative humidity of (55 ± 5)%. The simultaneous action of relaxation and retardation are generally specified by the shear modulus as a function of time and the shear angle. Table 2 compiles the test programme with the respective test aims. The small test specimens for the shear tests and large test specimens for the bending tests are produced under identical process parameters.
Table 2 Overview of test specimens and their constitution of float glass (FG) and the interlayer polyvinyl butyral (PVB) - Full size table
Shear test as relaxation test
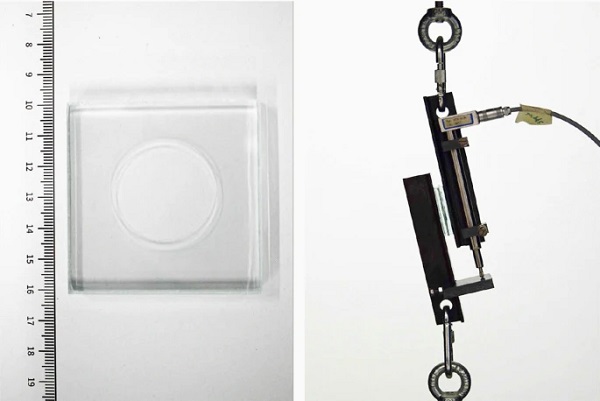
The shear test is carried out on the laminated, circular sections of polyvinyl butyral with a diameter of 25 mm and a thickness of 1.52 mm, set between two sheets of float glass with a thickness of 4.0 mm. The small test specimens with the dimensions 50 mm by 50 mm are fixed rigidly to the steel support profiles with a two-component adhesive, in the basis of the shear test described in ASTM D 4255 (2007). Deviating from the standard, the test specimens are not screwed but bonded to flat steel surfaces using a high-strength two-component epoxy adhesive. The test setup depicted in Fig. 9 generates an almost pure shear stress state in the test specimen due to the freely twistable mounting. The movement difference is measured with an arranged displacement transducer.
The shear modulus is determined gradually in a path-controlled relaxation test. The applied initial deformation generates the defined shear angle in five stages from 0.1 to 0.5 rad. At each deformation stage, the decreasing restoring force is recorded up to a load duration of 4 h. Figure 10 shows the matrix with shear modulus depending on time and shear angle. The shear modulus increases until the investigated shear angle of 0.5 rad and decreases continually over the load duration.
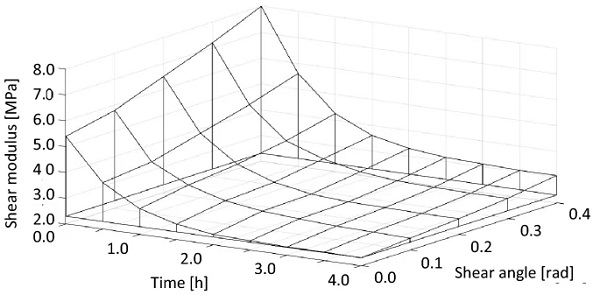
In the four-point bending test, the deformation of the polyvinyl butyral interlayer does not reach the flow range when the boundary stress for the strength of the float glass or a low load speed are reached. As the movement difference between two glass panes is also below the distortion limit of 0.5 rad in the case of very large deflection in the geometrical non-linear area, the presentation for the shear modulus is limited to this value.
Bending test as relaxation test
To investigate the load-bearing behaviour at component scale and to determine the interlaminar shear modulus, in this study the uniaxial four-point bending test is used on laminated glass panes with a length of 1100 mm and a width of 200 mm. Using a narrow beam nearly prevents the influence of transverse deformation and biaxial stress in the interlayer as found in plates. The cross section structure is comprised of two float glass panes with a nominal thickness of 4.0 mm and a measured thickness of 3.85 mm and an interlayer made of polyvinyl butyral with a nominal thickness of 1.52 mm and a measured thickness of 1.44 mm.
Based on the moderate stiffness of the selected interlayer, a change in curvature occurs in the bend line which results from the locking effect of the unloaded cantilevers. This effect increases with the increasing cantilever extension of the test specimens over the support. To demonstrate the effect over the course of the interlaminar strain, the distances of the supports are modified to a cantilever extension of 150 mm, deviating from the standardized test according to DIN EN 1288-3 (2007).
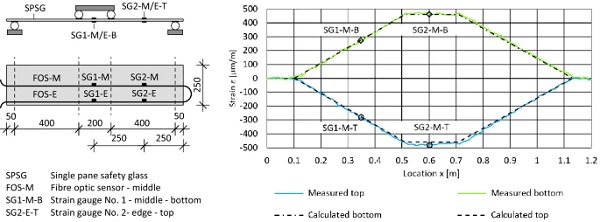
The shear modulus determined in the first test is transferred onto a deviating support system for the four-point bending test by way of the asymmetrical shift of the support rollers in the second test and evaluated. Figure 11 states the geometries of both versions. The strain gauges are applied firmly at three positions of the laminated glass pane. They are each applied in pairs to the top and bottom of the laminated glass at three positions with a minimum distance of 50 mm from the points where the load is introduced. Position 1 is 100 mm from the left edge, position 2 at a distance of 400 mm and position 3 at a distance of 550 mm.
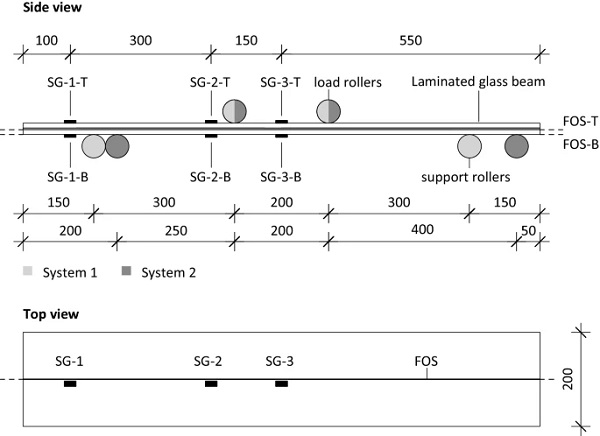
Figure 11 shows the position of the strain gauges and the position of the support and load rollers for both versions of the four-point bending test.
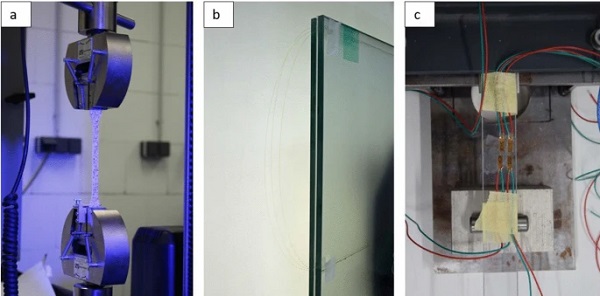
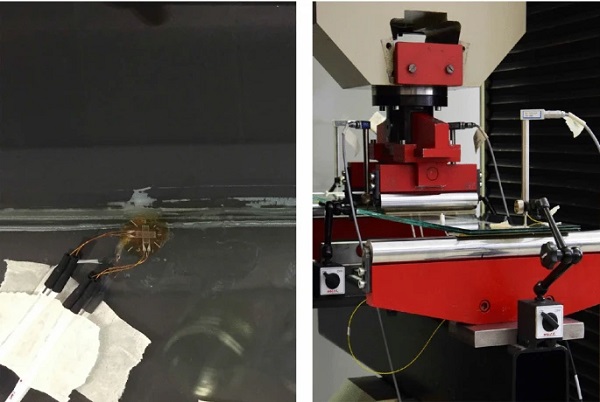
The tests are first carried out in a strain-controlled manner until the defined strain of 350 µm/m on the glass surface in the centre at position 3 as the initial distortion. Then, the individual deformation stages are carried out at an interval of 50 µm/m. The intermediate values along the test specimen axis result from the strain process of the fibre optic sensors. Figure 12 shows the glass surface on the bottom of the test specimen with the fibre optic sensor and strain gauges on the left, and the test setup for version 1 of the four-point bending test on the right.
Displacement traducer, strain gauges and fibre optic sensors are used to measure the deformation values. Due to the continual process of strain in the layer boundaries, the shear angle and shear stress along the component axis can be measured and correlated with the values from the shear test for selected points of time and, if applicable, compiled to create a new characteristic diagram.
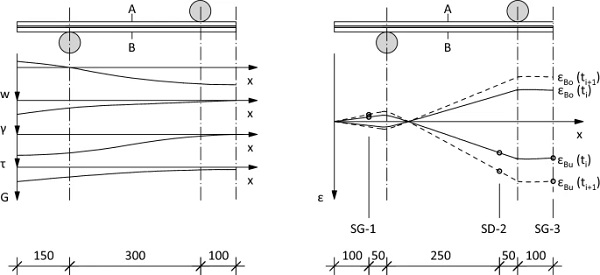
The deformation-dependent strength of the interlayer results in a process over the component axis. As the load duration increases, the compound effect between the glass panes decreases, as a whole, which generates the shift of the edge stress from the external to internal glass surfaces. Figure 13 shows the connection between the deformation values and interlaminar shear modulus on the left, and the measurement values from the strain gauges and fibre-optic sensors at various points in time on the half system in a qualitative manner.
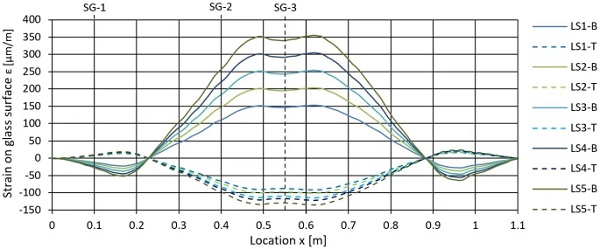
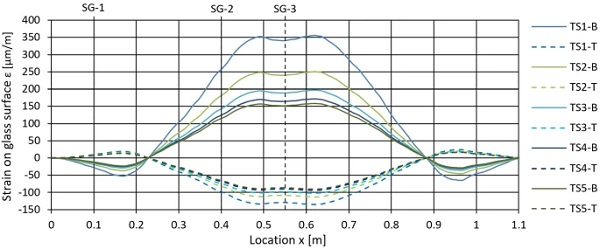
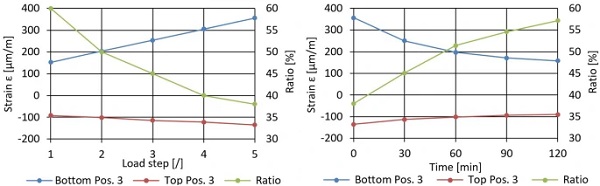
The strain measured during the relaxation bending tests are shown in Figs. 14 and 15. The theoretical distance of the measurement points is in the range of 0.5 mm. The strain measured on both the bottom and the top surface of the lower glass pane is given at the beginning of each load step with a distance of 50 µm/m. Figure 16 shows the measured strain at various load and time steps with a distance of 30 min. The Figs. 14 and 15 describe the behaviour of the interlayer depending on deformation and time. The shown data represents the minima and maxima of the strain process.
The variation of the interlayer stiffness during the tests causes the stress redistribution in the class panes. The strain measured at consistent deformation steps shows a decreasing ratio between internal glass surface and the external glass surface. However, the measurement at consistent time steps shows an increasing ratio between the internal glass surface and the external glass surface. Both document the known load- and time-dependent behaviour of polymeric interlayers, which on the one hand show increasing stiffness with increasing load and on the other hand decreasing stiffness in long-term tests.
Modelling and evaluation
The four-point bending test is modelled by the programme Ansys 19.0 using shell elements for glass panes and solid elements for interlayer. The shift between the glass panes is given by the interlayer stiffness. However, the displacement of the glass panes, which is based on the sliding between the interlayer and the glass surface, is excluded in the model. The material properties for glass with the elastic modulus of 70,000 MPa and a radical strain coefficient of 0.23 as well as for the intermediate layer made of polyvinyl butyral are defined in the same way as the characteristic diagram stated under 2.1 on a matrix basis.
An elastomer with a hardness of 40 IRHD is arranged between the support and load rollers and the glass in order to avoid stress concentrations. The resulting non-linear contact problem is indicated by the increase of support area with increasing load and the simultaneous hardening of the elastomer. The flexibility determined in previous tests is considered in the numerical calculation as a linear descending spring.
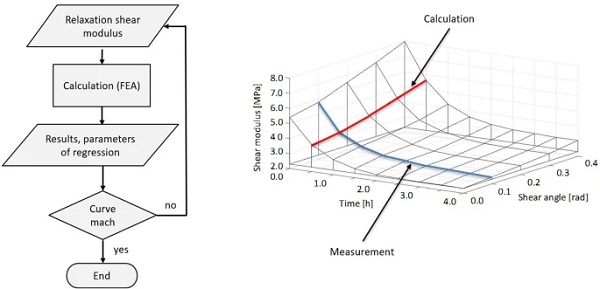
The iterative determination of the interlaminar shear modulus is given by a simple loop that convergences well until the calculated and measured strain match with a sliding average deviation of ± 2%. First the recorded time-dependent measurement from the bending test on system 1 at one load step is implemented into the software. As the shear modulus of the interlayer depends on the shear angle, the function of the shear angle G(γ,t = const) has to be approximated by a polynomial third order regression to describe the process of the shear angle along the beam axis.
Figure 17 shows the calculating procedure assigned to the map of the time- and force-dependent interlaminar shear modulus. The time-dependent data from the measurement at one load step is the basis for the iteration represented by the blue line in the graph. The approximated values for the increasing shear angle are approximated by variation of the parameters of a polynomial third order regression, represented by the red line. The target criterion of the procedure is exclusively the strain curve on the surfaces of the bottom glass pane. The shear angle is given by the calculated shift difference between both glass panes in the finite element model.
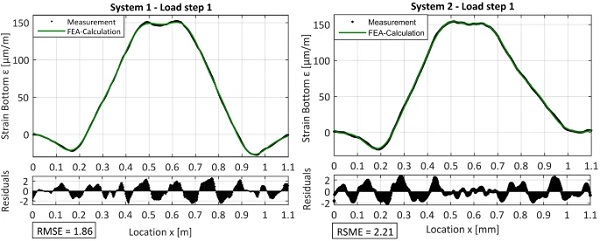
The calculated results are evaluated on the glass surfaces along the central longitudinal axis of the test specimen. The successive variation of the shear modulus, derived from the determined measurement values from the shear test up to the lowest deviation with the measurement values from the bending test with system 1 leads to the values of the interlaminar shear modulus stated in Table 3. Figure 18 shows the measured strain at the bottom of the lower glass pane versus the calculated strain at the same position in the finite element model. The Root Mean Square Error (RMSE) represents the quality of the model including the determined shear modulus.
With values in the range of 2 the calculated shear modulus corresponds well with the state of internal stress. System 2 used for the evaluation shows a higher deviation from the measurement. In particular, areas with high gradients of strain show the greatest deviation. The selected graphs show system 1 at load step 1 and system 2 at load step 1. Both the symmetric and the asymmetric system which is used for the evaluation show a sufficient match between measurement and calculation. The deviation between measurement and calculation is probably caused by measurement uncertainty as well as an inaccurately model. Furthermore, the local minimum between the load rollers is due to a two-axial state of stress that increases with increasing load. The intention of a pure monoaxial bending is not entirely given in the experiment.
Table 3 Comparison of experimental and calculated values of the shear modulus of polyvinyl butyral (PVB) as interlayer - Full size table
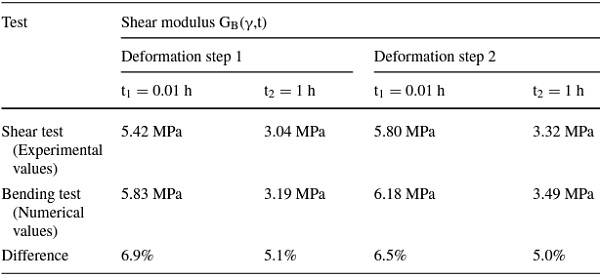
A selection of values based on the component test are compared with values from the small-scale shear test. In general, the values from the shear test with small test specimens deviate by between 5 and 7%. The shear test thus provides a lower shear modulus than the bending test, and thus presents the polyvinyl butyral interlayer as softer. The interlaminar stiffness described by a single elastic parameter like the shear modulus also does not completely map the effects of locked transverse elongation in the composite beam as well as stress peaks in the edge area.
Compared with the individual values of the strain gauges, the continually measuring sensors capture local strain changes as well as the curvature change in the bend line. When using only strain gauges, this can only be achieved with a great deal of effort. The transfer of the same characteristic values onto system 2 provides a good match of the measurement values, shown in Fig. 18. The local deviations between the measured values and the calculated ones are due to measurement inaccuracies and local strain maximums in the discontinuity areas of the load and support rollers.
Summary and outlook
The semi-continual strain measurement with fibre optic sensors made of glass fibres enables the capture of the time and deformation-dependent mechanical behaviour of polymer interlayers in laminated glass. The material parameters are first defined in shear tests with small test specimens, and then in a bending test with large test specimens at component scale. In all, the shear test presents the interlayer softer, but, as an able starting point, it is well suited to the successive variation of the shear modulus in the numerical calculation following the finite element analysis.
Deriving the interlaminar shear modulus from the four-point bending test in the numerical calculation provided a sufficient match with the asymmetrical versions used for the evaluation. Determining the interlaminar shear modulus exclusively with locally arranged strain gauges is problematic in the case of interlayers with moderate hardness, as the curvature change in the bend line influences the strain process. In further studies, the modulus functions for different materials in the interlayers must be developed, considering the temperature. In this context, the separation of load- and temperature-induced elongation of the fibre sensor is to be investigated as well. The comparison and correlation between parameters from static and dynamic tests remain the focus of future experimental investigations.
References
Funding
Open Access funding enabled and organized by Projekt DEAL.
Author information
Authors and Affiliations
Chair of Building Structure, Universität Siegen, 57068, Siegen, Germany
Thorsten Weimar & Christian Hammer
Corresponding author
Correspondence to Thorsten Weimar.