Abstract
This is the promised follow-up to my 2017 GPD presentation on HACI (Haze, Anisotropy, Clarity, Interference) with the latest technical and research updates as well as a status on the ASTM anisotropy task group activities.
Since 2017, our experiments and research have led us to focus on anisotropy. Discovering that stiff interlayers can become anisotropic helped us in solving the haze and clarity issues. Here, I summarize the Cupertino summit: a one-day meeting, hosted by Apple, where 31 scientists and stakeholders from around the world congregated. This served as a kick-off meeting for the ASTM task group on anisotropy measurement. I present the status of our task group after 8 meetings. Finally, you will see what are the next steps and challenges in that field.
After attending my presentation, you will know more about the physics behind anisotropy, and who manufactures the scanners. You will also have a pretty good idea about the upcoming ASTM standard.
1. Definitions
1.1 Index of refraction
Light travels in vacuum or air at the speed of C = 300 Mm/s (Tokyo-LA is 9 Mm). Light moves slower through water or glass because more particles get in its way. Each time a photon hits a particle, the light gets absorbed, the particle vibrates, and then the light gets re-emitted; all this takes time. In glass, the speed drops to 200 Mm/s.
The ratio C/V is called the index of refraction (n). For float glass, it is about n = 300/200 = 1.5
1.2 Isotropy
Vacuum, water, air and annealed glass are isotropic. They exhibit properties (such as velocity of light transmission) with the samevalues when measured along axes in all directions. In an isotropic body this refraction index is constant regardless of the direction of propagation or plane of vibration.
1.3 An·isotropy
Wood splits easier in the grain direction: it is anisotropic. It exhibits properties with different values when measured in different directions. Many materials, like glass and plastics, are isotropic when unstressed but become anisotropic when stressed.
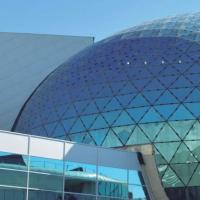
Anisotropy creates a visual effect because of the presence of polarized light, the birefringent property of the glass and the mechanical stresses in the glass due to heat treatment.
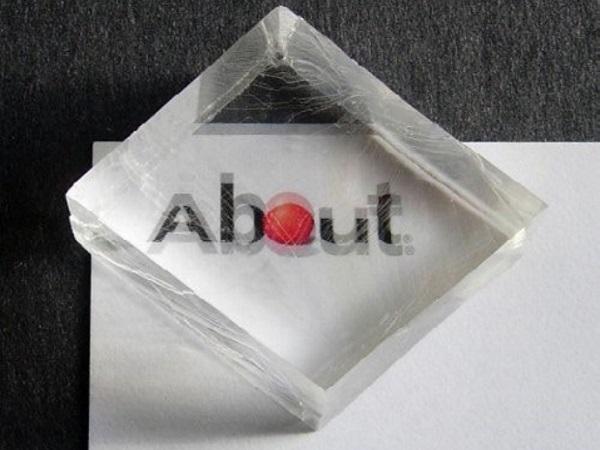
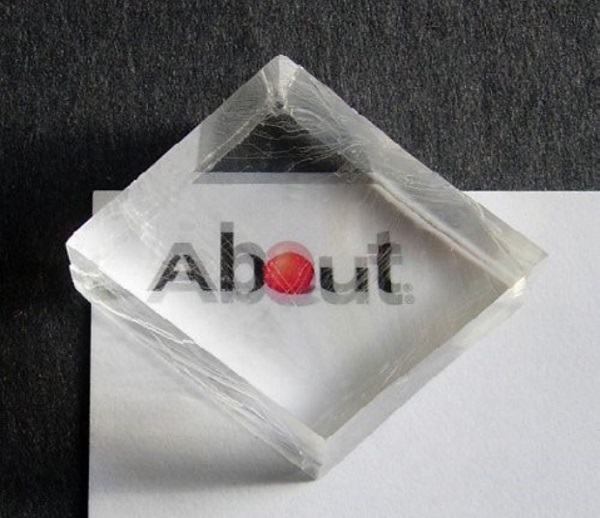
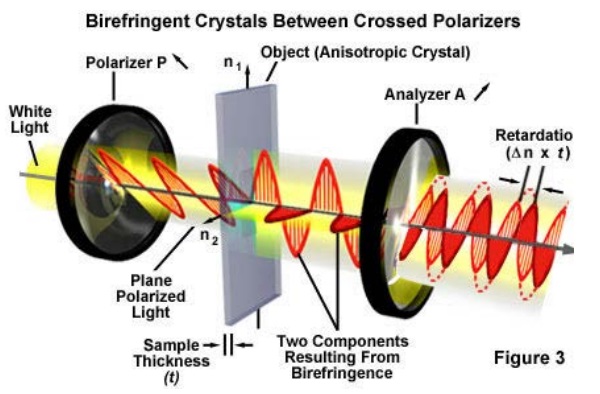
1.4 Birefringence
Birefringence is the physical property that explains the patterns that we see on glass in a polarized light environment. The propagation velocity depends on the polarization direction of the light wave. When the refractive index is no longer constant, the effect of birefringence is observed. Certain crystals, like calcite, are said to be birefringent, they show optical anisotropy. Float glass is optically isotropic, but becomes optically anisotropic under load or stress.
The change in index of refraction is a function of the stresses. When heat-treating glass or cooling interlayers, we create zones that have different refraction indices and this induces optical retardation.
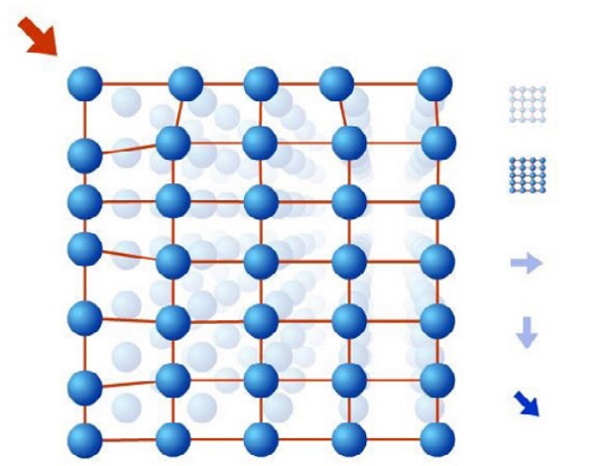
1.5 Retardation
In a birefringent material, the polarized light waves propagate perpendicular to each other and in the parallel main stress directions at different speeds. The result is an optical path difference, or optical retardation, between these two light waves.
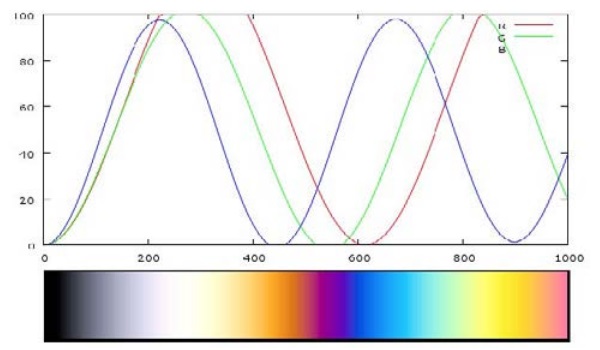
Measured retardation in a specimen depends on the stress-optical-law: the wavelength, the stress-optical constant of the glass, the stress difference of the principal stresses and the mechanical length of the path through the glass. Under (partially) polarized daylight, these retardations and the light spectrum can lead to color effects (iridescence) visible to the human eye.
2 Cupertino Meeting
2.1 Stakeholder
An exhaustive study of European and British standards and industry guidelines was presented at GPD 2015. “Anisotropy is clearly recognized as an inevitable effect of the heat treatment processes by current British Standards” (Pasetto, 2014). The same wording exists in North American standards C1048. In Cupertino, Mr. Pasetto stressed the need for the industry to come forward with objectivity, measurements and the will to change standards. In his work with a worldleading project development and construction group, he encounters an increased number of undeliverable specifications, protracted qualifications and costly legal disputes.
2.2 Existing standards
ASTM already has many standards that deal with anisotropy and photoelasticity:
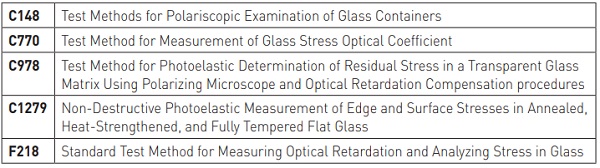
Some of those standards are very basic and were developed in an analog era. Others allow for precise measurement of birefringence, but only in small localized areas. With the developments in imaging and computing capabilities, we can now envision precise measurement of retardation on a large zone with minute resolution. Moreover, when developing a standard, we need to address the fundamentals: calibration, repeatability and accuracy.
2.3 Research
Marcus Illguth and Christian Schuler worked together at Munich University of Applied Sciences on what we consider the most authoritative paper on our subject (M. Illguth, 2015). Mr. Schuler also worked with RWTH Aachen University. They present their work in full-surface quality control and evaluation by using photoelastic methods (Benjamin Schaaf, 2017).
Findings from these recent research activities show that optical retardation measurement using RGB-photoelasticity is a right tool to quantify the anisotropies with a physical measurement unit: nanometer (nm). Polariscope images are converted into full-field determination of retardation, then statistically evaluated.
Christian Schuler continues to investigate factors that influence anisotropy: glass thickness, coatings, superimposed glass panes, furnaces vs. patterns. He attempts to characterize the pane using quantile value, isotropy value and textural features. He even conducted field studies with control groups.
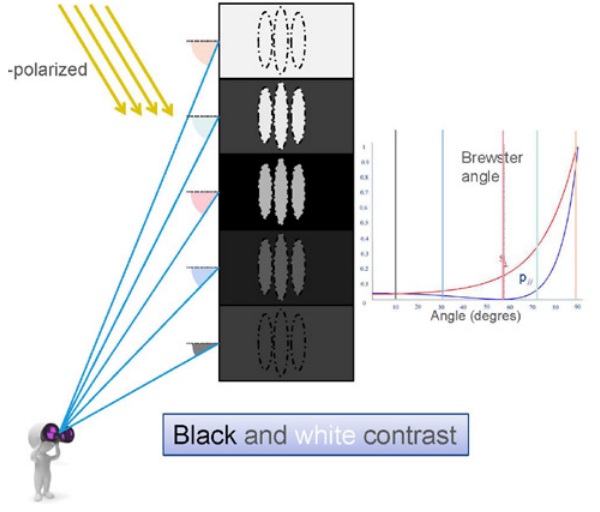
On the industry side, Saint-Gobain Glass has worked a lot on anisotropy in recent years. Stéphane Auvray brings his research background to raise awareness on reallife situations. The building environment is crucial, as it changes the visual perception. If birefringence variations happen spatially on the glass, we observe variations in reflection and transmission. Therefore, the vision angle will bring the user nearer or farther to the critical Brewster angle. In other words, for glass tempered in the same conditions on the same building, cooling marks will be visible only on certain floors when observing from the ground.
Raw glass scanner via the optical retardation mapping is good to quantify the tempering quality but will not allow to predict the results for an observer. Patterns will be visible depending on the observation angle and sky polarization. However, perception can be predicted based on s-p answer of the glass. Thus, we need to consider not only the amplitude of retardation but also the direction of stresses present in the glass.
To complicate the matter, Mr. Auvray’s research also shows that the presence of coatings and lamination brings absorption and reflection, and changes the Brewster angle.
3 Commercial scanner technology
Hermann Sonnleitner of SoftSolution, Rainer Feuster of Viprotron, Eric Hegstrom of Lite Sentry, and Hermann Dehner of Arcon explain how their companies entered the anisotropy scanning market, and show their technical ability and scientific background. Each company uses a different measurement method that can be grouped in two classes: polariscope and polarimeters.
3.1 SoftSolution
Uses multiple telecentric light sources to broaden their retardation range. It allows them to evaluate the retardation in stiff interlayers and thick glass. Their system can also determine the edge stress and stress around holes. Using circular polarizer makes their measurement independent of glass orientation on the bed. They are working on correlating the edge stresses to predict fragmentation and eventually eliminate destructive QC methods.
3.2 Viprotron
Also uses circular polarized filters. They use a longer light wavelength (red monochromatic LED light). They believe that calibration is key to calculate the right values of retardation. They use several calibrated plates at different wavelengths to achieve this.
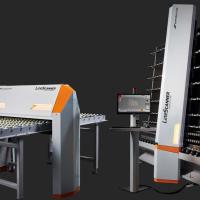
3.3 LiteSentry
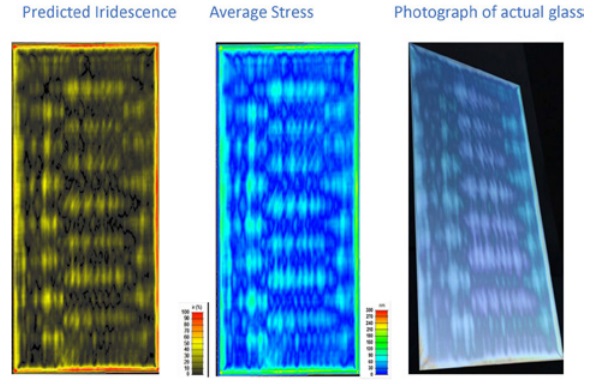
Has been in the optical distortion market for 20 years, with over 230 live installations around the world. That huge knowledge of the fabricating plant environment and image analysis was key to building their system. They realized that retardation is complex and commenced a partnership with Stress Photonics in 2017 to develop and manufacture their solution for inline measurement of anisotropy, iridescence, retardation and absolute stress in glass. They combine a colorbalanced polarized light source with multiple grey field polariscopes. That gives them a good predictability of iridescence.
3.4 Arcon
Is a pioneer in retardation measurement. Several years ago, they developed an offline measurement technology using the Senarmont method. They recently worked with ilis to develop an inline measurement technology. The rotatable analyzer was replaced by a special polarization camera with no moving elements, laser was replaced by a LED panel and measurement with circularly polarized light allows determination of correct magnitude and orientation of the stresses. They can now perform real-time statistical calculation based on magnitude and orientation of stress.
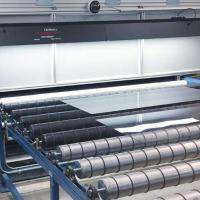
3.5 Glaston
Did not present a system at the Cupertino summit but their iLooK scans online glass anisotropy directly on the tempering line in full loads and displays each glass piece individually. Their instrument is integrated in their tempering oven to provide QA data.
4 ASTM C14.08 Anisotropy Task Group
After the Summit, it became clear that we were facing a serious challenge. We decided to keep the scope simple by working on heat-treated flat monolithic glass. Our goal is to write the standard rapidly then add other standards to cover more complex structures like laminated glass.
We also stick to standardizing the test method for measuring optical anisotropy. This standard educates stakeholders on the phenomenon and on the technology available to measure it. It establishes a vocabulary, a methodology. It confirms that retardation is the physic phenomenon and its unit is the nanometer. Finally, it certifies that measurements are consistent, repeatable and traceable across scanner manufacturers. The output will be a value matrix.
We want the standard to be a building block. It is a standard test method, not a specification.
5 Next steps in our journey
5.1 ASTM
We want to officialise this building block by bringing it to ballot. As it is rather basic, we hope this will be a simple process.
5.2 Research
There is more research to be done, in several areas:
How can we mathematically or statistically resolve a retardation map to simplify its interpretation? An average number does not convey the weird patterns or islands of high anisotropy. Where do we start to evaluate around the edges, the holes, in sharp geometric areas?
Human eye perception is well studied in the display industry, but the architectural world has not yet started to work on this. How do our eyes react to shades of grey, at what distance? At the Cupertino meeting, Adrian Kitai of McMaster University explained how the human eye can be the most critical analytical instrument, but also what are its spatial resolution limitations.
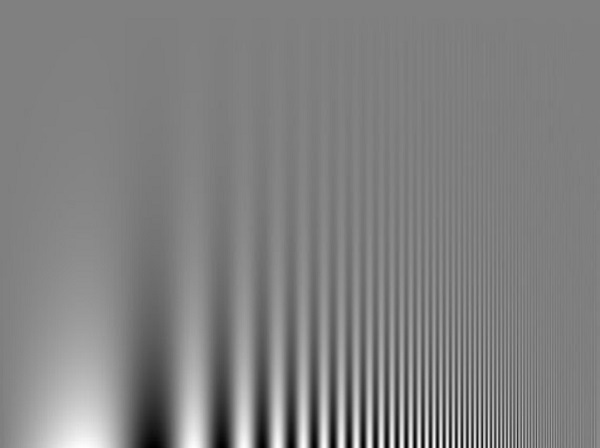
Contrast thresholds for various spatial frequencies can be measured and plotted as contrast sensitivity vs. spatial frequency. The graph below plots a Contrast Sensitivity Function. Contrast sensitivity at low spatial frequencies relates how well large objects and shapes are perceived. This research already shows us that an acceptable anisotropy value for a building 60 m away will not be as useful to describe the optical quality of your car’s backlite.
Eclat Digital, a French start-up, creates ultrarealistic virtual prototyping, using anisotropy intensity and orientation. However, they face challenges in recreating site lighting conditions. How can we measure and describe the light polarisation environment of the building and catch the environments more susceptible to anisotropy?
Conclusion and takeaway
We are continuing our very interesting journey that now allows leading-edge architects and fabricators to quantify phenomena that are deemed inevitable but, in our opinion, can be improved.
Computing power and optical technology paved the way to reliable online scanners for heattreated glass. We can say that these devices reliably map optical retardation at zero degree and can therefore quantify the tempering quality. Once the ASTM standard is in place, it will be possible to correlate accurate and repeatable measurements and objectively improve process.
In the long term, measuring anisotropy will lead to aesthetic improvements of large and complex glass panels.
References
Benjamin Schaaf, P. D. (2017). Full-surface and Non-destructive Quality Control and Evaluation by Using Photoelastic Methods. Glass Performance Days. Tampere, Finland.
M. Illguth, C. S. (2015). The effect of optical anisotropies on building glass façades and its measurement methods. Munich, Germany: ScienceDirect.
Pasetto, S. (2014). Anisotropy as a defect in U.K. architectural float heat-treated glass. Bath, UK: University of Bath.