First presented at GPD 2017
As well the whole component shall not fall out of the construction either. In Addition to this safety aspect, the utilization of the compound effect also allows a more economical design of the glass. When the compound effect resulting from the bond is applied to laminated safety glass, the adhesion strength between the laminated foil and the glass pane must fulfil certain requirements, which have to be verified experimentally.
The presented paper reports on the results of various possibilities for determining the adhesion properties of laminated safety glass. The tests are carried out with one particular type of polyvinyl butyral (PVB) interlayer.
The results of the well-known and commonly used pummel test are compared to a defined pull test as well as to results achieved by assessing the transmission of using photometric measurements. The transmission behaviour of light can be correlated to the moisture content of the PVB interlayer, using a phenomenologically based mathematical calculation rule in conjunction with a calibration standard.
The comparison of the results shows a good correlation between the adhesion strength value achieved by the pull test and the moisture content of the interlayer. Both results correspond also well to the results achieved by the established pummel test.
2 Introduction
Laminated safety glass products are commonly used in and on buildings. In particular, they are frequently utilized in overhead glass constructions and glazings with fall-through protection.
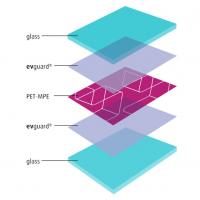
Laminated safety glass is constructed using two or more discrete glass layers with an interlayer made of a specific type of plastic material positioned between the glazing sheets. The plastic interlayer causes several positive results for the product [3, 4]. First, by considering the compound effect, it provides the opportunity of achieving a more economical design of the laminated safety glass.
Second, laminated safety glass possesses the important property of sticking the glass fragments together, in case the glass sheet is damaged and broken. The post-breakage behaviour of the laminated safety glass provides damage tolerance to the laminated glass, improving its safety properties. In order to be able to count on these positive effects, a reliable and robust verification method regarding the adhesive behaviour between the glass sheet and the plastic interlayer is an important issue. The producer of the laminated safety glass should be able to check this property during the production process.
As outlined below, there are several possibilities for monitoring the adhesion level. The so-called pummel test and the pull test are common approaches to check the adhesion behaviour directly. An alternate test method is based on measuring the light transmission of the laminated safety glass.
From the transmission behaviour, the moisture content of the interlayer can be obtained, utilizing a calculation approach as well as a calibration standard. This moisture content is a direct indication factor for the adhesive strength. The glass structure was identical for all test samples. The test samples consisted of a multilayer glass structure with 2 x 4mm (nominal thickness) float glass and a foil (PVB) with a nominal thickness of 0.76mm.
3 Testing methods and results
3.1 Light transmission by spectrophotometry
3.1.1 Method description
Using a spectrophotometer, the light transmission of multilayer glass panes has been determined. Initially, the light transmission of reference samples with three different moisture contents (measured by Karl Fischer Titration) was determined and converted to an absorption ratio (AR) using a calculation method.
The transmission behaviour depends on the wavelength of the light. In addition, it also depends on the water content of the interlayer. Therefore it is possible to obtain the moisture content of the interlayer by the transmission rate. The absorption ratio was calculated from the light transmission values of four special wavelengths, which were local minimum (wavelength about 1700 nm and 1925 nm) and maximum values (wavelength about 1650 nm and 1875 nm).
The absorption A will be calculated as
A (wavelength) = log10 (100/%T)
with T as transmission value.
The Absorption Ratio AR is defined as
AR=(A(1925)-A(1875)) / (A(1700)-A(1650)).
Details on the calculation procedure are given in [1]. In order to obtain a calibration standard, reference samples of 100mm x 100mm (length x width) with a thickness of 8.5 mm were investigated, which were delivered with a stated moisture content. Those reference samples were sealed around the edges of the pane by a self-adhesive aluminium strip as a moisture barrier. By correlating the measured absorption ratio to the stated moisture content, a regression line could be determined (Figure 1).
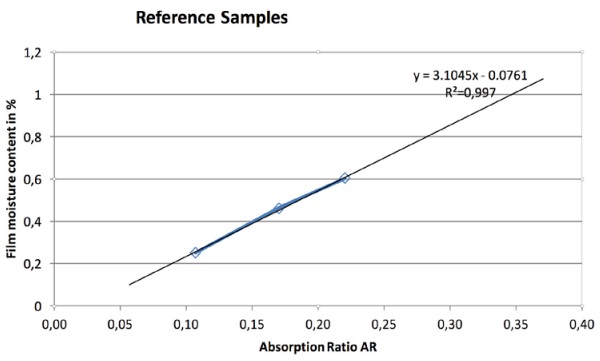
To determine the moisture content in the test specimens, again 100mm x 100mm (length x width) samples were utilized. The photometric measurements on those test samples yielded AR values, which could be converted to the moisture content using the previously determined regression curve.
All samples were measured at two spots and from both sides of the pane. The mean value of those four determined absorption ratios for each sample was then used for further calculations.
The slit width of the measurement setup in our study was 2nm. The wavelength increment for the analysis was defined as 5nm. Details on the experimental approach is described in the protocol “Measuring the moisture content in multilayer glass with a spectrophotometer” from the company Eastman, Issue August 2014, Rev. 5.[1]
3.1.2 Results
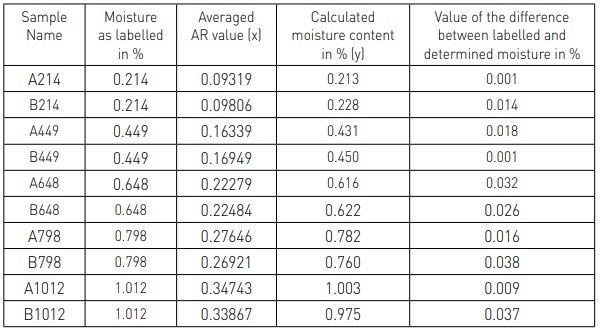
A comparison of the moisture content determined by the transmission spectroscopy and by Karl Fischer Titration revealed deviations of less than 0.038 % in all specimens tested (Table 1), indicating an outstanding capability of the taken approach.
3.2 Pummel test
3.2.1 Method description
The pummel tests were performed according to the instructions “ATAC Procedure P0006 Saflex DG Pummel Procedure 021114“, dated 2014-02-13 [2]. Because of the stiffness of the used PVB interlayer the time between removal from the climate controlled environment (-18 °C) and the test was increased to seven to nine minutes. When testing earlier the high stiffness of the interlayer in addition with the low temperature could result in a brittle fracturing of the interlayer.
The samples were 100mm x 200mm (width x length). The samples’ thickness was about 8.5mm.
The specimens were struck with hammer blows on both sides.
3.2.2 Results of Pummel test
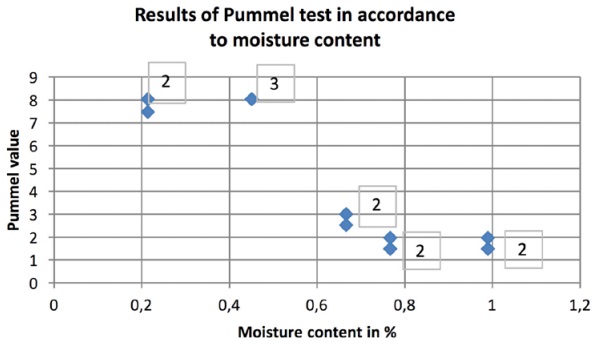
For glass specimens of five different moisture contents three pummel tests were carried out, respectively.
The results of the pummel test indicate approximately two regimes in Pummel value. While the specimens containing moisture below 0.67% show a high levels in Pummel value (7-8) specimens containing moisture of 0.67% and above show low Pummel values (<3).
3.3 Pull test
3.3.1 Method description
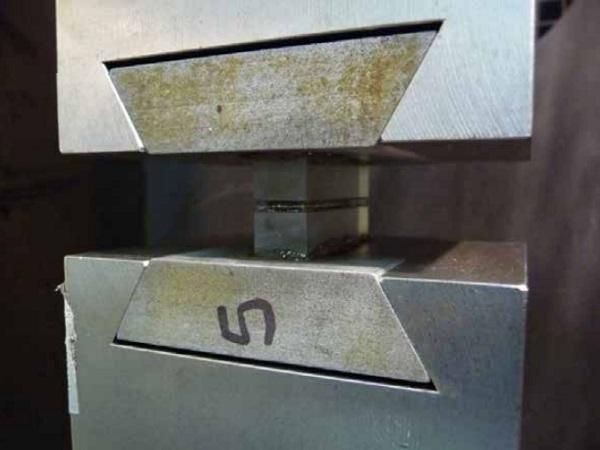
Pull tests were performed to determine the adhesive strength again on five series of laminated glass samples of different film moisture contents. The dimensions of those test samples were 10mm x 40mm. The samples’ length and width were measured to determine the relevant cross sectional area.
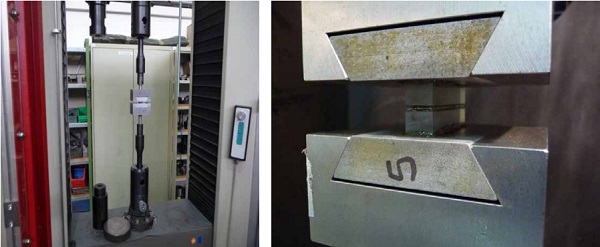
The test samples consisted of a multilayer glass structure consisting of two panes of 4mm nominal thickness float glass bonded by a polyvinyl butyral interlayer of 0.76mm nominal thickness. An example of the experimental setup is shown in Figure 3 (a,b). The glass samples were glued to dove-tailed metal sliding blocks.
Because of the increased sensitivity of the film to moisture caused by the small sample size, the samples were delivered wrapped in film. To prevent moisture ingress during the time before the test, the exposed edges of the film were sealed with a self-adhesive aluminium strip. The strip was applied directly after unpacking the specimens.
The pull tests were performed on a universal testing machine with a crosshead speed of 0.5mm / min.
3.3.2 Results
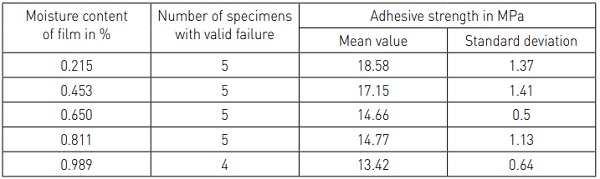
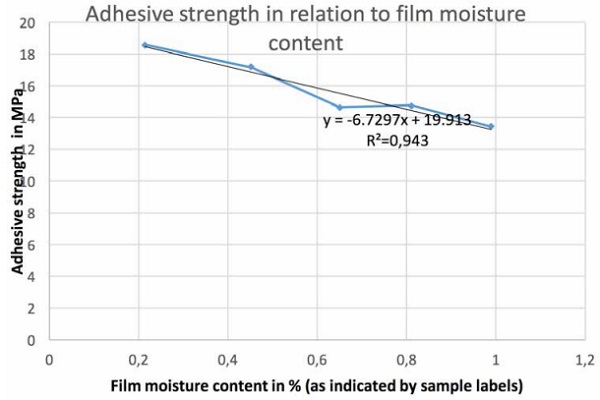
Nearly all samples failed between the film and glass and thus could be assessed as “valid”. The results of the mean values of the calculated tension of adhesive strength and the standard deviation are given for the five different moisture levels in Table 2. The adhesive strength in relation to the moisture content of the film is shown as well in Figure 4.
As shown in Figure 4, the pull test indicates a decrease in adhesive strength with increasing moisture content. This decrease can be approximated by a linear regression line. The sensitivity of the results of the pull tests was investigated with the statistical software R including all single values for the pull tests. The slope of the linear regression line for this data is -6.73 MPa/(% moisture).
The standard deviation of this slope is calculated to ±0.8. This deviation together with a p-value of 2.7*10-8 for this analysis verifies the correlation between the moisture content and the adhesive strength. The coefficient of determination, R2, is calculated to 0.943 regarding the mean values, which allows to explain the supposed inconsistency indicated by a lower adhesion strength for the lower moisture content of 0.65 % compared to the higher adhesive strength at the higher moisture content of 0.8 %.
4 Summary and Conclusion
Three experimental methods to determine the moisture content in laminated glass have been compared. All methods investigated have been demonstrated to be sensitive towards the moisture content. While the results obtained by the Pull test provide a direct measure of the adhesive strength of the interface, the results of the Pummel test and in particular the result of the light transmission spectroscopy allow only an indirect correlation to the adhesion properties.
Regarding the dependency of the measured signal on the moisture content, the Pull test and the light transmission spectroscopy indicate a linear correlation between the achieved value - Adhesive Strength and Absorption Rate, respectively - and the moisture content. This linear correlation is not seen at the Pummel test. Here, a high level and low level regime in Pummel value is indicated correlating low moisture contents to high Pummel values - and consequently to a better adhesive behaviour - and vice versa.
These results, and the fact that the results for the moisture content measured via light transmission with an additional calculation routine are very precise, show that the measurement of the light transmission is an appropriate way to determine the existing moisture content in the laminated glass, and also therefore constitute an essential piece of information on the adhesive strength.
This information is, in fact, paramount in assessing the performance of laminated safety glass as it relates to the safety aspect. It is also worth mentioning that the light transmission spectroscopy is the only approach investigated allowing a non destructive measurement of the glass panes, and thus might provide advantages regarding the capability of incorporating the measurement approach as a quality tool during production.
5 References
[1] Measuring the moisture content in multilayer glass with a spectrophotometer, Eastman, Issue August 2014, Rev. 5.
[2] ATAC Procedure P0006 Saflex DG Pummel Procedure 021114, Eastman, Issue 2014-02-13
[3] Franz J., Schneider J., Untersuchung zum Resttragverhalten von Verbundglas, 2.Darmstädter Ingenieurkongress Bau und Umwelt, Darmstadt, Germany
[4] Butchardt, C., Overend, M. Delamination in fractured laminated glass, Engineered Transparency 2012, Düsseldorf, Germany