First presented at GPD 2019
1 Abstract
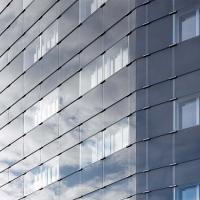
Glass distortions may cause objects to appear irregular and out of focus when observed through a distorted glass panel. Any visual disturbance, such as roller waves, bow, warp etc., should be within the tolerances given in the appropriate standards, guidance or manufacturer limits. These standards and limits generally describe how distortions may be measured for a flat panel but cannot be applied to curved panels due to a combination of curvature tolerances and unclear shaped distortion defects.
Quantifying visual distortions in curved glass panels is a challenging task, but not impossible according to the automotive and aerospace industry, where distortions may cause visual misjudgement and safety concerns. It is desirable to apply this knowledge of assessing the quality of curved glass panes to the building industry in order to set limits on what is visually acceptable. Therefore, this paper reviews the current codes on curved glass, aims to introduce several methods to capture the visual distortions and define acceptance criteria that can be used to assess curved glass panels in the building industry.
2 Optical distortions
2.1 Introduction
Glass is commonly known for its transparency; one of the features that has enabled the use of glass in building façades to grow very rapidly in the past decade. For a long time, the production of glass focused on flat glass and its quality.
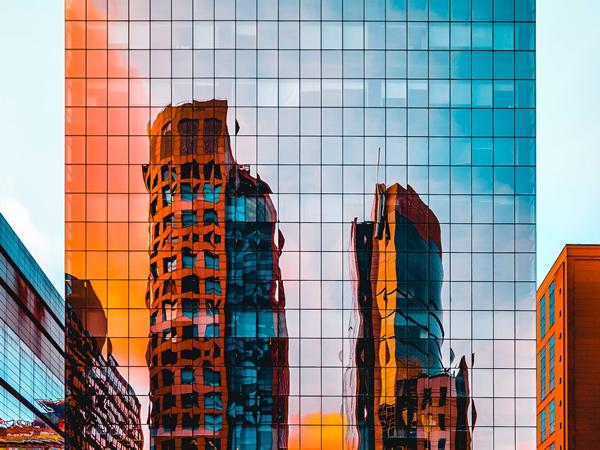
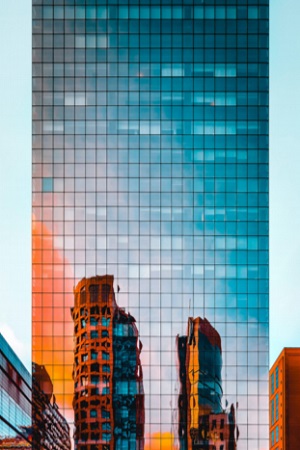
Although, even today, the quality can differ significantly. The reflected picture in the façade of Figure 1 for example, is clearly distorted and might not be in line with the owners’ expectations of the building.
This raises several questions; what is the cause of these distortions? Are there limits that would reject such panels? Were these limits properly specified and agreed upon beforehand? And, how do you define those limits?
For flat panels, standards and limits generally describe how distortions are measured. As the industry is growing and the demand is high to allow for other geometries, different tools have enabled us to produce curved glass.
As with flat glass, defects and distortions can also occur in curved panels. However, the specification for flat panels cannot be directly applied to curved panels. Therefore, this paper reviews the current codes on quality control of curved glass and aims to introduce several methods to quantifies the visual distortions.
2.2 Definition
Before considering the assessment and specification of curved glass panels, we first need to understand how we define visual disturbance. CWCT (2003) defines visual disturbance as ‘faults’, a term used to describe undesirable features of the glass that cannot be entirely eliminated and are permitted within defined limits. These faults are divided into three categories:
– Optical faults: Results in distortion of images viewed through the glass and relate to flatness of the glass. Optical faults are a permanent feature of the glass and should be assessed at the time of manufacture.
– Spot faults: Spot faults include bubbles and deposits. Many of these faults are permanent features of the glass but some may be introduced by damage during processing and erection.
– Linear/extended faults: Linear/extended faults include scratches and scuffs on the surface of the glass. These faults may occur at any time in the life of the glass and inspection may be carried out at various stages.
Glass distortions may cause objects to appear irregular or out of focus when observed through a distorted glass panel, whereas defects generally include punctual and linear inclusions, such as bubbles and scratches. Both defects and distortions should be controlled by specified tolerances, or by acceptance of a benchmark panel which may be compared to the panels supplied for installation.
However, guidance relating to inspection of curved glass panels in codes and standards is generally related to perceptibility of defects. As quantifying visual distortions in curved glass panels is a challenging task, they are often only described to a certain extend.
2.3 Causes of optical distortions
The cause of optical distortions can be traced back to production, processing and/or installation. This paper refers to production as the manufacturing process of glass, whether that is a flat panel that will be curved later in the process by lamination or assembly, or a glass panel that will be curved by hot bending or slumping. Causes of distortion due to processing refer to the means of producing a curved panel such as cold bending, assembly of a glass panel to improve thermal performance and safety, or assembly of the façade. After installation, distortion can occur due to loading of the panel (e.g. wind loads and climatic loads present in DGU’s).
Distortions observed due to production can be seen as inherent causes, while the latter two causes, distortion due to processing and installation, are additional causes that arise after production of the panel. The origin of additional causes of distortion are harder to distinguish as different distortion contribute to the overall distortion. This is important, as it complicates our task to properly assess the quality of a glass panel after production. In order to define acceptance criteria, we first need to assess the quality at the time of manufacture.
2.3.1 Inherent causes
A wide range of shapes and curvatures are possible with very good visual quality when using annealed glass. The process of creating curved annealed glass is referred to as the slumping process, where flat float glass lays on a bending mould that is inserted into a bending furnace. Once the softening temperature has been reached, the glass pane will sink into the mould by gravity.
This is not always suitable for structural applications where limited strength and susceptibility to thermal shock have to be considered. To maintain the visual quality and increase the strength, the glass can be chemically tempered. As moulds are already expensive, this tempering process will drive up the costs even further. It also limits practical application of this method, since only a few coatings can be applied.
Alternatively, hot bending of glass can be used. Manufacturers are currently experimenting to produce double curved thermally toughened glass, but most can still only develop one-way curvatures using this method. Visual quality of glass components degrades rapidly with increasing or decreasing thickness and curvature.
In addition, due to the nature of production, a variation in thickness is inevitable and can contribute to the distortion of a panel. The tolerances range from +/- 2mm to +/- 1mm, depending on the thickness of the glass. Other important factors for the quality of the end-product are the amount of experience by the manufacturers, the composition of the original glass and the characteristics of the bending furnaces.
3. Curved glass
3.1 Types of optical distortions
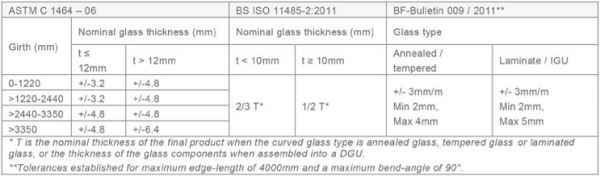
Standards generally describe how distortions may be measured for flat panels, but these techniques cannot necessarily be applied to curved panels. The limits depend, among other factors, on glass size, geometry and glass thicknesses (Bundesverband Flachglas, 2013). This section reviews the current codes to determine how geometrical tolerances that influence distortions are currently specified and measured in curved glass, mainly focussing on cylindrical bent glass. The documents reviewed cover the following codes, standards and guidelines:
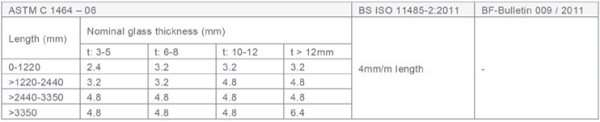
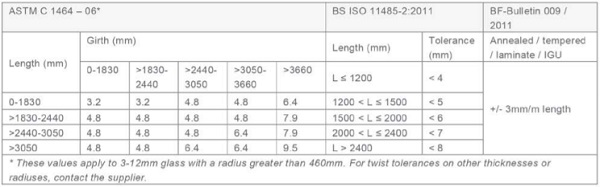
– ASTM C 1464 – 06
– BS ISO 11485-2:2011
– BF-Bulletin 009 / 2011
3.1.1 Shape accuracy
Shape accuracy measures the precision of the intended curvature as shown in Figure 3. This means that the actual contour can only deviate to a certain specified extend to its theoretical contour. The shape accuracy is determined by placing a template on the concave surface of the bend and measure the deviation between the template and glass. Or by placing the glass curve on tracing of the theoretical shape on either the concave or convex line, and measuring the deviation between the tracing and the glass (ASTM C 1464, 2006).
The quality criteria presented below are not so easily comparable as differences between combinations depend on glass thickness, radius, girth and their individual ranges for allowable tolerances. Generally, for greater glass thicknesses, BS ISO is less demanding than the ASTM, whereas BF-Bulletin specifies a minimum and maximum. Whichever is more stringent depends significantly on the girth length.
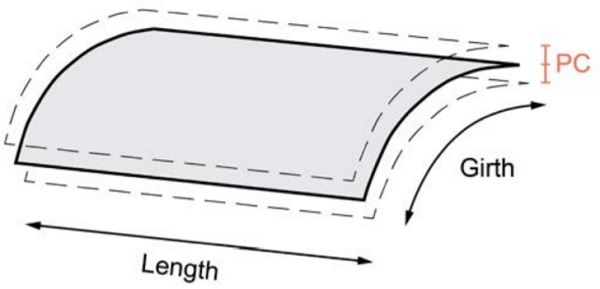
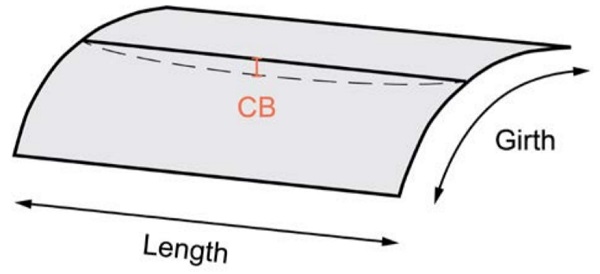
3.1.2 Cross bend
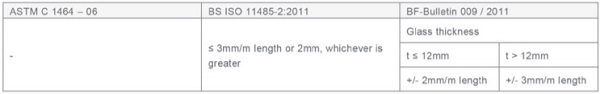
Theoretically, cylindrical curvatures are straight along its length, with the straight line measured perpendicular to the curved edge. Cross bend deviations are defined as the difference between the actual straightness of the surface to the theoretical straightness as shown in Figure 4.
According to ASTM C 1464 – 06, cross bend is determined by placing a straightedge along the horizontal edge (perpendicular to the curve) on the concave surface of glass, then measuring the distance between the glass and straightedge. The table below shows that BF-Bulletin 009 / 2011 doesn’t specify the cross bend deviation at all. As BS ISO doesn’t specify a limit for a greater length, this standard is much more generous than ASTM.
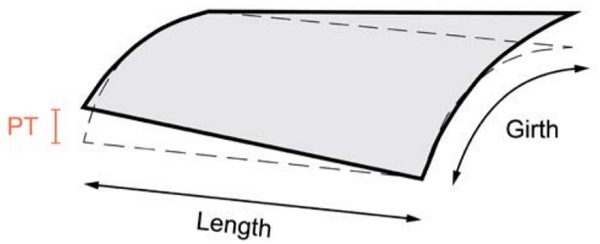
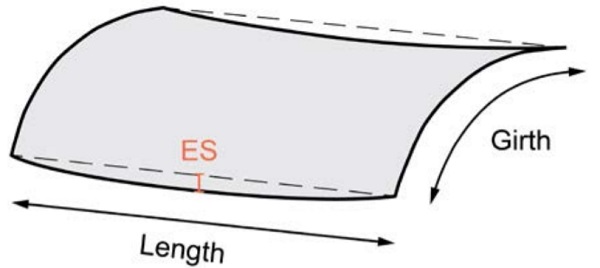
3.1.3 Panel twist
Panel twist describes the degree of parallelity of the edges in the curved glass condition as shown in Figure 5. BF-Bulletin 009 / 2011 determines twist in curved glass by positioning the panel with its upper edge on a flat surface. The twist value is the distance that the other corner is away from the surface. ASTM C 1464 – 06 determines twist similarly, but by locating the glass in a vertical test fixture.
BS ISO 11485-2:2011 uses strings, placed diagonally from the four corners. Measuring the twist as the distance of the strings at cross point. The table below shows that the upper limit of BS ISO is more generous than BF-Bulletin. Comparing the limits from ASTM with BS ISO and BF-Bulletin is challenging, as the latter two standards don’t mention the girth.
3.1.4 Edge straightness
According to BS ISO 11485-2:2011, the edge straightness is measured by placing a straight ruler along the straight edges of the glass and measuring the distance between the ruler and the glass, with the glass in vertical position. The ASTM C 1464 – 06 doesn’t mention edge straightness. BS ISO 11485-2:2011 and BF-Bulletin 009 / 2011 do mention edge straightness and specify similar tolerances.
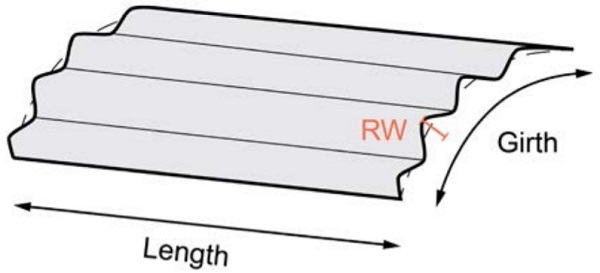
3.1.5 Roller waves
Float glass is commonly heat-treated to provide additional tensile strength to the surface. This is done by heating and rapidly cooling the glass, whilst moving the panel over rollers. Glass sags very slightly between these rollers while transporting the glass through the furnace. This process causes a surface distortion that occurs in a regular wave pattern (300-400mm) and essentially reduces the surface flatness, known as roller wave distortions. The quenching process freezes the glass, locking in this distortion.
The optical distortion in reflected light can be related to roller waves, while the optical distortion in transmitted light relates to the overall curvature and local thickness variations (ASTM C1652/C1652M, 2014). Generally, the thinner the glass the more likely roller wave will be noticeable, while larger glass sizes may also appear to have more distortion. None of the standards mention roller waves in curved glass, and therefore do not specify limits, let alone how to measure this.
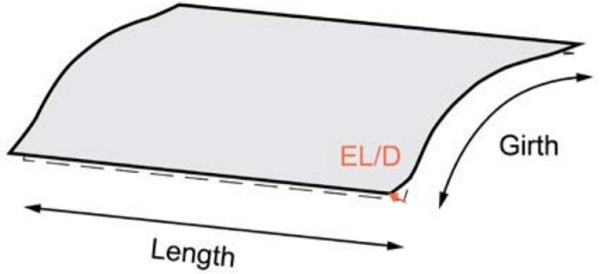
3.1.6 Edge lift or dip
At the edges of thermally toughened glass slightly greater bow tends to occur, commonly referred to as edge lift or dip. Edge lift or dip is defined for flat glass panels, but none of the codes and standards reviewed mention this geometrical deviation for curved glass panels.
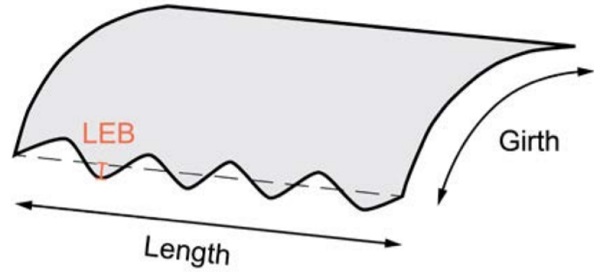
3.1.7 Local edge bow
Local edge bow as shown below is also not specified in any of the codes, standards and guidelines that are reviewed in this paper. Although not specified, this geometrical deviation is recognised by different suppliers.
3.2 Quality control assessment
Glass quality control is governed by many different types of distortions as described above. These distortions are normally presented separately in order to categorise and validate them according to allowable tolerances set out in numerous codes, standards and guidelines. The disadvantage of this concept is that the different distortions can be in the range of the allowable tolerances, but the overall distortion of the glass is not acceptable.
Even if distortions were to be viewed separately, the list as currently presented to assess the quality of a curved panel is far from complete. The types of distortions that are mentioned in the codes and standards reviewed in this paper are inconsistent and do not always specify different distortion limits for multiple variables. This is of great important, considering that the building industry asks for glass panels with different sizes, thicknesses, treatments, etc.
We need to ask ourselves; how can properly measure either the different distortions separately, or the distorted panel as a whole? Followed by a process on how this is translated into allowable tolerances that relate to the visual quality of a glass panel. With regards to the distortions in curved panels not specified by the standards, such as roller waves, edge lift or dip and local edge bow.
These are noteworthy distortions, and according to the author, shouldn’t be excluded. Roller waves are the most common distortion seen in the building industry and most prominent distortion when it comes to the overall quality of the glass, while edge lift or dip and local edge bow are defined to occur at the edges.
3.3 Precedents in other industries
Codes and standards define limited methods and corresponding allowable tolerances to measure different optical distortions in curved glass panels. Although quantifying visual distortions in curved glass panels may be a challenging task, it is not impossible according to industries such as the automotive and aerospace industry, where distortions may cause visual misjudgement and safety concerns.
In the aerospace industry, Dixon et al., (2011) mentioned that, before a given aircraft is accepted, its windshield will be subjectively evaluated by a number of different parties, including the windshield supplier, the aircraft manufacturer, and the end customer. Even so, without a clearly defined standard, it is difficult to create or maintain consistent manufacturing standards.
The industry therefore started developing a visual assessment process, as it was highly desirable to have a quantifiable measure of distortion with clearly defined acceptance criteria. We can apply the knowledge of assessing the quality of curved glass panes to the building industry, with the intention to ultimately set limits on what is visually acceptable.
4 Assessment methods
4.1 Introduction
Transparent materials have a disadvantage when it comes to measuring their geometry due to the reflective property of their surfaces. Several methods require the surface to be covered with a thin layer of powder spray prior to its geometric measurement. The final accuracy is often dependent on the powder thickness and its homogeneity.
Powder spraying glass panels is also difficult after installation and a time-consuming process as the objects needs to be cleaned afterwards. Therefore, various techniques have been investigated that do not require changing the surface (Bajard et al., 2013). These methods can be divided into two main concepts: measuring the distortion seen through the glass or measuring the actual surface of a glass panel. Impactable.
4.2 Distortion measurement
4.2.1 Image comparison method
Image comparison is a method commonly used for measuring distortion. In essence, this system works by obtaining an image of a grid pattern distorted by a transparent object and comparing this to an undistorted image of the grid pattern (Dixon et al., 2011). A digital camera records the appearance of a grid pattern that either has been reflected from or transmitted through the glass.
By measuring the difference in distance of lines in an undistorted and distorted image, the distortion in the corresponding section of the glass can be calculated. This method is also introduced by ASTM C1652 / C1652M – 14, a standard that defines digital photography of grids as a test method for measuring optical distortion in flat glass products. The procedure is mainly useful for measuring the roller waves of flat architectural glass but can also be used for inspection of laminated glass and tempered curved glass.
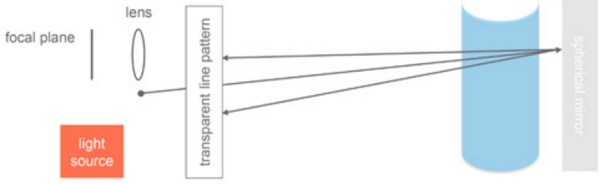
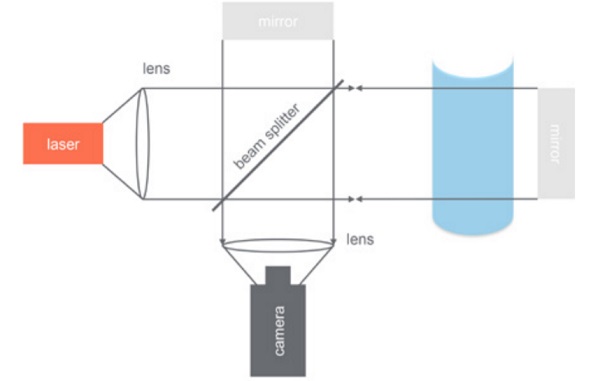
4.2.2 Moiré interferometry method
Moiré interferometry is a technique that captures small angular deviations of light rays. As shown in the image below, light passes through a transparent line pattern towards a spherical mirror. The light is reflected by this mirrored surface and passes through the transparent line pattern a second time. The image created is captured by a camera.
If no glass panel is present, the light will reflect off the spherical mirror at a certain ideal angle. If a panel is present, the light angle will deviate from this ideal. There are several ways to set up a moiré interferometer, but the alignment of the optical components is not as stringent as for the image comparison method. This method has been proposed in the aerospace industry to allow for great accuracy compared to image comparison.
4.3 Surface measurement
4.3.1 Phase shifting method
The phase shifting method uses fringe patterns to obtain the geometry data of glass panels. Fringe patterns are commonly generated and displayed on a digital screen or projected onto a ground glass plate acting as a beam splitter as shown in Figure 12. From different viewpoints, the reflected fringe patterns appears deformed.
The range of this deformed image depends on the slope variation of the measured surfaces. Phase shifting is considered a surface measurement as it uses the reflection of an image projected onto the glass surface rather than transmission. This method has been proposed in the aerospace industry to allow for great accuracy compared to image comparison.
4.3.2 Thermal fringes
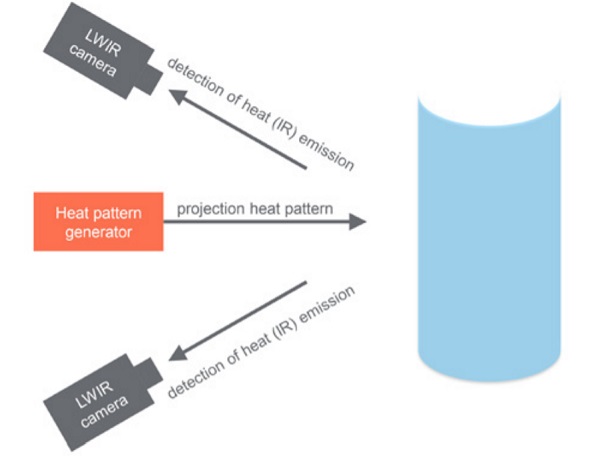
Another approach to measure a 3D shape is by generating and projecting a heat pattern onto the object’s surface using a heat pattern generator (CO2 laser) as shown below. Two long-wavelength infrared (LWIR) cameras are used to detect the emitted heat radiation from the surface.
Depending on the time delay between projection and image collection, the sharpness of the pattern will decrease since the pattern will diffuse over time (Brahm et al., 2016) fringe sequences in the visible wavelength range (VIS. Recently, further developed of the thermal fringe method involves combing this method with the phase shift and technique and greatly improved the accuracy of the method (Jiao, Liu, Shi, & Xie, 2019). This method has been proposed to measure the surface of transparent, black or specular objects.
4.3.3 Traceable surface
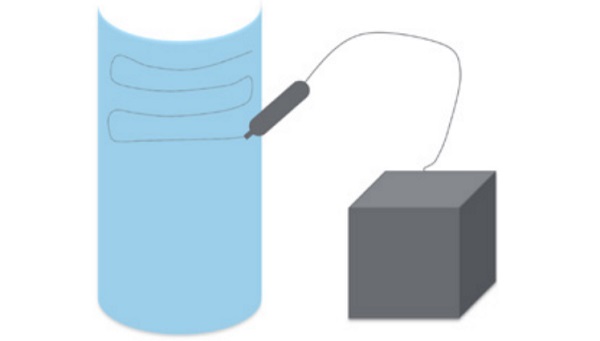
Measuring the distortion of a transparent object can also be achieved by tracing the surface manually. Prodim Bent Glass, for example, uses a measuring pen that is connected to a module by a wire. The module registers the points measured and can be directly translated into a digital CAD file.
This method is used by manufacturers and allows for simple measurements by hand but can be considered time consuming and therefore expensive. Especially, if this were to be done for every panel in a large order. Adapting this method to an automated process would allow for more efficiency. As far as the author is aware, no precedents of this method as an automated process exist.
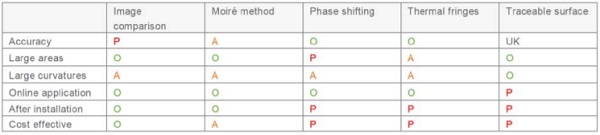
4.4 Method comparison
Several methods to measure distortions have been introduced each with its strengths and weaknesses (Table 5). The image comparison method has been the standard method to examine distortions in the aerospace and automotive industry, and for measuring optical distortion in flat glass products according to ASTM C1652 / C1652M – 14. It is the least expensive and most straightforward.
According to Youngquist et al. (2015), a paper published by NASA, it is adequate when examining poor quality windows, but limited in accuracy, although ASTM refers to this method as an accurate method of quantifying the optical distortion of glass. The automotive and aerospace industry depend heavily on the flatness of glass where distortions may cause visual misjudgement and safety concerns. Therefore, their assessment has to be more accurate. Regarding the building industry, the quality control assessment is mostly based on visual acceptance.
Phase shifting interferometry seems to provide the highest-resolution measurements, but the system is expensive and can only analyse small area objects. Scanning large-area surfaces requires multiple measurements after which images need to be added together to obtain a complete map. Moiré interferometry is less expensive but has accuracy problems and requires careful measurement, processing of data and analysis. This approach does, however, allow for larger objects to be investigated.
The thermal fringes method, apart from the cost, has proven to be reliable and accurate for transparent surfaces (Bajard et al., 2013). Finally, measuring distortions by tracing the surface is a simple way of capturing deviations, but can be considered time consuming and therefore expensive.
Due to the field of view of the camera, all assessment methods, except for the traceable surface method, are less suitable for measuring highly curved surfaces. Additionally, the traceable surface method as presented, doesn’t allow for on-line applications and needs proper adjustments if it were to be used online, whereas the other methods are easier to adapt to on-line applications.
All the proposed methods can be used to measure the distortion in a single panel, but only the ones using measurements based on distortions can cover glass panels after processing and installation. Anything assessed after production would include additional distortions complicating the search for the original distortion. Although current standards divide distortions to allow for easy measurement techniques, this isn’t strictly necessary if the correct technique is used in combination with appropriate limits. An option is to adapt the allowable tolerances, separating single panels, laminated and DGU’s.
4.5 Quantification of results
Currently, acceptance criteria are based on previous project experience and standards. Often smaller sized mock-ups, and only rarely full-sized mock-ups, are fabricated. Anticipated imperfections are often be demonstrated by the provision of these samples prior to the start of glass production. Appointed experts will examine the samples provided and reasonably advise what is acceptable and what is unacceptable. All glass produced afterwards shall comply with the acceptable samples as a minimum standard.
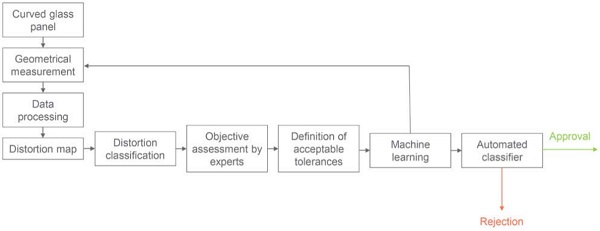
Ideally, this process would not be solely based on visual inspection, but quantifies the distortions efficiently by using one of the methods mentioned before, combined with a more automated process. Dixon et al. (2011) describes how this can be achieved: digital quantification and machine vision algorithms produce a distortion map of a glass panel.
Automated classification of this distortion map use machine learning in order to produce a final judgement of the quality of glass. This approach is implemented as a complete system, capable of analysing glass panels and making objective quality assessments. The distortion profile is then evaluated by an automated classifier trained using numerous examples of expert-evaluated glass panels.
To develop this process takes time, especially when this is adopted in the building industry due to the wide range of glass panels. The building industry might require something simpler, in terms of the measurement process and allowable tolerances.
5 Conclusion
Distortion tolerances and measurement methods for curved panels defined by standards are inconsistent and incomplete. Therefore, several methods have been proposed to analyse visual distortions of a glass panel. These methods are divided into two main concepts: measuring the distortion seen through the glass or measuring the actual surface of a glass panel.
References from other industries are used to assess the feasibility of these techniques. The results from the method comparison indicate that image comparison would be the right assessment method to be used in the building industry. This technique is the least expensive, most developed and allows for measurement at production, processing and after installation.
The steps required to establish a proper quality control and specification for distortions of curved glass panels starts with developing an algorithm to produce a distortions map. Numerous samples need to be fed into the algorithm to create a large enough dataset. Hereafter, the panels need to be objectively assessed by experts to quantify the allowable distortion.
This process does not have to be repeated once proper distortion tolerances are established, but constant quantification and machine learning will be beneficial to create an automated classifier. The curved glass panels can then either be classified manually or by an automated process.
6 References
ASTM C 1464. (2006). Standard Specification for Bent Glass. 1–5. https://doi.org/10.1520/F3114-15.2
ASTM C1652/C1652M. (2014). Measuring Optical Distortion in Flat Glass Products Using Digital Photography of Grids. 1–6. https://doi.org/10.1520/C1652
Bajard, A., Aubreton, O., Fofi, D., Morel, O., Meriaudeau, F., Truchetet, F., … Mériaudeau, F. (2013). Non conventional Imaging Systems for 3D Digitization of transparent and / or specular manufactured objects. 11th Interntional Conference on Quality Control by Artificial Vision, QCAV2013, 190–197.
Brahm, A., Rößler, C., Dietrich, P., Heist, S., Kühmstedt, P., & Notni, G. (2016). Non-destructive 3D shape measurement of transparent and black objects with thermal fringes. Dimensional Optical Metrology and Inspection for Practical Applications V, 9868. https://doi.org/10.1117/12.2227093
Bundesverband Flachglas. (2013). Guidelines for thermally-curved glass in the building industry. CWCT. (2003). Technical Note No 35: Assessing the appearance of glass.
Dixon, M., Glaubius, R., Freeman, P., Pless, R., Gleason, M. P., Thomas, M. M., & Smart, W. D. (2011). Measuring Optical Distortion in Aircraft Transparencies. Machine Vision and Applications. Ferlin, J. (2019). Mirror Facade of Tall Building. Retrieved May 15, 2019, from https://www.pexels.com/photo/mirror-facade-of-tall-building-1963557/
Jiao, D., Liu, Z., Shi, W., & Xie, H. (2019). Temperature fringe method with phase-shift for the 3D shape measurement. Optics and Lasers in Engineering, 112(August 2018), 93–102. https://doi.org/10.1016/j.optlaseng.2018.09.010
Youngquist, R. C., Nurge, M. A., & Skow, M. (2015).
A Comparison of Three Methods for Measuring Distortion in Optical Windows. Nasa/Tm, (April).