Source: Glass Structures & Engineering
Authors: Dominik Offereins & Geralt Siebert
DOI: https://doi.org/10.1007/s40940-026-00335-5
Abstract
Research and development in the field of structural glass engineering is constantly exploring new materials and innovations to improve the performance and versatility of laminated safety glass (LSG). Liquid Cold-Poured Interlayer (LCPI) adhesives are emerging as an alternative to film-based interlayers, such as PVB, EVA, and Ionomers, and are gaining increasing attention in research. These products are cured at room temperature without the need for additional pressure. Their mechanical and physical properties can be adjusted depending on the intended application. Therefore, they can range from highly flexible, allowing for the integration of elements such as photovoltaics or screens, to very stiff, in order to enhance the load-bearing behavior of LSG. In this paper, three LCPIs covering this range are investigated with respect to their mechanical properties. Each adhesive is tested under different stress states, including bulk material tests (uniaxial and biaxial tension tests) as well as shear tests on small-scale laminated glass specimens. Since all investigated materials exhibit viscoelastic behavior, strain-rate- and time-dependent effects are studied in the uniaxial stress state using different strain rates, cyclic loading, and relaxation tests. To evaluate the suitability of the adhesives for laminated safety glass, pendulum tests on large-scale laminated glass specimens are conducted. All three adhesives show promising mechanical performance and post-breakage behavior within the pendulum tests, indicating their potential for use in laminated safety glass.
1 Introduction
In recent years, so-called Liquid Cold-Poured Interlayer (LCPI) adhesives have increasingly become the focus of various research studies dealing with laminated safety glass (LSG) (Hänig 2023; Hänig et al. 2025; Offereins et al. 2024). It should be noted that different authors and manufacturers use a variety of names for different systems, including liquid composites, cast resins, cold liquid interlayers, and liquid optically clear adhesives (LOCA), which are referred to as LCPIs in this paper. The increasing attention is primarily due to the versatile properties of these materials: they are transparent and cure without the need for additional pressure or elevated temperatures, and their production inherently involves no material waste, which has a positive effect on their energy balance. Moreover, these characteristics enable applications in cold-bent glazing as well as the integration of additional components such as photovoltaic elements or display technologies, which is gaining increasing relevance.
In essence, two different curing mechanisms can be distinguished for liquid cold-poured interlayer adhesives: one-component systems, which typically cure by exposure to UV radiation, and two-component systems, which develop their material properties through the mixing of two viscous base components. The material properties can be tailored over a wide range, from highly flexible and extensible to very stiff. Furthermore, even in flexible systems, the molecular structure can be three-dimensionally cross-linked. The lack of widespread application is first due to the production process of laminated glass using LCPIs, which has not yet been industrialized and is therefore costly. Second, significant gaps remain in scientific research on the mechanical properties of these materials, which are addressed in the following.
Previous publications have initially primarily been issued by the manufacturer. These works have focused, on the one hand, on the versatility of LCPIs in laminated structures, particularly with regard to the integration of functional elements (e.g. LEDs) and the embedding of polycarbonate sheets for high-security glazing (Scherer et al. 2021). In further publications, results from four-point bending tests, dynamic mechanical thermal analyses, and lap-shear tests were reported, and a constitutive material law for the small-strain regime was proposed for a specific LCPI material (Wittwer and Schwarz 2013). However, the results of the shear tests are only reported as force–displacement diagrams, without providing information on the specimen geometries or the applied testing speeds.
The application in bullet-resistant glazing was further investigated in detail in (Weimar 2015; Weimar and Andrés López 2018; Andrés López 2024). In these studies, a liquid cold-poured interlayer adhesive, not specified in further detail, was used as the bonding element between the glass and the polycarbonate layer. However, only limited material data, such as Young's modulus, fracture strain, and Poisson's ratio of the LCPI adhesive itself, are provided. The first comprehensive investigation of an LCPI material was presented in Hänig (2023). Although the application considered in this study was not a conventional laminated safety glass, but rather a composite consisting of thin glass combined with a thick polyurethane LCPI core (4–6 mm), detailed investigations of the mechanical behavior of the LCPI were conducted, including the large-strain regime. Uniaxial tensile tests at different temperatures and strain rates, as well as thermomechanical analysis (TMA) and dynamic mechanical thermal analysis (DMTA), were conducted. The composite behavior in thin-glass-polyurethane composites was examined by means of adhesion tensile tests as well as four-point bending tests, pendulum tests, and ball drop tests. The composites successfully passed the pendulum impact tests and ball drop tests, demonstrating their potential for application in laminated safety glass. Comparative studies on the bulk material behavior of different LCPIs were conducted by Hänig et al. (2025) and Offereins et al. (2024). In both publications, dynamic mechanical thermal analyses and uniaxial tensile tests were performed. While Hänig et al. (2025) investigated three different LCPIs and applied various aging scenarios, Offereins et al. (2024) compared two LCPIs with PVB, SentryGlas®, and EVA. In addition, Offereins et al. (2024) examined different deformation rates and conducted cyclic tensile tests as well as relaxation and creep experiments. Both studies highlight the three-dimensionally crosslinked structure of the materials, which provides considerable long-term stiffness and therefore leads to relevant shear-coupling effects in laminated glass. Offereins et al. (2024) showed that the initial stiffness of one of the investigated LCPIs is significantly higher than that of PVB and EVA. The aging experiments presented in Hänig et al. (2025) revealed a negative influence of moisture on all mechanical properties of the materials, as well as embrittlement and yellowing caused by radiation. However, for both effects, it is assumed that their impact is less pronounced in the laminated state due to the protective effect of the glass.
The paper at hand addresses the remaining research gap concerning the material behavior of LCPIs under large deformations. To this end, three different LCPIs are subjected to a comprehensive experimental program comprising bulk material tests as well as laminate tests. At the outset, pendulum impact tests were performed on large-format laminated glass panes. This allows the fracture behavior of the laminates to be assessed and serves to classify whether the selected adhesives are suitable for use as interlayers in laminated safety glass. The bulk material investigations cover both uniaxial and biaxial stress states. Under uniaxial loading, monotonic tension tests at three different deformation rates, cyclic tension tests, and relaxation tests were conducted. The biaxial stress state was investigated using the so-called Bulge test. In addition, small-scale single-lap shear tests were performed on laminated specimens.
The results are used to characterize the material behavior of the different liquid cold-poured interlayer adhesives. Furthermore, the data establishes a basis to enable a selection of LCPIs for a specific application, as well as for enabling a comparison of this group of materials with currently used interlayers such as PVB, EVA, and ionomers.
2 Experiments
2.1 Investigated materials
In the following, LCPIs with two different curing mechanisms are investigated: one product is a UV-curing acrylate (referred to as Acrylate A1), while the other two products are two-component polyurethanes (referred to as Polyurethanes P1 and P2). According to the manufacturer, the polymer structure of all three materials is three-dimensionally cross-linked and can be classified as a thermoset structure. Adhesive A1 was already investigated in Offereins et al. (2024), while adhesive P1 was examined in both Offereins et al. (2024) and Hänig et al. (2025). Characteristic material properties taken from the manufacturers’ data sheets are given in Table 1.
Table 1 Material properties taken from the Manufacturer’s data sheets - Full size table
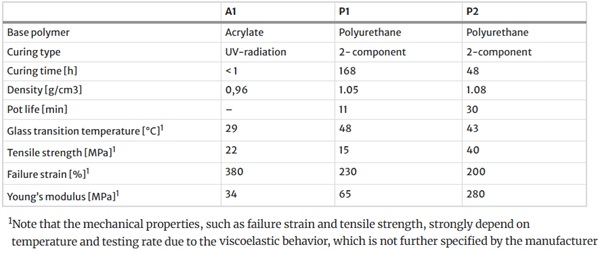
To represent different LCPI formulations for various application scenarios, consideration was given to investigate materials covering a wide range of stiffness. Therefore, reference is made to Chapter 2.3, where the test results are given in detail. Regarding Table 1, it should be noted that the glass transition temperature is not a fixed temperature, but rather a transition region which, when determined by DMTA, depends on the test frequency and the strain amplitude.
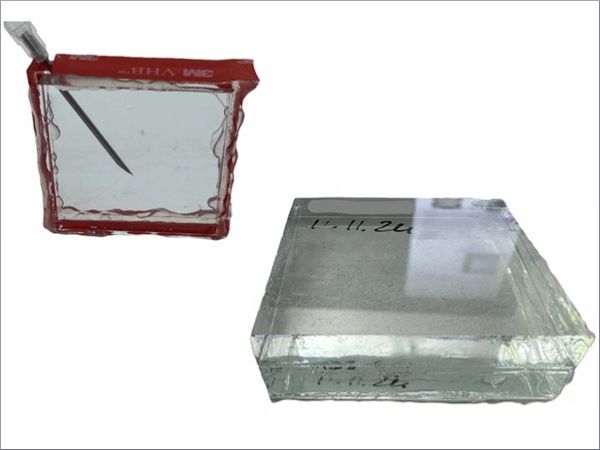
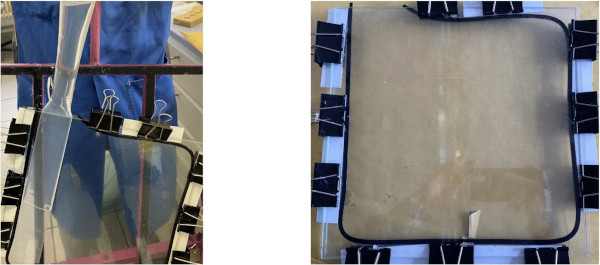
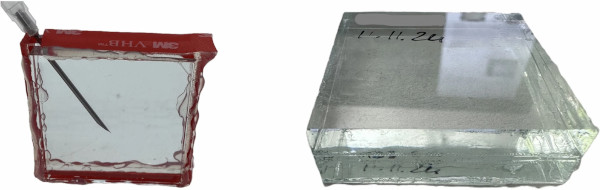
All specimens were manufactured and supplied by the producer. For the bulk material tests, the specimens were punched out of sheets. These sheets were produced by bonding polyethylene (PE) foils onto glass plies, which were in turn fixed together using spacers and a butyl cord with a rigid core. The adhesive mixture was then cast into the cavity, and the opening was subsequently sealed. The manufacturing process is illustrated schematically in Fig. 1. The specimen thickness was measured individually for each specimen prior to testing.
The fabrication of the specimens for the small-scale shear tests is illustrated in Fig. 2. For this purpose, glass panes with dimensions of 45 × 45 × 6 [mm] were cut and subsequently thermally toughened to produce single-pane safety glass (ESG) in the laboratory of the Technical University of Darmstadt. These plies were then supplied to the manufacturer. There, they were bonded using a self-adhesive acrylic tape, which simultaneously served as a spacer and a sealing element, and subsequently filled. After manufacturing, all specimens were stored at room temperature for a minimum of two weeks. This ensured that the polyurethane adhesives developed their final material properties. Adhesive P1, on the other hand, was additionally stored at 60 °C for 48 h, according to the advice of the manufacturer.
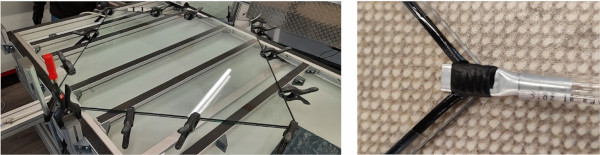
The large-format test panes were manufactured in the technical facility of TTEC Glass Solutions GmbH. The manufacturing process is illustrated in Fig. 3. The glass plies for the Pendulum test had dimensions of 1938 × 876 × 6 [mm], the interlayer thickness was 2 mm.
2.2 Pendulum impact tests
The large-scale impact tests were conducted in the laboratory of the University of the Bundeswehr Munich. Prior to testing, the specimens were conditioned at room temperature for at least 48 h. During the tests, the minimum temperature was 16 °C and the maximum temperature was 18 °C.
The pendulum impact test, defined in DIN EN 12600, is a standardized test for laminated safety glass. It simulates a soft impact using a double-tire pendulum. The test is passed if none of the specimens break, or if they break safely. In the latter case, the result is defined by the weight and size of the glass fragments. To evaluate the effect of interlayer material behavior on LSG, glass breakage is obligatory. In Schneider et al. (2020), a hole with a diameter of 20 mm going through the entire laminate was introduced in the center of the pane to create a targeted pre-damage. This test setup was adopted for the present study. Apart from that, the test setup corresponded to the specifications according to DIN EN 12600. During the manufacturing of the laminated glass, the opening was sealed with a butyl gasket to prevent adhesive leakage. However, due to the compression of the gasket, it no longer perfectly adhered to the edge of the opening in the cured state. This caused an unfilled gap between the glass plies along the edge of the hole, allowing for glass-to-glass contact during the pendulum impact, see Fig. 6 (left).
Following DIN EN 12600, no opening may occur through which a sphere with a diameter of 76 mm could pass under the application of a maximum force of 25 N. Additionally, the weight of the glass fragments must not exceed the equivalent mass of 10,000 mm2 of the original specimen. In the present test configuration, this corresponds to 300 g (assuming a glass thickness of 12 mm; the thickness and weight of the interlayer are neglected). Furthermore, the largest individual fragment must not weigh more than the equivalent mass of 4400 mm2 of the original specimen, which corresponds to 132 g. If disintegration occurs, the ten largest crack-free fragments must not exceed the equivalent mass of 6500 mm2 of the original test specimen, which corresponds to 195 g.
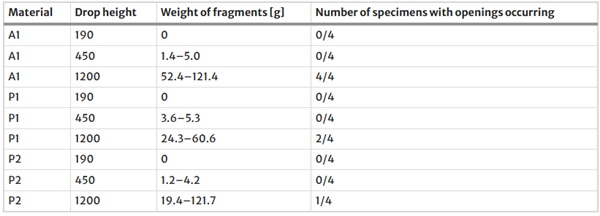
The test procedure followed the classification scheme of DIN EN 12600 and was carried out in three consecutive stages corresponding to pendulum drop heights of 190 mm, 450 mm, and 1,200 mm. After each pendulum impact, the panes were inspected for fragments and perforations. The fragments were collected and cumulatively weighed. Four specimens of each interlayer type were tested. The results are depicted in Figs. 4, 5, 6.
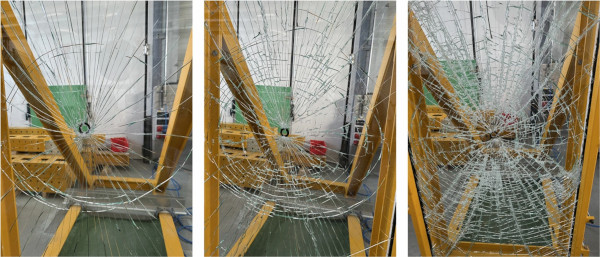
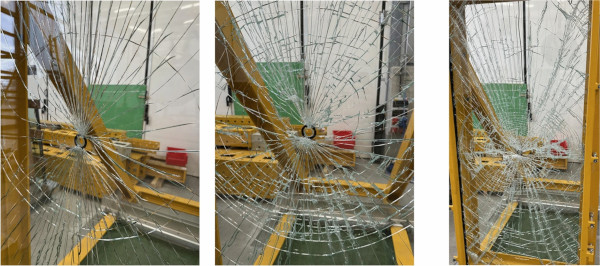
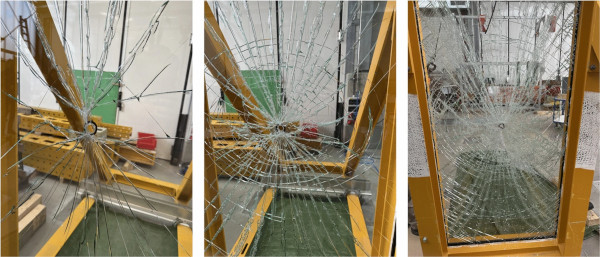
All panes fractured at the initial drop height of 190 mm. The fracture patterns were comparable for all materials and were characterized by radial cracks emanating from the central hole as well as one or more circumferential cracks forming at a certain distance around the hole. Overall, the fracture pattern of LCPI P2 appeared coarser than those of A1 and P1.
Subsequently, the drop height was increased to 450 mm and afterwards to 1200 mm. In both cases, this resulted in a further refinement of the fracture pattern and in detached glass fragments. In some specimens, larger fragments detached due to the lack of bonding in the immediate vicinity of the central holes. However, all fragments satisfied the criteria specified in DIN EN 12600. In addition, larger openings originating from the central hole were observed in some cases. These openings could not be penetrated using the ball specified in Annex A of DIN EN 12600 under an applied load of 50 N. The results are summarized in Table 2. The pendulum impact test is therefore considered passed for all investigated interlayer materials. However, a continuous horizontal crack was present after the final impact in all A1 specimens. Once the panes were removed from the test frame, the panes folded under self-weight. Although the test is considered passed, additional investigations are recommended when using A1 as an interlayer, particularly for applications involving two-edge-supported configurations.
Table 2 Pendulum impact test results - Full size table
2.3 Bulk material tests
For the bulk material tests, the specimens were punched from sheets of size 30 × 30 [cm]. In total, 10 sheets of LCPI A1, 16 sheets of P1, and 9 sheets of P2 were supplied by the manufacturer. Since the sheets were produced in a manual manufacturing process, a higher variability in the material behavior between individual sheets is generally expected compared to, for example, testing of machine-produced PVB rolls, where specimens are punched out of the same roll. To account for this variability, an increased number of 20 specimens is used during testing to obtain meaningful average results, including all sheets in every test. All bulk material tests were conducted in a temperature-controlled room at 20.3 °C ± 1.3 K.
2.3.1 Monotonic uniaxial tension tests
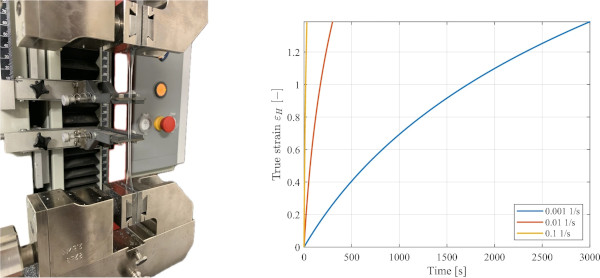
The uniaxial tensile tests were conducted in a single-column material testing machine from ZwickRoell (Z2.5 zwickiLine, see Fig. 9) using Type 5A specimens in accordance with DIN EN ISO 527, which specifies the determination of the tensile properties of plastics. The force transducer has a nominal force Fnom of 2.5 kN with an accuracy class 1 from 0.2% of Fnom and an accuracy class 0.5 from 1.0% of Fnom. The displacement transducer measures from a deformation of 2 mm with an accuracy class 1 according to DIN EN ISO 9513 with a resolution of 0.003 mm/pulse. The monotonic tension tests until failure were performed at strain rates of 0.001 s⁻¹, 0.01 s⁻¹, and 0.1 s⁻¹ for each material. Note that these strain rates are referenced to the initial gauge length and therefore technically correspond to strain velocities rather than true strain rates. The test procedure in true (Hencky) strains is given in Fig. 7.
The engineering strain (Biot strain) is calculated using the initial length L₀ and the current length L by

where λ is the principal stretch in the uniaxial loading direction. The true strain is given by

Similarly, for the engineering stress (1st Piola–Kirchhoff stress) and true stress (Cauchy stress) applies:

where F is the current Force, A₀ is the initial cross-section of the specimen, A is the current cross-section, and J is the Jacobian determinant. The results are depicted in Figs. 8 and 9. As shown in Figs. 8, P1 exhibits the stiffest material response at small strains, showing a Young’s modulus between 112.7 and 276.5 MPa. In contrast, P2 shows the highest failure strength with values between 76.7 and 92.9 MPa. It is noticeable that P1 fails at comparatively low strains. The maximum true strain for the highest strain rate lies at 0.64 [ − ]. A detailed discussion of the results is given in Chapter 3 and Table 3.
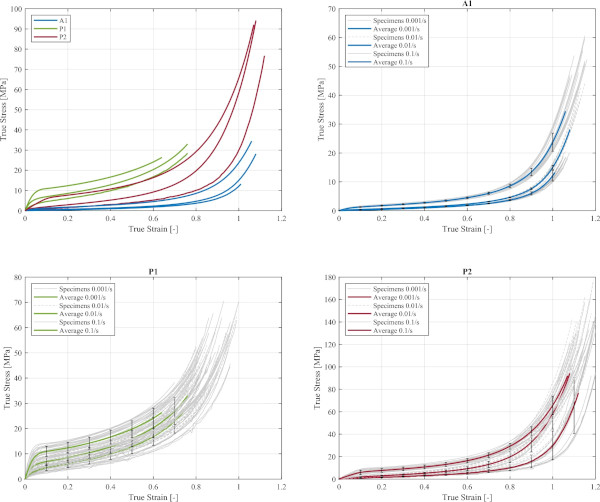
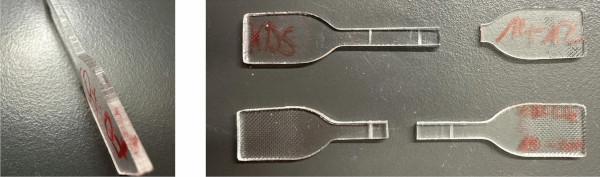
Table 3 Comparison of mean failure strains and stresses - Full size table
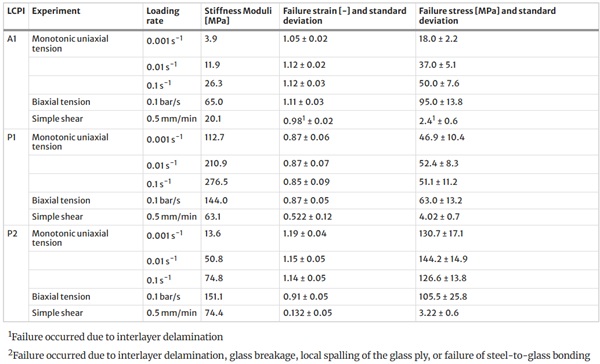
Furthermore, LCPI A1 tends to fail at lower strains and stresses when tested at lower deformation rates. This behavior is generally contrary to polymer material theory: at lower deformation rates, polymer chains have more time to disentangle, which typically results in higher failure strains. In the present case, the premature failure of the specimens may have several causes. First, the punching process used for specimen fabrication may have introduced edge defects into the material, which exert a greater influence at lower deformation rates or longer test durations. Moreover, the fracture patterns differed depending on the loading rate: at slower rates, the specimens predominantly failed at the clamping area, whereas at higher rates, failure occurred in the central gauge section.
2.3.2 Cyclic uniaxial tension tests
The general procedure for a cyclic tensile test involves loading the specimen to a specified strain level and subsequently unloading it, using the same strain rate as during loading, until a defined force level is reached. In this study, two consecutive cycles were performed. The higher strain level was selected to approach the maximum elongation as closely as possible without causing specimen failure. The lower, preceding strain level was defined as 50% of the second strain level. Since the three adhesives exhibit different maximum elongations, the strain levels for the cyclic tests were determined individually for each adhesive. After the first cycle, the specimens were unloaded to a force level of 1N and immediately reloaded. Due to the viscous component of the material behaviour, the strain had not yet returned to zero at this point. After the second cycle, the specimens were again unloaded to 1N. The applied strain rate was 0.01 s⁻¹. The test procedure is illustrated in Fig. 10.
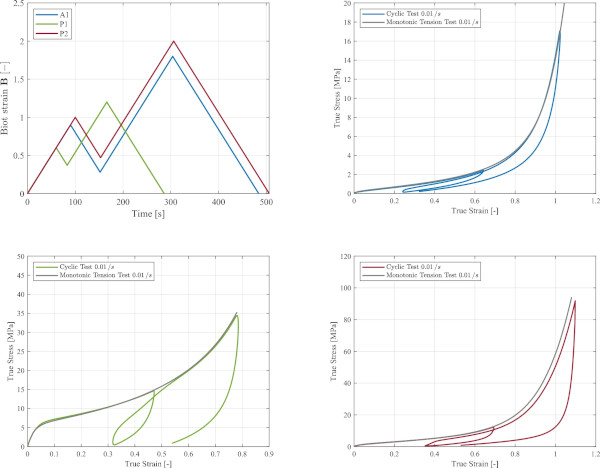
In Fig. 10, the mean curves of every material (colored) are plotted versus the mean curve of the monotonic uniaxial tension tests (grey). LCPI A1 exhibits the smallest hysteresis. P1 showed a pronounced residual deformation after the second cycle; however, this deformation fully recovered after the test. Furthermore, A1 and P1 appear to return to the path of the monotonic tensile test curve after the first cycle, whereas the curves of P2 remain below this reference curve for the rest of the test procedure after the first cycle.
2.3.3 Uniaxial relaxation tests
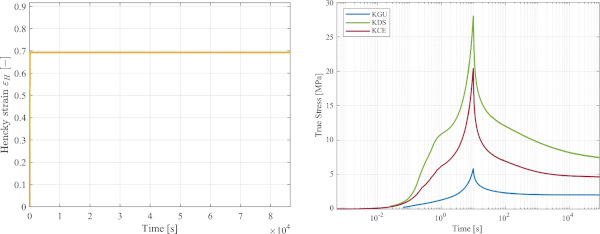
In a relaxation test, the specimen is deformed to a specific strain level, which is then held constant for a certain duration. Due to the viscoelastic material behaviour, the stress in the specimen decays over time. For cross-linked materials, such as those investigated in this paper, an equilibrium stress (also referred to as infinity stress level) is reached for . For the conducted relaxation tests, the applied strain level was chosen to correspond to 100% engineering strain. Loading to this strain was performed at the highest strain rate investigated, 0.1 s⁻¹. Due to the duration of the tests, a reduced number of 5 specimens for each material was tested.
The results are depicted in Fig. 11. When comparing the curves, it is noticeable that P1 has not yet completed the relaxation process after 24 h. The stress reduction observed during relaxation is consistent with the magnitude of the hysteresis observed in the cyclic tests. A1 again exhibits the lowest energy dissipation, whereas P1 shows the highest and P2 lies between the other two materials.
2.3.4 Bulge tests
Since there is no standard for biaxial tensile testing of polymers, various specimen geometries and test setups are reported in the literature. A distinction is generally made between cross-shaped specimens and circular specimens, but rectangular specimens have also been tested in the literature. A detailed overview is given in Esmaeili et al. (2023). A sophisticated method is to inflate the specimen using hydraulic or pneumatic pressure, as done by e.g. Sasso et al. (2008) and Drass (2020). In general, the use of pneumatic pressure is preferred over hydraulic pressure, as contact with a liquid can additionally influence the material behaviour of the specimen. This approach has the advantage that influences from the specimen clamping are almost completely eliminated, so that failure occurs within the homogeneous stress region. A disadvantage of this method is that the test can only be performed under pressure control, and the pressure is measured as the applied input pressure, not as the actual force acting on the specimen. The test setup and the experimental results are depicted in Fig. 12.
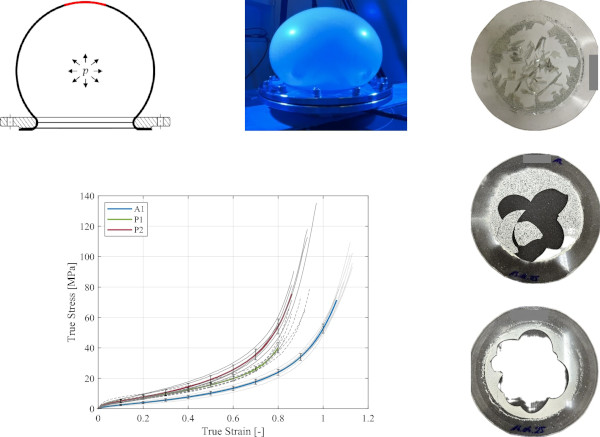
Strain measurement in the Bulge Test is performed using digital image correlation (DIC). For this purpose, a speckle pattern is applied to the specimen surface, and changes in the pattern are tracked over time. From the measured displacements of the pattern points, displacement and strain fields on the specimen surface are computed. Subsequently, an optimal spherical fit is applied to the strain field, allowing the outer radius Ra to be calculated. Thereby, it is essential to consider only the central strain region for evaluation, where a homogeneous biaxial stress distribution prevails, and the assumption of a perfect spherical shape is justified. Assuming a thin membrane (σ₃≈0) and incompressible material behavior, the current thickness is calculated:
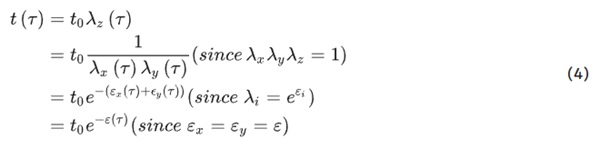
Using Eq. (4), the stress is calculated via a modified Barlow’s formula:

The results are depicted in Fig. 12. In contrast to the uniaxial tensile tests, P2 exhibits a similar initial stiffness to P1 in the bulge test and becomes increasingly stiffer than P1 with increasing strain. A1 again shows the lowest stiffness. As observed in the uniaxial tensile tests, P1 fails at the lowest strains. Unlike in the uniaxial case, however, the influence of specimen damage caused by the punching process can be excluded in the bulge test, as failure consistently occurred in the center of the specimen. P1 and P2 exhibited similar fracture patterns, in which larger, petal-like fragments were torn from the specimen. In contrast, A1 shows a fundamentally different fracture pattern, with the specimens breaking into a large number of small, rectangular fragments.
2.4 Small-scale laminated tests
There are several standardized procedures for single-lap and double-lap shear testing. DIN EN 1465 specifies tests for determining the tensile shear strength of overlap joints, DIN EN 14869-2 covers the procedure with thick adherends, and DIN EN ISO 13445 defines the block shear test procedure. Double-lap shear tests, as specified in ISO 1827, are not suitable for the fabrication and execution of thin-film glass-to-glass adhesive joints. Therefore, a modified single-lap shear test setup was used.
To improve the strain measurement using DIC, it is advantageous to employ rectangular specimens. In order to represent an accurate, simple shear stress state, the height-to-width ratio of the adhesive layer must be kept as small as possible (Bergström 2015). Therefore, the specimens consisted of fully bonded small glass plates 45 × 45 × 6 mm that were bonded into a metal fixture. The adhesive for the glass-metal joint was a two-component epoxy resin (Körapox 439 from HB Fuller/ Kömmerling), which is significantly stiffer than the interlayer adhesives under investigation. A double-hinge connection was installed between the specimen and the force cylinder in order to minimise constraint-induced stresses and to ensure a pure simple shear state. Eight specimens were tested for each material.
The amount of shear can be calculated by dividing the longitudinal deformation by the thickness of the adhesive:

From this, the equivalent tensile strain can further be calculated:

The shear stress is obtained by dividing the measured force by the cross-sectional area of the specimen:

For each material, eight specimens were tested. The experiments were conducted in a temperature-controlled room at 20 ± 1 °C. Prior to testing, the specimens were conditioned for at least 24 h in a climate chamber at 20 °C and 50% relative humidity. The test speed was 0.5 mm/min, as was used in Botz (2020) to improve comparability. The test setup and the results are shown in Fig. 13.
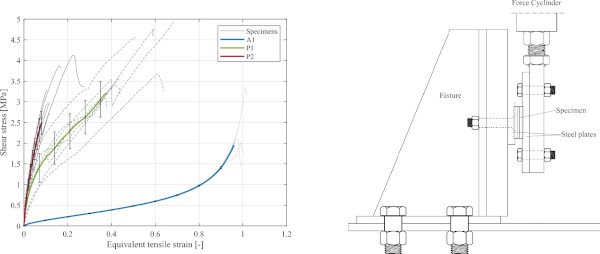
Similar to the biaxial tensile tests, P2 also exhibits a stiffer material response than P1 in the simple shear tests. P1, in contrast, shows a large scatter even in the laminated configuration. Unlike in the other test setups, P2 fails at the lowest deformations in the shear mode. A1 clearly exhibits the softest material behavior and the highest failure strains. In total, four failure modes were observed:
a. Interlayer delamination,
b. Simultaneous interlayer delamination and glass breakage,
c. Local spalling of the glass ply, and
d. Failure of the steel-to-glass bonding
For adhesive A1, interlayer delamination occurred in all cases. For P1, all four failure modes were observed, depending on the individual specimen, whereas for P2, failure modes (b), (c), and (d) occurred. Consequently, the reported failure stresses and strains for P1 and P2 do not represent intrinsic failure properties of the adhesives themselves but rather correspond to the failure limits of the test setup.
3 Discussion
Overall, the experimental results provide a promising assessment of the investigated materials. In the pendulum impact tests, the test corresponding to the highest drop height according to DIN EN 12600 was successfully passed for all materials, despite pre-damage of the specimens. This indicates good post-fracture behavior and a fundamental suitability of the adhesives for use in laminated safety glass. It should be noted, however, that suitability for application in laminated safety glass additionally requires verification of durability in accordance with DIN EN ISO 12543-4.
Furthermore, all materials exhibited a material behavior in the uniaxial tensile tests that can be classified as viscoelastic. All materials showed a dependence on the loading rate and recovered completely to their original length after the cyclic as well as relaxation tests. A summary of the test results regarding minimum failure strains and minimum failure stresses is given in Table 3. Note that the values are given dependent on the values of the figures in the respective chapters, i.e., true strains and stresses for uniaxial and biaxial loading and engineering strains and stresses for shear loading.
According to the manufacturers’ data sheets, the Young’s modulus of P1 is 65 MPa, which is significantly below the values at hand, while the Young’s modulus of P2 was given to be 280 MPa, which is higher than the measured values. For P2, a pronounced increase in the initial stiffness was observed at the highest deformation rate. It is therefore possible that the manufacturer’s specified value could be reached at even higher deformation rates. On the other hand, the modulus of A1 corresponds to the one given by the manufacturer (27 MPa vs. 26.3 MPa for a strain rate of 0.1/s).
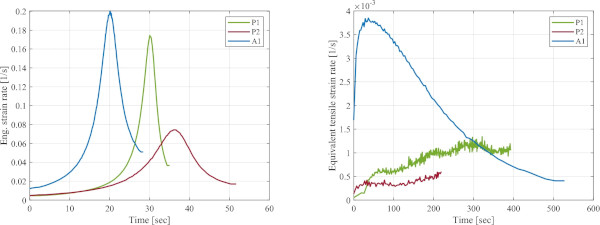
In the relaxation tests, no equilibrium stiffness level, characterized by a horizontal asymptote of the stress in the logarithmic time scale, was observed for P1. Therefore, further relaxation tests with longer durations are necessary to define this stress state. Both the biaxial tensile tests and the shear tests yielded robust results. In both stress states, P2 exhibited a stiffer material response than P1, which is opposite to the behavior observed under uniaxial loading. Moreover, P1 also showed a large scatter in material behavior in these tests. Nevertheless, it must be taken into account that different loading rates were imposed on the adhesives due to the respective test configurations. This can be illustrated by calculating the average deformation rate for each test, which is shown in Fig. 14. Due to the different stiffness response of the materials, the curves of the corresponding strain rates appear significantly different. This also accounts for the stiffness moduli given in Table 3. During the shear tests, the high stiffness of P1 and P2 caused a partial compensation of the applied deformation within the experimental setup. Furthermore, owing to the very small deformation levels, the resulting curves exhibit a higher degree of noise than those of A1.
Although a detailed comparison to established interlayer materials such as PVB is outlined for future research, it can be stated that at least the Polyurethane LCPIs exhibit mechanical properties that are able to outperform PVB in terms of initial stiffness. This is an important factor in the design of laminated safety glass, since the consideration of shear coupling in the intact state strongly depends on the initial stiffness of the interlayer.
4 Conclusion and outlook
In this paper, a comprehensive data set is provided via an extensive test program for three different liquid cold-poured interlayer adhesives. The materials were investigated under various stress states, and their viscoelastic properties were examined in detail under uniaxial loading. This establishes a solid basis for further analyses, in particular with regard to the development of material models.
The conducted pendulum impact tests justify a more detailed consideration of all investigated materials for application in laminated safety glass. The uniaxial tensile tests reveal the strain-rate and time-dependent behavior of the materials and provide a basis for further investigations, including comparisons with established interlayer materials such as PVB, EVA, and ionomers. With the biaxial tensile tests and single-lap shear tests, all relevant stress states of the materials have been investigated.
Future work will focus on the modeling of the material behavior in order to move closer to the overall goal of a simulation-based verification of the post-fracture behavior of laminated safety glass, with particular emphasis on accurately representing the interlayer material behavior under large deformations. In addition, further experimental investigations are considered in order to examine the material behavior under shear stress states more thoroughly. This could be achieved by means of planar tension tests, which can resemble a pure shear stress state for nearly incompressible materials.
Data availability
The data that support the findings of this article will be available from the corresponding author upon reasonable request.