Article Information
- Digital Object Identifier (DOI): 10.47982/cgc.10.703
- Published by Challenging Glass, on behalf of the author(s), at Stichting OpenAccess.
- Published as part of the peer-reviewed Challenging Glass Conference Proceedings, Volume 10, June 2026, 10.47982/cgc.10
- Editors: Christian Louter, Freek Bos & Jan Belis
- This work is licensed under a Creative Commons Attribution 4.0 International (CC BY 4.0) license.
- Copyright © 2026 with the author(s)
Authors: Cas Maertens a , Bert Van Lancker b,c , Jérôme Van Alboom c , Roman Wan-Wendner c , Jan Belis c
a Ghent University, Belgium
b Vitroplena, Belgium
c Ghent University, Belgium

Abstract
The durability of glass-steel adhesive joints is a key consideration in hybrid structural applications, where environmental exposure may influence the mechanical response of epoxy adhesives. This study examines two bonded glass-steel configurations using an unfilled (UF) and a particle-filled (F) epoxy. Specimens were conditioned under different environmental exposures, including elevated temperature (95°C), sub-zero temperature (-10°C), high relative humidity (95% RH) and water immersion, followed by pull-off testing. Force and crosshead displacement were used to derive global, configuration-dependent response parameters (nominal strain, global stiffness and strain energy density), which do not represent intrinsic material properties of the adhesive layer, each evaluated relative to a 23 °C reference state. At the reference condition, the filled epoxy exhibited a considerably higher ultimate stress and a greater deformability than the unfilled system. The unfilled epoxy showed relatively stable behaviour across most conditioning regimes, whereas the filled epoxy demonstrated pronounced sensitivity, with strength reductions of up to 69% under high humidity and 53% under sub-zero exposure. Elevated-temperature conditioning resulted in adhesive-specific and time-dependent responses: short exposure increased stiffness and strength in the unfilled system, while the filled system weakened initially and recovered only partially after seven days. The results highlight that environmental exposure significantly influences the mechanical response of bonded glass-steel joints.
1. Introduction
The use of structural glass in load bearing and façade applications has increased significantly over the past decades, driven by architectural demand for transparency and material efficiency. In this context, adhesive bonding has emerged as a promising joining technique for glass-metal hybrid systems, enabling stress homogenisation, aesthetic detailing and the avoidance of stress concentrations associated with mechanical fixings. Structural adhesive bonding in glass engineering allows for continuous load transfer, reduced ultimate stresses and enhanced design flexibility, making it particularly attractive for façade elements and secondary structural components (Overend et al. 2011, Van Lancker et al. 2016).
Despite these advantages, the long-term performance of adhesively bonded glass-steel joints remains a critical concern. In façade applications, bonded connections are continuously exposed to variable environmental conditions, including temperature fluctuations, high relative humidity and occasional water exposure. These environmental stressors can significantly influence the mechanical response of polymer-based adhesives through mechanisms such as plasticisation, post-curing, thermal softening, moisture diffusion and interfacial degradation (Wei et al. 2024; Silvestru et al. 2019). It is also important to note that in practice, environmental actions may interact, leading to coupled effects that cannot be directly inferred from isolated exposure conditions. In addition, ultraviolet (UV) radiation may contribute to long-term degradation of adhesive systems in façade applications, although this aspect is not considered in the present study. The glass transition temperature (T g) represents a key parameter governing the thermal behaviour of epoxy adhesives, as it defines the transition from a glassy to a more rubber-like state. Furthermore, Tg may evolve under hygrothermal exposure due to post-curing or moisture-induced effects, which is particularly relevant for elevated-temperature conditioning.
The mechanical response of epoxy adhesives under environmental exposure is governed by coupled thermal and moisture-related mechanisms. Elevated temperatures may initially increase stiffness and strength due to continued crosslinking (post-curing), whereas prolonged exposure can lead to thermal softening or degradation as the glass transition temperature is approached. Conversely, moisture ingress may result in reversible plasticisation in the short term and irreversible interfacial weakening over extended durations. (Zhou & Lucas 1999; Firmo et al. 2019; Moller et al. 2020).
Although the bulk behaviour of structural adhesives under environmental ageing has been extensively investigated, fewer studies focus specifically on glass-steel adhesive interfaces using pull-off configurations. Nevertheless, pull-off testing provides a relevant means of assessing the tensile capacity and failure behaviour of bonded interfaces, as it induces a predominantly normal stress state that is representative for local detachment mechanisms that may occur in bonded glass-steel assemblies. In addition, the test configuration allows the adhesive-substrate interface to be investigated in a relatively controlled manner, making it suitable for comparative durability studies of different adhesive formulations. Moreover, durability studies often report changes in ultimate strength only, while strain capacity, stiffness evolution and strain energy density are less frequently quantified in a systematic and comparative manner. From a structural engineering perspective, however, these parameters are essential to assess deformability, energy dissipation capacity and redistribution potential within hybrid glass-metal assemblies (Silvestru et al. 2019; Overend et al. 2011). In addition, limited information is available on the relative degradation (or improvement) with respect to a controlled reference state, which enables a clearer assessment of environmental sensitivity and supports material selection for façade applications (Wei et al. 2024).
While adhesive bonding is frequently applied in specific configurations such as adhesive point fixings or structural sealant glazing systems, the present study does not focus on a single predefined application. Instead, a simplified and generic glass-steel pull-off configuration is adopted to enable a controlled and comparative assessment of adhesive behaviour. This approach allows the identification of trends in stiffness, strength, deformability and energy absorption under varying environmental conditions. The intent is therefore not to reproduce a specific structural detail, but to provide insights that support the selection of suitable adhesives across a range of glass-metal bonding applications.
The present study addresses these gaps by experimentally assessing the effect of six environmental conditioning regimes relative to a 23°C reference on the mechanical response of bonded glass–steel specimens incorporating two epoxy adhesive formulations, covering low-temperature exposure, elevated-temperature ageing, high relative humidity and full water immersion for both 24 h and 7 d durations.
Mechanical response is evaluated using pull-off testing of glass-steel specimens, as this method induces a well-defined tensile stress state normal to the bonded interface and is particularly sensitive to environmentally induced degradation of adhesive joints. Systematic determination is performed of ultimate tensile stress, strain at failure, global stiffness parameter and strain energy density, defined as the area under the stress-strain curve up to ultimate stress. By quantifying both stiffness- and energy-related response parameters and expressing their variation relative to the reference condition, this study enables a comparative assessment of the environmental sensitivity of bonded glass-steel joints incorporating two epoxy adhesive formulations. The findings contribute to improved understanding of degradation and conditioning effects in bonded glass structures and support the development of more reliable bonded connections for architectural applications.
2. Materials and methods
2.1. Adhesive systems
Two epoxy adhesive systems derived from the same base formulation were investigated. Both adhesives are based on a two-component epoxy system consisting of a resin (component A) and a hardener (component B). According to the technical data provided by the supplier, the adhesive system has a prescribed mixing ratio of 3:1 by weight (component A to component B) and a relatively low viscosity in the uncured state. The pot life at room temperature is approximately 45-50 minutes.
The first investigated system corresponds to this unfilled base adhesive (UF). The second system (F) is based on the same epoxy formulation but contains added filler particles. These fillers increase the viscosity of the uncured adhesive and result in a non-transparent, light-coloured appearance, in contrast to the transparent unfilled system. Besides these modifications, both systems share the same base chemistry. Differences in stiffness and strength at the 23°C reference condition are presented in Section 4.1.
The objective of this study was not to establish intrinsic material differences between the two adhesive systems, but rather to isolate the influence of environmental conditioning on each bonded configuration. Given that the adhesives exhibit different baseline mechanical responses under reference conditions, evaluating their behaviour relative to their own 23°C reference state enables a clearer assessment of conditioning-induced changes independent of initial stiffness or strength levels. Both adhesives were prepared in accordance with the manufacturer’s specified mixing ratio, application procedure and curing conditions.
2.2. Specimen preparation
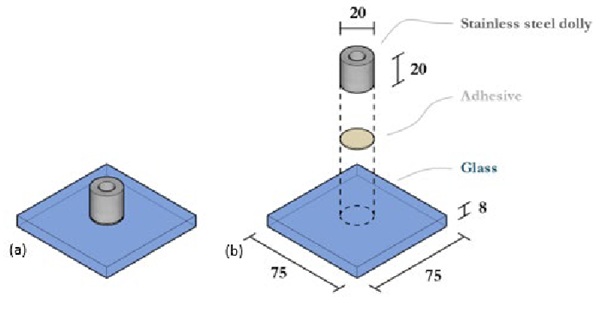
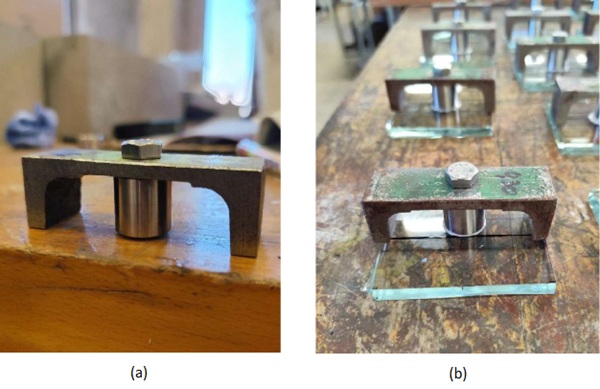
The specimen used for the pull-off test is illustrated in Fig. 1.
Pull-off specimens consisted of a stainless steel dolly adhesively bonded to a float glass substrate. Glass plates were cut from 8 mm thick annealed float glass into square specimens measuring 75 × 75 mm. The bonding surface corresponded to the atmosphere side of the float glass, which was identified prior to specimen preparation using ultraviolet detection.
Cylindrical stainless steel dollies (diameter 20 mm, height 20 mm), identical to those previously used in the research of Belis et al. (2011), were used. The bonded interface was therefore defined by a circular area with a nominal diameter of 20 mm.
Prior to bonding, the glass surface was cleaned with acetone to remove contaminants, while the stainless steel bonding surface was lightly abraded with P180 sandpaper to promote mechanical interlocking and subsequently cleaned with acetone to remove dust and debris. The adhesive was then deposited centrally using a calibrated syringe to ensure controlled volume application. The applied volume was predefined based on the target adhesive thickness and bonding diameter, ensuring a consistent bonded area across all specimens. A nominal adhesive thickness of approximately 0.3 mm was targeted, with the required adhesive volume determined from the bonding area and desired thickness.
The two adhesive systems exhibited different rheological behaviour during application: the unfilled epoxy (UF) showed a relatively low viscosity and fluid-like behaviour, whereas the filled system (F) behaved more paste-like due to the presence of filler particles. Despite the lower viscosity of the unfilled system (UF), no significant flow outside the intended bonding area was observed. This behaviour is attributed to the combined effect of surface tension and viscous resistance of the adhesive, together with the limited applied volume, which restricted spreading beyond the contact zone.
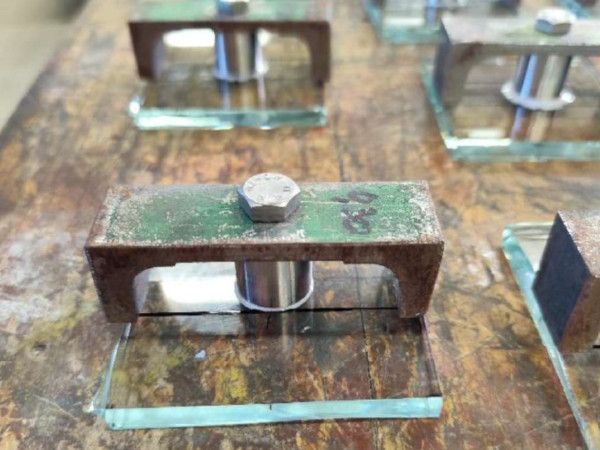
The dolly was positioned and mechanically fixed using a rigid alignment bridge (Fig. 2), which ensured concentric placement and maintained a predefined offset above the glass surface, thereby controlling the adhesive layer thickness. After curing, the actual adhesive thickness was measured using a digital calliper to account for potential variations due to curing shrinkage and specimen preparation.
After assembly, specimens were cured under controlled laboratory conditions (23 °C, 50 % RH) for at least seven days prior to environmental conditioning, ensuring full curing in accordance with the manufacturer’s specifications. Minor variations in curing duration occurred due to testing on different days; however, all specimens were stored under identical conditions and no systematic differences in curing time existed between configurations.
2.3. Environmental conditioning
The environmental conditioning regimes were defined to simulate representative service-related degradation mechanisms in glass-steel adhesive joints. In façade applications, bonded connections may be exposed to elevated temperatures, high relative humidity, sub-zero conditions and direct water contact, all of which can influence adhesive stiffness, strength and interfacial integrity over time. The selected scenarios therefore targeted the principal environmental drivers of degradation: thermal exposure, humid ageing, freezing conditions and water immersion.
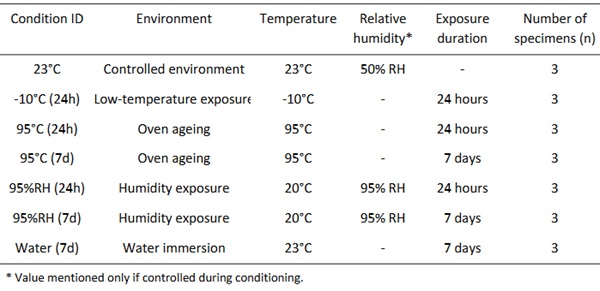
The ageing protocol consisted of 24 h at 95°C, 24 h at 95% relative humidity (RH), 24 h at -10°C, 7 d immersed in water, 7 d at 95°C and 7 d at 95% RH. These conditioning regimes were derived from exposure scenarios commonly adopted in structural adhesive durability assessment. Although the present pull-off configuration is not prescribed by a dedicated testing standard, the conditioning strategy aligns conceptually with durability evaluation principles outlined in NBN EN 14258 (2004), NBN EN ISO 9142 (2003), ETAG 002 (2012) and EAD 090010-00-0404 (EOTA, 2023). These documents recommend thermal, humid and immersion exposures to assess adhesive performance under representative environmental stressors.
The exposure durations of 24 h and 7 d were selected to induce measurable thermal- and moisture-related effects while remaining within practical laboratory timeframes for comparative durability studies. All specimens were subjected to the predefined conditioning regimes prior to testing, as summarised in Table 1. Conditioning was performed in temperature- and/or climate-controlled facilities depending on the target environment, and specimens remained under their assigned regime for the specified duration to ensure a stable thermal and moisture state.
Following conditioning, all specimens were transferred to a controlled environment of 23°C and 50% RH and allowed to equilibrate for 24 h prior to testing. This stabilisation step minimised transient thermal or hygroscopic effects and ensured consistent testing conditions across exposure groups.
Table 1: Summary of the environmental conditioning scenarios used to evaluate the durability of glass–steel adhesive joints.
2.4. Mechanical testing
The pull-off resistance of the glass-steel bonded specimens was evaluated using an Instron 5982 universal testing machine (UTM) with a nominal load capacity of 100 kN. The force measurement accuracy was ±0.4% of the reading (down to 1 kN). Force and machine crosshead displacement were continuously recorded throughout the test.
The tests were conducted under displacement control at a constant crosshead rate of 0.2 mm/min. Specimens were connected to the UTM through an M8 threaded steel rod (diameter 8 mm) with a length of 100 mm screwed into the loading dolly. The rod was intentionally left rotationally unconstrained prior to loading, providing a self-aligning connection. This arrangement minimises parasitic bending moments resulting from minor geometric imperfections or setup misalignment and promotes predominantly axial loading of the adhesive joint. The experimental configuration is depicted in Fig. 3.
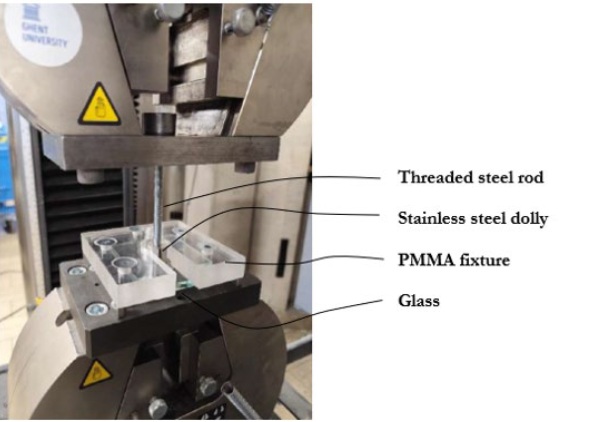
The glass plate was supported in a custom-manufactured polymethyl methacrylate (PMMA) fixture with a thickness of 25 mm, designed to restrain out-of-plane displacement while allowing direct load transfer through the bonded interface. The fixture was rigidly positioned on the base of the testing machine using steel screws. PMMA was chosen for its rigidity, ease of fabrication and transparency, which allowed visual control of the specimen during testing.
Although PMMA is less stiff than steel, the elastic deformation of the fixture was estimated to remain limited relative to the deformation of the adhesive layer. Based on the Young’s modulus of PMMA (≈3.4 GPa) and the fixture geometry, the maximum elastic deformation under the expected failure loads was estimated to be approximately 6 μm. Compared with the nominal adhesive thickness of 0.3 mm, this corresponds to an estimated deformation contribution of approximately 2%. However, given the identical testing configuration adopted for all specimens, this influence was considered acceptable for comparative evaluation between conditioning regimes.
The measured displacement corresponds to the crosshead movement and therefore represents the cumulative deformation of the entire load path as expressed in Equation (1), including the adhesive layer, glass substrate, steel dolly, test fixture and machine compliance.

The use of crosshead displacement inherently prevents the extraction of intrinsic material parameters of the adhesive layer alone. Consequently, the present study focuses on configuration-dependent global response metrics derived from the cumulative deformation of the bonded assembly. Experimental techniques capable of directly resolving local adhesive deformation, such as digital image correlation (DIC) or local displacement transducers, would be required to isolate intrinsic adhesive strain behaviour. Since all specimens were tested using identical geometry, loading rate and fixture configuration, the obtained response metrics allow comparative interpretation of the influence of environmental conditioning on the global behaviour of the bonded assemblies.
3. Data processing
The pull-off tests provided force and crosshead displacement as a function of time. Raw data were exported to spreadsheet format and processed to ensure consistent evaluation of mechanical parameters for all specimens and conditioning regimes.
For each environmental condition, three nominally identical specimens were analysed individually before statistical aggregation.
3.1. Stress-strain calculation
The nominal tensile stress in the adhesive layer was calculated by dividing the measured force by the bonded area. The bonded area was constant for all specimens. Stress values were expressed in megapascals (MPa).

where σ is the nominal tensile stress, F is the measured force (N), A is the bonded area (mm²).
The strain was derived from the measured crosshead displacement and the measured adhesive layer thickness of each specimen. The actual thickness t of the adhesive layer was measured for each specimen using a calliper.
The measured displacement 𝛿 corresponds to the total crosshead movement and therefore represents the cumulative deformation of the complete load path, as described in Equation (1). Consequently, the derived strain does not represent the intrinsic strain of the adhesive layer, but rather a global deformation measure of the complete test configuration.
In this study, this quantity is referred to as the nominal strain, indicating that it is derived from crosshead displacement and includes contributions from all elements in the load path.

where ε is the nominal strain (-), δ is the crosshead displacement (mm), t is the adhesive thickness (mm). For reporting and plotting purposes, strain values are expressed in percent.
The resulting stress-strain response should therefore not be interpreted as a material constitutive relation, but as a configuration-dependent representation of the global mechanical behaviour.
3.2. Global stiffness parameter and strain normalisation
The stress-strain response obtained from the pull-off tests typically exhibited a first regime characterised by a reduced stiffness due to system compliance, followed by a more stable quasi-linear regime at higher stress levels. This behaviour is associated with the progressive mobilisation of system compliance, seating effects and local accommodation within the load path. As the load increases, these effects progressively stabilise and the load transfer within the tested configuration becomes more consistent. As a result, the measured curves show horizontal offsets and increased scatter in strain values, complicating direct comparison between specimens.
To improve comparability between specimens and to reduce scatter associated with seating effects and system compliance, a strain offset removal procedure was applied to each curve based on the quasi-linear portion of the stress-strain response that develops at higher stress levels. A horizontal strain offset was removed from each curve in order to align the quasi-linear response between specimens. This offset primarily originates from seating effects and system compliance within the load path.
For each specimen, a stress-based fitting window was defined between 60% and 90% of the ultimate stress. This interval was selected to exclude the initial non-linear response associated with seating and compliance effects, while remaining sufficiently below the ultimate stress to avoid instability effects. This procedure does not recover intrinsic adhesive strain but provides a pragmatic alignment of the curves to enable consistent comparison of global response parameters.
A linear regression of the form

was performed within this interval, where 𝑘global is the global stiffness parameter of the tested configuration (MPa), 𝜀 is the nominal strain (-), and 𝑏 is the intercept of the regression.
The slope of the regression line represents a configuration-dependent global stiffness parameter and should not be interpreted as the Young’s modulus of the adhesive material. Instead, it characterises the global stress-strain response of the tested configuration within the selected quasi-linear regime. The selected stress interval (60-90% of the ultimate stress) defines a consistent evaluation window in which the influence system compliance is reduced and is not intended to represent the intrinsic constitutive behaviour of the adhesive.
Because the regression generally yielded a non-zero intercept, a horizontal strain offset was determined to align the quasi-linear portion of the curves between specimens. The strain offset was calculated as

The offset-corrected strain was then obtained as

This procedure removes the initial strain offset without modifying the stress values or altering the slope of the quasi-linear regime. It enables consistent comparison of configuration-dependent response parameters between specimens. All strain-based response parameters reported in this study are derived from the offset-corrected strain 𝜀′. This procedure does not recover intrinsic adhesive strain but provides a pragmatic means of reducing the influence of seating effects and system compliance for comparative analysis between specimens tested under identical configurations and conditions.
Figure 4 presents a representative example of the strain offset removal applied to the sample conditioned at -10°C for 24 h (UF), while the general strain offset removal procedure is illustrated in Figure 5.
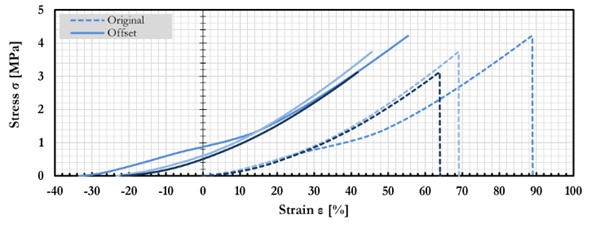
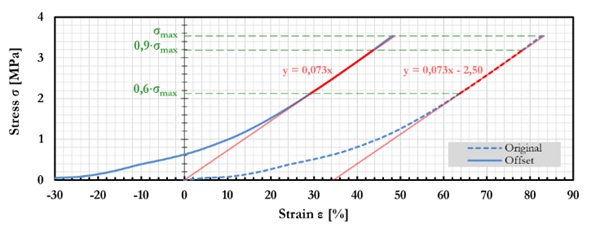
In Figure 5, the original stress-strain response (dashed blue curve) is shown together with the offset-corrected curve (solid blue curve). The quasi-linear response regime is identified between 60 % and 90 % of the maximum stress (green dashed lines), and linear regressions are performed within this interval. For the original curve, the regression yields a non-zero intercept, reflecting a strain offset due to seating and system compliance effects within the load path. The strain offset removal shifts the curve horizontally such that the regression line passes through the origin, while preserving the slope of the quasi-linear response. Red lines indicate the regression fits and their corresponding equations, expressed with stress as a function of nominal strain in percent.
It should be noted that the presence of a lower-slope regime at lower stress levels may give the impression of a bilinear stress-strain response. This behaviour does not reflect an intrinsic bilinear material response of the adhesive layer but rather results from the gradual stabilisation of the load transfer within the test configuration and the progressive engagement of the stiffness of the load path. Once this stabilised regime is reached, the response becomes quasi-linear and more representative of the global mechanical behaviour of the tested system. For this reason, the global stiffness parameter is evaluated only within the 60-90 % stress interval, where the influence of system compliance effects is minimised while remaining sufficiently below the ultimate stress to avoid instability effects.
Since all specimens were tested using identical geometry, loading rate and fixture configuration, the response based on offset-corrected strain enables meaningful comparison of trends between conditioning regimes. The present methodology is therefore aimed at improving inter-specimen comparability of the global system response, rather than at determining intrinsic constitutive parameters of the adhesive material.
3.3. Ultimate values and strain energy density to failure load
The ultimate stress was defined as the maximum stress recorded during the test. The corresponding offset-corrected strain at this point was reported as the strain at failure load. For consistency, all stress-strain curves were truncated at the maximum stress prior to further processing.
To characterise the energy absorption capacity of the tested system up to failure load, the energy absorption per unit volume was determined as the area under the stress-strain curve up to the maximum stress. This quantity represents the mechanical work per unit volume associated with loading the tested system from the reference state to the ultimate stress condition.
The energy density to failure load was calculated as

where 𝑈failure is the strain energy density to failure load (kJ/m³), 𝜀max is the nominal strain corresponding to the maximum stress and 𝜎 is the applied stress. The definition adopted here follows the general mechanical definition of strain energy density as the work per unit volume associated with the stress-strain response (Bower 2010).
Only the response up to the maximum stress was considered. This avoids assumptions regarding post-peak softening behaviour, which may be influenced by instability and localisation effects in the bonded configuration and ensures consistent comparison between conditioning regimes.
Because the strain used in the present work represents a global deformation parameter of the complete load path, the calculated 𝑈failure should be interpreted as a configuration-dependent energy absorption metric rather than as an intrinsic fracture energy of the adhesive material. This parameter includes deformation contributions from both the bonded specimen and the test setup and cannot be attributed solely to the adhesive layer.
3.4. Mean curve construction and mean stiffness parameter
A mean stress-strain curve (based on offset-corrected strain 𝜀′) was constructed to represent the average structural response for each conditioning regime. This mean curve represents the global response of the tested configuration, including contributions from the full load path. For this purpose, the offset-corrected strain 𝜀′ of each specimen was normalised by its individual peak value. The resulting mean normalised curves were subsequently interpolated onto a common strain axis and averaged pointwise.
The resulting mean normalised curve was then rescaled using the average peak offset-corrected strain of the corresponding specimen group. The endpoint of the reconstructed mean curve was therefore fixed at the average ultimate stress and the average ultimate nominal strain. The resulting mean curve represents the global response of the tested system and includes contributions from the complete load path.
A mean global stiffness parameter was determined from the reconstructed mean curve. This parameter represents the overall stiffness of the tested configuration under the given test conditions. The same stress window as defined for the individual specimens (60-90 % of the mean ultimate stress) was applied to ensure methodological consistency. Within this interval, a linear regression constrained to pass through the origin was performed:

where 𝑘global is the mean configuration-dependent global stiffness parameter (MPa).
3.5. Statistical analysis
For each test condition, the following response parameters were reported per specimen: ultimate stress, strain at failure (based on offset-corrected strain 𝜀′), global stiffness parameter 𝑘global , and strain energy density to failure load 𝑈failure.
For each conditioning regime, the mean value and standard deviation were calculated. In addition, the percentage variation relative to the 23°C reference condition was determined to facilitate comparison between conditioning regimes.
For each conditioning regime, three specimens were tested (n = 3). While this sample size is consistent with exploratory durability investigations, the limited number of replicates reduces statistical power. Consequently, the results are used exclusively for comparative assessment of conditioning effects between configurations tested under identical conditions. The reported parameters describe the global response of the tested system and are not intended to provide statistically robust intrinsic material parameters.
4. Results
4.1. Reference behaviour (23°C)
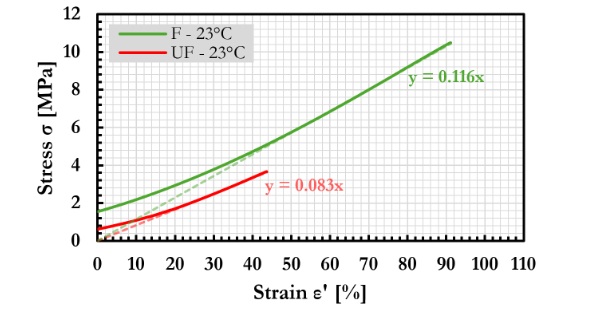
The mean stress-strain response (based on offset-corrected strain 𝜀′) of the bonded configurations at 23°C is presented in Figure 6. The red curve represents the unfilled epoxy (UF), while the green curve represents the epoxy with filler particles (F). The dashed lines indicate the linear regressions performed over 60-90 % of the maximum stress 𝜎max , as described in Section 3.2, for determination of the global stiffness parameter 𝑘global.
Across the considered strain range, the filled system (F) exhibits a higher stress level compared to the unfilled system (UF). In addition, the slope of the quasi-linear regime is greater for the filled configuration, resulting in a higher global stiffness parameter. It should be emphasised that the reported strain values represent offset-corrected and configuration-dependent deformation parameters and should not be interpreted as intrinsic adhesive strain capacity.
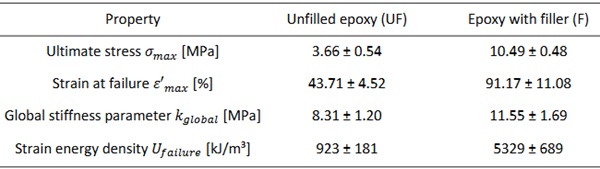
The mean response parameters derived from these curves are summarised in Table 2. The reported quantities include the ultimate stress 𝜎max , strain at failure 𝜀′max , global stiffness parameter 𝑘global and strain energy density to failure load 𝑈failure.
Table 2: Mean response parameters of F and UF bonded configurations at 23°C. Values represent mean ± standard deviation (n = 3).
4.2. Global stress-strain response
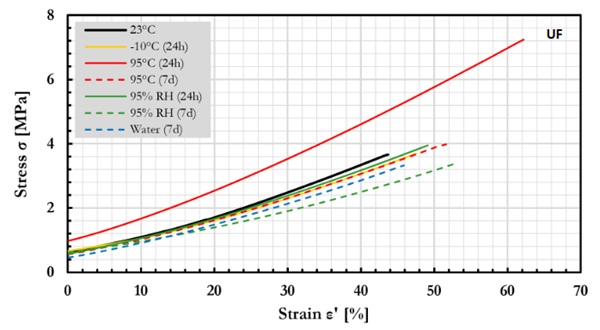
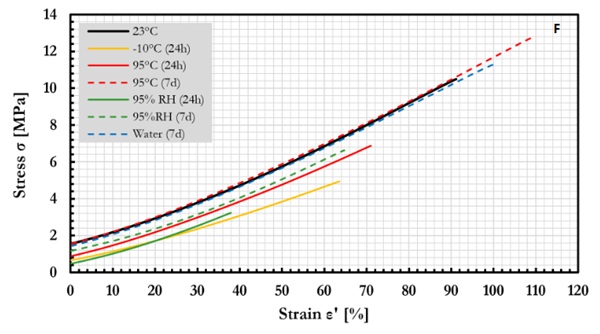
Figures 7 and 8 present the mean stress-strain curves based on offset-corrected strain 𝜀′ for the unfilled (UF) and filled (F) bonded configurations, respectively, including the reference condition (23°C) and all investigated conditioning regimes. The following exposure conditions are included: -10°C (24 h), 95°C (24 h and 7 d), 95% RH (24 h and 7 d) and water immersion (7 d). Solid lines correspond to specimens conditioned for 24 h, while dashed lines represent specimens conditioned for 7 days.
These figures provide an overview of the complete mean stress-strain response (based on offset-corrected strain 𝜀′) of each bonded configuration under the various environmental exposures. The quantitative response parameters derived from these curves, including ultimate stress, strain at failure (based on 𝜀′), global stiffness parameter 𝑘global and strain energy density are presented in detail in Sections 4.3 to 4.6.
4.3. Ultimate stress
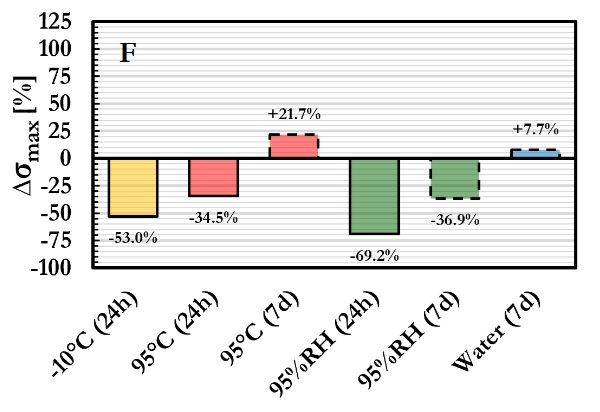
The ultimate stress values for both bonded configurations after environmental conditioning are summarised in Table 3. The relative variation with respect to the 23°C reference condition is shown in Figures 9 and 10.
Table 3: Ultimate stress after environmental conditioning, reporting mean ultimate stress, standard deviation and percentage variation relative to the 23°C reference condition.
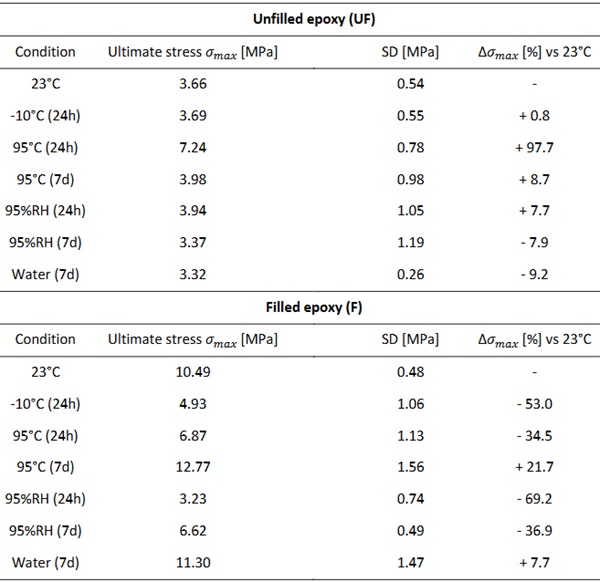
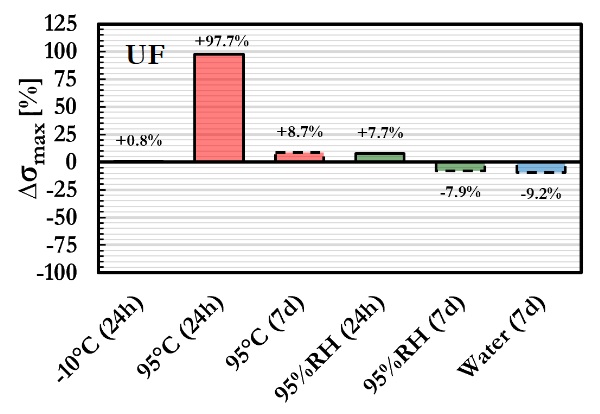
For the unfilled epoxy, the reference strength at 23°C was 3.66 MPa. Exposure to -10°C (24 h) had a negligible effect (+0.8%). A pronounced increase in ultimate stress was observed after exposure to 95°C for 24 h, reaching 7.24 MPa (+97.7%), which represents the highest value recorded for this adhesive. After 7 d at 95°C, the strength decreased to 3.98 MPa (+8.7%), approaching the reference level. Conditioning at 95% RH resulted in limited changes, with a slight increase after 24 h (+7.7%) and a reduction after 7 d (-7.9%). Water immersion for 7 d led to a decrease to 3.32 MPa (-9.2%), representing the lowest measured value for the unfilled system.
For the filled epoxy, the reference ultimate stress at 23°C was 10.49 MPa. Low temperature exposure (-10°C, 24 h) reduced the strength to 4.93 MPa (-53.0%). A reduction was also observed after 95°C exposure for 24 h (6.87 MPa; -34.5%), whereas prolonged exposure (7 d) resulted in an increase to 12.77 MPa (+21.7%), representing the maximum strength recorded for this adhesive. High relative humidity caused substantial reductions, particularly after 24 h at 95% RH (3.23 MPa; -69.2%). After 7 d at 95% RH, the strength partially recovered to 6.62 MPa (-36.9%). Water immersion for 7 d resulted in 11.30 MPa (+7.7%), slightly exceeding the reference value.
4.4. Strain at failure
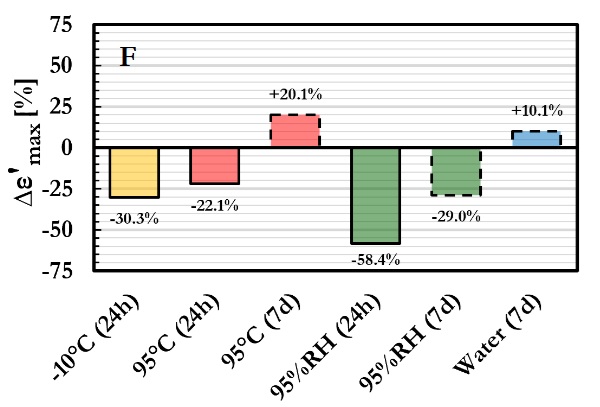
The strain at failure values (based on offset-corrected strain 𝜀′) for both bonded configurations after environmental conditioning are summarised in Table 4. The relative variation with respect to the 23°C reference condition is shown in Figures 11 and 12.
Table 4: Strain at failure (based on 𝜀′) after environmental conditioning, reporting mean value, standard deviation and percentage variation relative to the 23°C reference condition.
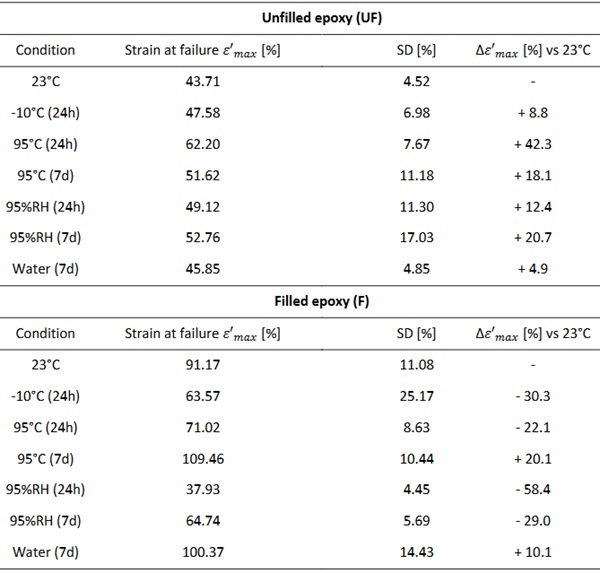
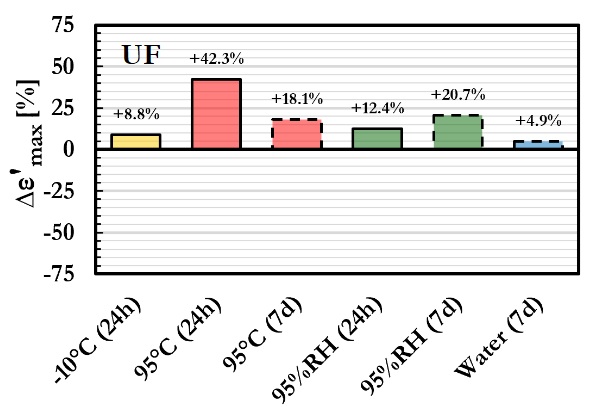
For the unfilled configuration, the strain at failure (based on 𝜀′) at 23°C was 43.71 %. Conditioning at -10°C for 24 h resulted in a value of 47.58 %, corresponding to an increase of 8.8 % relative to the reference condition. After exposure to 95°C for 24 h, the strain at failure increased to 62.20 %, representing a relative increase of 42.3 % and the highest measured value for this configuration within the investigated regimes. Following prolonged exposure at 95°C for 7 d, the value decreased to 51.62 %, corresponding to a +18.1 % variation compared to 23°C, yet remaining above the reference level. Conditioning at 95% RH resulted in values of 49.12 % after 24 h (+12.4 %) and 52.76 % after 7 d (+20.7 %). Water immersion for 7 d yielded a strain at failure of 45.85 %, corresponding to a +4.9 % variation. Overall, the unfilled configuration exhibited variations ranging from +4.9 % to +42.3 % relative to the reference condition, with all investigated regimes resulting in values equal to or higher than the 23°C reference.
For the filled configuration, the strain at failure (based on 𝜀′) at 23°C was 91.17 %, which is substantially higher than that of the unfilled configuration. Conditioning at -10°C for 24 h resulted in a reduction to 63.57 %, corresponding to -30.3 % relative to the reference. Exposure to 95°C for 24 h produced a value of 71.02 % (-22.1 %), whereas 7 d at 95°C resulted in 109.46 %, corresponding to an increase of 20.1 % and representing the maximum value measured for this configuration. Exposure to 95% RH resulted in 37.93 % after 24 h (-58.4 %) and 64.74 % after 7 d (-29.0 %). Water immersion for 7 d yielded 100.37 %, corresponding to a +10.1 % variation relative to the reference condition. In contrast to the unfilled configuration, both increases and decreases relative to the reference were observed for the filled configuration, depending on the conditioning regime and duration.
4.5. Global stiffness parameter
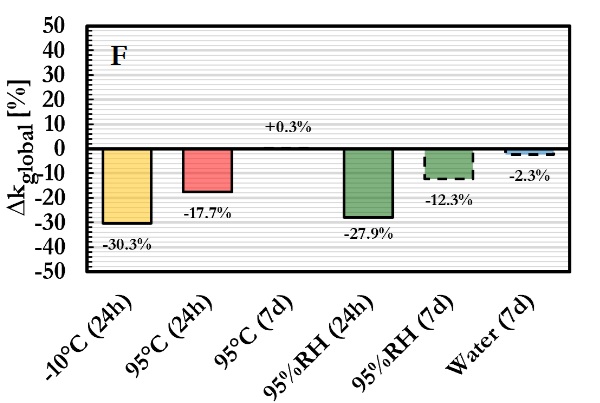
The global stiffness parameter 𝑘global for both bonded configurations after environmental conditioning are summarised in Table 5. The relative variation with respect to the 23°C reference condition is shown in Figures 13 and 14.
Table 5: Global stiffness parameter after environmental conditioning, reporting mean value, standard deviation and percentage variation relative to the 23°C reference condition.
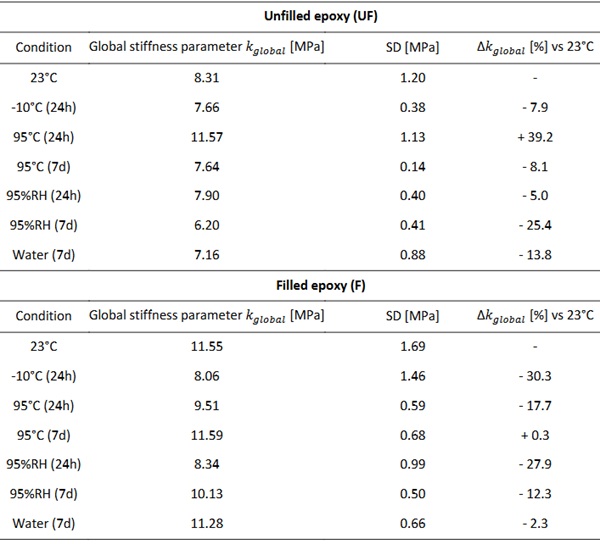
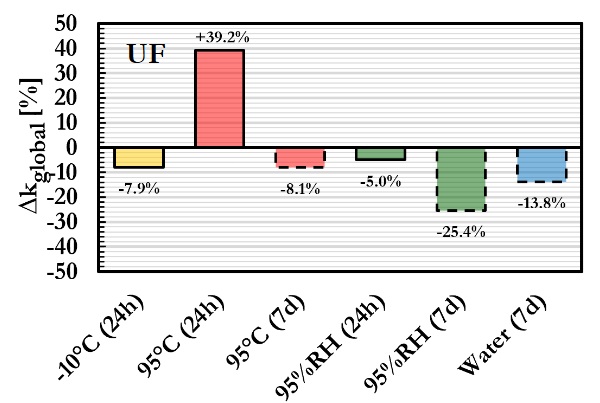
For the unfilled configuration, the global stiffness parameter at 23°C was 8.31 MPa. Conditioning at -10°C for 24 h resulted in a value of 7.66 MPa, corresponding to a -7.9 % variation relative to the reference condition. After exposure to 95°C for 24 h, the global stiffness parameter increased to 11.57 MPa (+39.2 %), representing the highest measured value for this configuration within the investigated regimes. Following prolonged exposure at 95°C for 7 d, the value decreased to 7.64 MPa (-8.1 %), returning to a level comparable to the reference condition. Conditioning at 95% RH resulted in a value of 7.90 MPa (-5.0 %) after 24 h and 6.20 MPa (-25.4 %) after 7 d. The reduction observed after 7 d at high relative humidity corresponds to the lowest global stiffness parameter measured for the unfilled configuration. Water immersion for 7 d yielded 7.16 MPa (-13.8 %). Overall, the unfilled configuration exhibited variations ranging from -25.4 % to +39.2 % relative to the 23°C reference.
For the filled configuration, the global stiffness parameter at 23°C was 11.55 MPa. Conditioning at -10°C for 24 h resulted in 8.06 MPa (-30.3 %). Exposure to 95°C for 24 h produced 9.51 MPa (-17.7 %). In contrast, 7 d at 95°C resulted in 11.59 MPa (+0.3 %), which is effectively equal to the reference value and represents the highest value measured for this configuration after conditioning. Exposure to 95% RH resulted in 8.34 MPa (-27.9 %) after 24 h and 10.13 MPa (-12.3 %) after 7 d. Water immersion for 7 d yielded 11.28 MPa (-2.3 %), corresponding to a value close to the reference condition. For the filled configuration, both reductions and near-reference values were observed depending on conditioning regime and exposure duration, with relative variations ranging from -30.3 % to +0.3 %.
4.6. Strain energy density
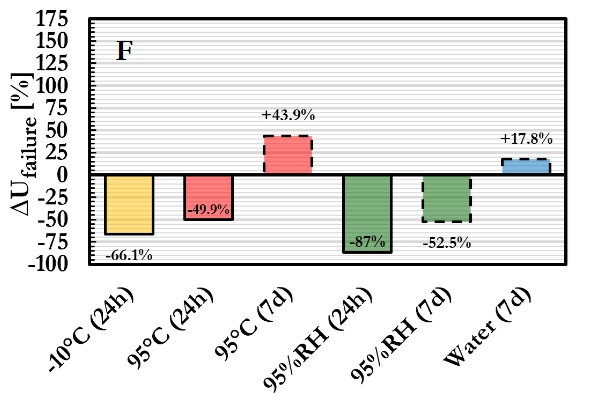
The strain energy density up to failure load for both bonded configurations after environmental conditioning are summarised in Table 6. The relative variation with respect to the 23°C reference condition is shown in Figures 15 and 16.
Table 6: Strain energy density after environmental conditioning, reporting mean value, standard deviation and percentage variation relative to the 23°C reference condition.
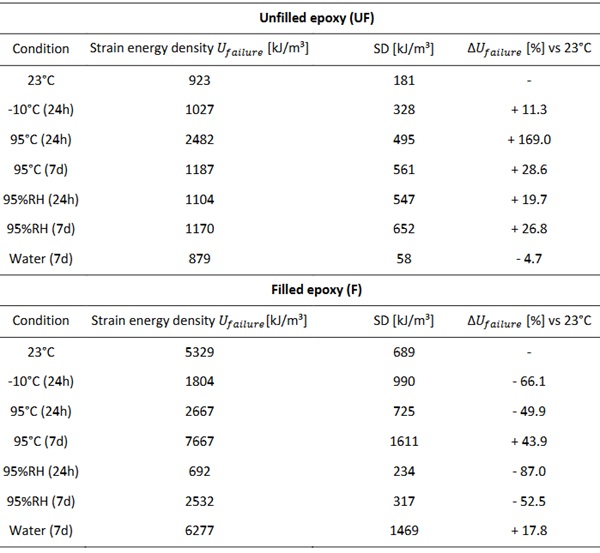
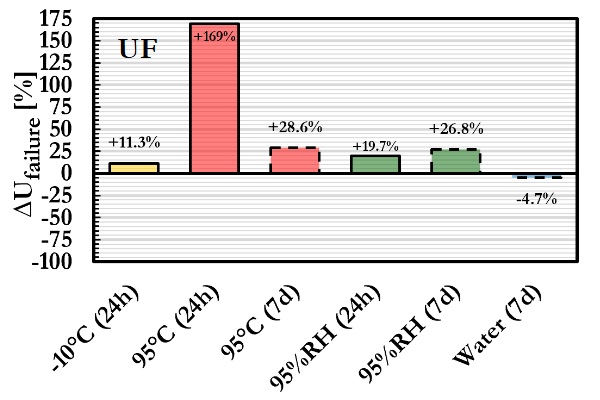
For the unfilled configuration, the strain energy density to failure load at 23°C was 923 kJ/m³. Conditioning at -10°C for 24 h resulted in 1027 kJ/m³, corresponding to an increase of 11.3 % relative to the reference condition. After exposure to 95°C for 24 h and 7 d, values of 2482 kJ/m³ (+169.0 %) and 1187 kJ/m³ (+28.6 %) were obtained, respectively. The highest measured value for this configuration was observed after 24 h at 95°C. Conditioning at 95% RH led to 1104 kJ/m³ after 24 h (+19.7 %), while 7 d at 95% RH yielded 1170 kJ/m³ (+26.8 %). Water immersion for 7 d resulted in 879 kJ/m³, corresponding to -4.7 % relative to the reference. Overall, the unfilled configuration exhibited variations ranging from -4.7 % to +169.0 %, with all regimes except water immersion resulting in increased strain energy density compared to 23°C.
For the filled configuration, the strain energy density to failure load at 23°C was 5329 kJ/m³, substantially higher than that of the unfilled configuration. Conditioning at -10°C for 24 h reduced the value to 1804 kJ/m³ (-66.1 %), while exposure to 95% RH for 24 h resulted in 692 kJ/m³ (-87.0 %), representing the lowest measured value. After 7 d at 95% RH, the strain energy density increased to 2532 kJ/m³ (-52.5 %). Conditioning at 95°C yielded 2667 kJ/m³ after 24 h (-49.9 %) and 7667 kJ/m³ after 7 d (+43.9 %), the latter representing the maximum value for this configuration. Water immersion for 7 d resulted in 6277 kJ/m³ (+17.8 %). In contrast to the unfilled configuration, the filled configuration exhibited both pronounced reductions and marked increases relative to the reference condition, depending on the conditioning regime and exposure duration.
4.7. Failure modes
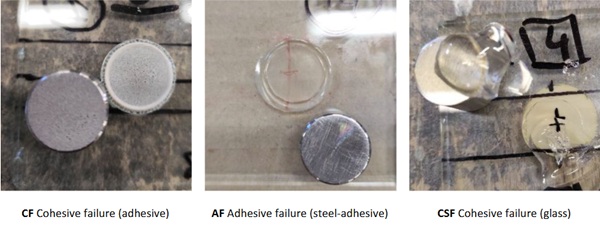
The fracture surfaces of the pull-off specimens were visually inspected after testing. Three main failure modes were identified: cohesive failure within the adhesive layer (CF), adhesive failure at the steel-adhesive interface (AF) and cohesive failure in the glass substrate (CSF). Representative images are presented in Fig. 17.
Cohesive failure within the adhesive layer (CF) was observed in approximately 90 % of all specimens and is considered the reference failure mode. No clearly distinct failure mode was associated with any specific conditioning. Non-CF failures occurred slightly more frequently in the specimens with unfilled epoxy (UF) than in the specimens with filled epoxy (F).
5. Discussion
5.1. General response to environmental conditioning
The environmental conditioning regimes produced systematic changes in the ultimate stress, strain at failure, global stiffness and strain energy density of the bonded glass-steel specimens. Although both epoxy systems share the same base chemistry, the unfilled (UF) and filled (F) configurations exhibited clearly different sensitivities to environmental exposure, indicating that formulation parameters strongly influence the environmentally induced mechanical response. The predominantly cohesive failure observed across all conditioning regimes indicates that the variations in global mechanical behaviour primarily originated from changes within the bulk polymer network rather than from degradation at the glass or steel interfaces. This observation is consistent with findings reported for bonded glass-metal façade applications, where cohesive failure remained dominant under hygrothermal exposure (Silvestru et al. 2019; Van Lancker et al. 2016).
5.2. Elevated temperature
Exposure to 95°C produced the most pronounced effects, but in an adhesive-specific manner. For the unfilled configuration (UF), short-term exposure (24 h) resulted in a clear increase in the global stiffness, ultimate stress and strain energy density to failure load. This behaviour is consistent with thermally induced post-curing mechanisms, where additional crosslinking increases the effective network density. After 7 days at 95°C, the global stiffness parameter returned towards its reference value, while the strain at failure and strain energy density remained above the 23°C level. This suggests that initial post-curing effects may be followed by structural relaxation or saturation phenomena within the polymer network (Firmo et al. 2019; Zhou & Lucas 1999).
The filled configuration (F) exhibited the opposite short-term response: a pronounced reduction in global stiffness, ultimate stress, and strain energy density after 24 h at 95°C, followed by partial recovery after 7 days. This time-dependent behaviour is consistent with filled epoxy systems in which thermal expansion mismatch between filler and matrix, as well as interfacial stress concentrations, influence local stress states and curing kinetics. Prolonged exposure may reduce residual stresses and allow structural reorganisation within the matrix-filler system, thereby partially restoring the apparent mechanical response (Gonçalves et al. 2022).
These findings underline that short-term thermal conditioning cannot be used to infer long-term stabilised behaviour. This observation aligns with adhesive selection studies for steel-glass applications, where temperature-dependent effects and time-dependent stabilisation have been demonstrated to significantly influence mechanical performance (Overend et al. 2011).
5.3. Humidity and water exposure
At 95% RH, the unfilled configuration (UF) exhibited a reduction in the global stiffness, while the ultimate stress remained relatively stable and the strain energy density increased noticeably for both exposure durations. This response is characteristic of moisture-induced plasticisation, in which absorbed water increases chain mobility and deformation capacity before significant strength degradation occurs (Zhou & Lucas 1999; Silva et al. 2016). The strong increase in strain energy density suggests that enhanced deformability prior to failure load dominates the global mechanical response under short-term high-humidity exposure.
For the filled configuration (F), the short-term influence of high humidity was considerably more pronounced. After 24 h at 95% RH, pronounced reductions were observed in ultimate stress, strain at failure and strain energy density. Such behaviour has been associated with moisture accumulation at filler-matrix interfaces, potentially inducing local debonding and stress concentrations that reduce the effective load-bearing capacity of the composite system. After 7 days, a substantial increase in strain energy density was observed, indicating partial recovery and suggesting time-dependent redistribution of moisture and internal stresses within the matrix-filler network (Gonçalves et al. 2022).
Interestingly, full water immersion for 7 days resulted in less detrimental effects than exposure to 95% RH for both configurations. For the filled configuration (F), the strain energy even exceeded the reference value under immersion. This may be attributed to more homogeneous moisture uptake and uniform plasticisation of the matrix, which reduces local stress concentrations and promotes higher deformation prior to failure load (Ascione et al. 2021).
These observations are consistent with façade durability studies reporting early reductions in stiffness under moisture exposure and adhesive-specific hygrothermal sensitivity in bonded glass-metal systems (Van Lancker et al. 2016; Silvestru et al. 2019).
5.4. Low temperature
Conditioning at -10°C had only a limited influence on the unfilled configuration (UF), with minor variations in the global stiffness, ultimate stress and strain energy density relative to the 23°C reference. In contrast, the filled configuration (F) exhibited pronounced reductions in global stiffness, ultimate stress, strain at failure and strain energy density, indicating a more brittle global mechanical response under low-temperature exposure.
From an application perspective, these findings suggest that filled epoxy systems may exhibit disproportionate reductions in deformation capacity and energy absorption under cold climate conditions, which should be considered when assessing durability and service performance.
5.5. Interaction between mechanical parameters
The results confirm that environmental degradation cannot be adequately characterised by ultimate stress alone. Reductions in the global stiffness often occurred earlier and more consistently, particularly under high-humidity exposure, reflecting increased chain mobility associated with moisture-induced plasticisation (Zhou & Lucas 1999).
The strain at failure and the strain energy density to failure load proved especially sensitive to environmental conditioning. These parameters capture variations in deformation capacity and energy absorption prior to failure load that are not necessarily reflected in ultimate stress. In several conditioning regimes, comparable ultimate stress values were accompanied by markedly different strain energy density levels, demonstrating that strength-based assessment alone may mask substantial changes in global mechanical response (Overend et al. 2011; Silvestru et al. 2019).
This observation supports a multi-parameter durability assessment framework based on the global stiffness parameter, ultimate stress, strain at failure and strain energy density to failure load, as similarly advocated in adhesive performance studies addressing bonded steel-glass systems.
5.6. Structural implications and limitations
Overall, the unfilled configuration UF exhibited a more stable global mechanical response across the investigated environmental conditions, whereas the filled configuration F, despite its substantially higher reference state performance, proved more sensitive to high humidity and low temperature exposure. These findings indicate that the anticipated environmental exposure profile, including temperature variation, humidity levels and potential water ingress, may be more decisive for adhesive selection than performance measured under ambient laboratory conditions alone.
The mechanical quantities reported in this study are global response parameters derived from crosshead displacement measurements. They characterise the behaviour of the tested bonded glass steel configuration and do not represent intrinsic material properties of the epoxy systems or isolated properties of the adhesive layer. The results should therefore be interpreted as comparative performance trends between conditioning regimes rather than as definitive material parameters. A further limitation is the reliance on only three specimens per conditioning regime. This restricts statistical confidence and limits the ability to rigorously distinguish intrinsic trends from specimen-to-specimen variability. An increased number of test specimens would be required to confirm the observed tendencies and reduce uncertainty in the derived response parameters.
In addition, the environmental conditioning was limited to relatively short exposure durations and the mechanical characterisation was restricted to monotonic pull-off loading. Literature indicates that the glass transition temperature (Tg) and the global mechanical response of epoxy systems continue to evolve under prolonged hygrothermal exposure, driven by controlled sorption processes and potentially irreversible modifications of the polymer network (Zhou & Lucas 1999; Firmo et al. 2019; Siedlaczek 2022; Siedlaczek 2023).
Future research should focus on isolating and quantifying the local behaviour of the adhesive layer and bond interface under environmental exposure. Experimental techniques such as digital image correlation could enable direct measurement of strain fields within the adhesive layer, allowing separation of adhesive deformation from the global configuration response. Combined with long-term diffusion studies, Tg evolution monitoring and microstructural characterisation, such approaches would provide a more fundamental understanding of durability mechanisms in bonded glass-steel assemblies under realistic service conditions.
6. Conclusions
This study evaluated the short-term environmental durability of two bonded glass-steel configurations incorporating an unfilled epoxy formulation (UF) and a filled epoxy formulation (F), subjected to pull-off loading under seven conditioning regimes. The reported quantities represent global response parameters derived from crosshead displacement measurements and therefore describe comparative configuration behaviour rather than intrinsic adhesive material properties.
The main findings are:
- The unfilled configuration (UF) demonstrated the most stable performance across environmental exposures, with relatively limited sensitivity to humidity, low-temperature conditioning and water immersion, with variations in ultimate stress remaining within approximately ±10% of the reference condition;
- The filled configuration (F) displayed substantially higher strength and deformability under reference conditions (10.49 MPa vs 3.66 MPa for UF at 23°C) but was markedly more sensitive to high humidity and low-temperature exposure, with strength reductions of up to 69% under 95% RH and 53% at -10°C;
- Elevated-temperature conditioning influenced both configurations differently: the unfilled epoxy strengthened after short exposure (up to +98% after 24 h at 95°C) while the filled epoxy weakened initially (-34% after 24 h at 95°C) and only partially recovered after prolonged exposure.
- Moisture primarily reduced stiffness in both systems, with reductions in global stiffness of up to 25% (UF) and 30% (F), but its impact on strength and energy absorption differed strongly: the unfilled epoxy remained relatively stable, whereas the filled epoxy showed pronounced strength loss under high humidity.
- Failure remained predominantly cohesive in the adhesive layer, indicating that environmental degradation mainly influenced the bulk polymer rather than the interfaces.
Key limitations of this study include the limited number of specimens per conditioning regime and the restriction to relatively short-term exposures under monotonic pull-off loading. The results should therefore be interpreted as comparative trends within the investigated timeframe.
The results demonstrate substantial differences in stiffness, strength and sensitivity to environmental conditions between the tested configurations. These findings highlight the influence of humidity, temperature and load history on the overall behaviour of bonded glass-steel assemblies and may inform further studies or design considerations for such components.
Future research should expand the statistical basis through larger sample sets and incorporate long-term hygrothermal ageing, monitoring of glass transition temperature (Tg) evolution, coupled mechanical-environmental loading and microstructural characterisation. In addition, experimental techniques capable of resolving local adhesive deformation, such as digital image correlation, are required to isolate adhesive layer behaviour and enable the derivation of intrinsic material parameters under environmental exposure.
Acknowledgements
The authors would like to acknowledge the support of fischerwerke GmbH & Co. KG and vitroplena bv during the G2C (glass-to-concrete) research project.
References
Ascione, F., Granata, L., Guadagno, L., & Naddeo, C. (2021). Hygrothermal durability of epoxy adhesives used in civil structural applications. Composite Structures, 265, 113591. https://doi.org/10.1016/j.compstruct.2021.113591
Belis, J., Callewaert, D., & Hulle, A. V. (2011). Bouwen met glas en adhesieven. (in Dutch)
Bower, A. F. (2010). Applied mechanics of solids. CRC Press.
Bureau voor Normalisatie (NBN). (2003). NBN EN ISO 9142: Lijmen – Richtlijn voor de selectie van standaard verouderingscondities voor het testen van lijmverbindingen. NBN.
Bureau voor Normalisatie (NBN). (2004). NBN EN 14258: Structurele lijmen – Bepaling van de tijd tot breuk bij statische belasting. NBN.
European Organisation for Technical Assessment (EOTA). (2012). ETAG 002: Guideline for European Technical Approval of Structural Sealant Glazing Systems (Parts 1–3). EOTA.
European Organisation for Technical Assessment (EOTA). (2023). EAD 090010-00-0404: Structural Sealant Glazing Systems. EOTA. https://www.eota.eu/eads
Firmo, J. P., Roquette, M. G., Correia, J. R., & Azevedo, A. S. (2019). Influence of elevated temperatures on epoxy adhesive used in CFRP strengthening systems for civil engineering applications. International Journal of Adhesion and Adhesives, 93, 102333. https://doi.org/10.1016/j.ijadhadh.2019.01.027
Gonçalves, F. A. M. M., Santos, M., Cernadas, T., Alves, P., & Ferreira, P. (2022). Influence of fillers on epoxy resins properties: A review. Journal of Materials Science, 57(32), 15183–15212. https://doi.org/10.1007/s10853-022-07573-2
Moller, J. C., Berry, R. J., & Foster, H. A. (2020). On the Nature of Epoxy Resin Post-Curing. Polymers, 12(2), 466. https://doi.org/10.3390/polym12020466
Overend, M., Jin, Q., & Watson, J. (2011). The selection and performance of adhesives for a steel–glass connection. International Journal of Adhesion and Adhesives, 31(7), 587–597. https://doi.org/10.1016/j.ijadhadh.2011.06.001
Siedlaczek, P., Sinn, G., Peter, P., Wan-Wendner, R., & Lichtenegger, H. C. (2022). Characterization of moisture uptake and diffusion mechanisms in particle-filled composites. Polymer, 249, 124799. https://doi.org/10.1016/j.polymer.2022.124799
Siedlaczek, P., Sinn, G., Peter, P., Jandl, J., Hantal, G., Wriessnig, K., Wan-Wendner, R., & Lichtenegger, H. C. (2023). Hygrothermal aging of particle-filled epoxy-based composites. Polymer Degradation and Stability, 208, 110248.
https://doi.org/10.1016/j.polymdegradstab.2022.110248
Silva, P., Fernandes, P., Sena-Cruz, J., Xavier, J., Castro, F., Soares, D., & Carneiro, V. (2016). Effects of different environmental conditions on the mechanical characteristics of a structural epoxy. Composites Part B: Engineering, 88, 55–63. https://doi.org/10.1016/j.compositesb.2015.10.036
Silvestru, V. A., Kolany, G., Freytag, B., Schneider, J., & Englhardt, O. (2019). Adhesively bonded glass-metal façade elements with composite structural behaviour under in-plane and out-of-plane loading. Engineering Structures, 200, 109692. https://doi.org/10.1016/j.engstruct.2019.109692
Van Lancker, B., Dispersyn, J., De Corte, W., & Belis, J. (2016). Durability of adhesive glass-metal connections for structural applications. Engineering Structures, 126, 237–251. https://doi.org/10.1016/j.engstruct.2016.07.024
Wei, Y., Jin, X., Luo, Q., Li, Q., & Sun, G. (2024). Adhesively bonded joints – A review on design, manufacturing, experiments, modeling and challenges. Composites Part B: Engineering, 276, 111225. https://doi.org/10.1016/j.compositesb.2024.111225
Zhou, J., & Lucas, J. P. (1999). Hygrothermal effects of epoxy resin. Part II: Variations of glass transition temperature. Polymer, 40(20), 5513–5522. https://doi.org/10.1016/S0032-3861(98)00791-5