Article Information
- Digital Object Identifier (DOI): 10.47982/cgc.10.679
- Published by Challenging Glass, on behalf of the author(s), at Stichting OpenAccess.
- Published as part of the peer-reviewed Challenging Glass Conference Proceedings, Volume 10, June 2026, 10.47982/cgc.10
- Editors: Christian Louter, Freek Bos & Jan Belis
- This work is licensed under a Creative Commons Attribution 4.0 International (CC BY 4.0) license.
- Copyright © 2026 with the author(s)
Authors:
Daniel Massimino a, Thomas Bigler a, Swornava Guha b, Cat Arase a, Telesilla Bristogianni b, Faidra Oikonomopoulou b, Kaitlyn Becker a
a Massachusetts Institute of Technology, USA
b Delft University of Technology, The Netherlands

Abstract
Additive manufacturing and casting enable the fabrication of freeform, three-dimensional glass elements. Yet inherent process constraints typically limit component size to that of a masonry brick. Such glass masonry systems, in turn, require an interlayer material to avoid glass-to-glass contact and reduce stress concentrations. Towards reversible structures, dry-assembled cast silicones, composite materials, and other alternatives have been investigated as replacements for currently used adhesives. This paper investigates metal, tension-activated kirigami as an alternative to dry interlayer systems. It assesses the flexibility, mass, and embodied carbon of kirigami for feasibility in a higher-performance masonry system. This paper uses empirical probabilistic methods to estimate the stiffness and strength of activated kirigami made from paper and steel. Experimental results show that steel kirigami patterns can be designed for applied stresses of 2-20 MPa and stiffness of 9-183 MPa. Empirical models are used to study compatibility with glass masonry in compressive testing of metal kirigami and glass interfaces. Results show that metal kirigami can be tuned to buckle before damaging glass and have 50-73% lower mass and 8-26% lower embodied carbon than adhesives and previously proposed dry interlayers.
1. Introduction
Additive manufacturing (AM) and casting both enable the creation of freeform, three-dimensional glass structures that effectively utilize glass’s compressive strength. However, inherent fabrication constraints, namely the prolonged annealing times required for large monolithic cast glass components (Oikonomopoulou et al. 2018b) and the build volume of AM equipment (Massimino et al. 2024), restrict component size to that of a large masonry unit. Consequently, architectural-scale applications rely on glass masonry structures. Several cast glass masonry structures, from self-supporting facades to fully compressive vaults, have already been realized (Oikonomopoulou and Bristogianni 2022), while additively manufactured glass blocks are still being investigated for their application in building systems (Massimino et al. 2024; Oikonomopoulou et al. 2025). Although capable of withstanding higher stresses, conventional glass masonry in realized built applications is typically subjected to compressive stresses below 1 MPa (Oikonomopoulou et al. 2022).
In glass masonry building systems, an interlayer material is required to absorb dimensional deviations in construction and prevent stress concentrations and premature fracture or failure from glass-to-glass contact (Oikonomopoulou et al. 2018). Permanent adhesives have been primarily implemented as an interlayer, with several built structures utilizing options with different visual performance, structural performance, constructability, and cost (Oikonomopoulou et al. 2022, 2015; Oikonomopoulou and Bristogianni 2022). Despite offering durable, transparent, uniform, and creep-resistant load transfer, adhesive-based glass masonry assemblies require environmentally controlled cure conditions, demand tight tolerances (Oikonomopoulou et al. 2025), complicate maintenance, increase construction complexity, and result in non-reversible contaminated structures. (Oikonomopoulou and Bristogianni 2022).
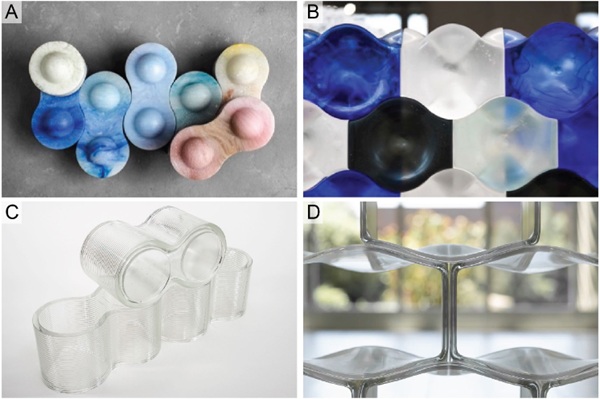
Interlocking glass brick geometries (Figure 1) combined with dry, demountable interlayers (Figure 2B), made from materials such as polyurethane (Figure 2C), epoxies, and aluminum sandwich panels, have been proposed as an alternative to adhesive bonding (Figure 2A), allowing for deconstructible, circular glass masonry systems and facades (Aurik et al. 2018; Dimas et al. 2022; Oikonomopoulou et al. 2018; Oikonomopoulou et al. 2025) while counteracting some of the aforementioned limitations. They can be fabricated off-site, eliminating the cure time and environmental requirements of adhesive solutions, and can accommodate larger dimensional tolerances. A common problem in most proposed dry interlayer materials is their low creep resistance. Some are also non-recyclable or degrade over time from environmental exposure. The combination of interlocking glass masonry with demountable components serves as a framework for further investigation into alternative material and product designs with higher creep resistance while retaining existing advantages.
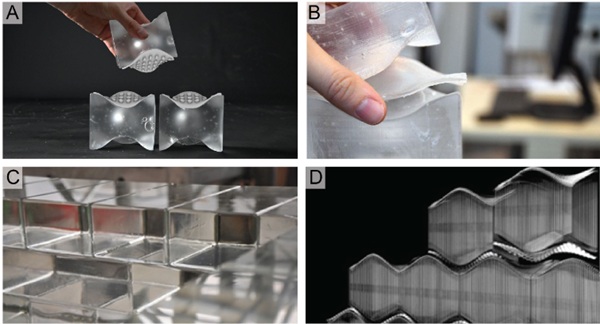
Accordingly, this paper investigates the potential of metal, tension-activated kirigami (TAK) as a lightweight, stiff, creep-resistant, and adaptable interlayer for glass masonry (Figure 2D). Kirigami is a traditional Japanese technique that combines folding and cutting patterns to transform patterned flat sheets into complex geometric shapes (Callens and Zadpoor 2018). TAK differs from other kirigami varieties in its simple activation: a tensile force causes out-of-plane deformation, resulting in a structure with high specific strength, specific stiffness, and energy dissipation properties orthogonal to the direction of activating tensile forces. Tension-activated kirigami is currently being investigated for a variety of applications, such as a paper packaging material with high specific strength and stiffness qualities (Corrigan et al. 2025, 2023a, 2023b). Corrigan et al. have investigated the relative advantages and disadvantages of multiple kirigami patterns (2025, 2023a) and how different cut pattern parameters affect key performance metrics such as specific strength and stiffness (2023b). These studies, however, did not resolve discrepancies between experimental testing and finite element analysis (FEA). For example, in one instance the experimental strength (6.4 kPa) and stiffness (52 kPa) did not agree with simulation results (21 kPa and 2901 kPa respectively) (Corrigan et al. 2023b). Instead of using simulation tools, experimentally validated parametric modeling can be used to more accurately predict mechanical properties.
This work examines the influence of cut-pattern geometry and sheet thickness on the stiffness, strength, mass and associated carbon footprint of metal TAK interlayers for glass masonry applications. The effect of cut pattern variables on the stiffness and strength of the activated pattern is first explored with additional fabrication, mechanical testing (activation and compression), and statistical analysis using paper TAK. Unexplored in previous studies, thickness, as it relates to these design parameters and performance, is incorporated as an additional parameter for paper TAK. An analogous methodology is then applied to strips of metal TAK made from 316L stainless steel. A design study for metal kirigami is unexplored in existing literature, and the effect of thickness on performance is investigated in this work. These analyses were used to develop empirical parametric models relating pattern dimensions and thickness to mechanical performance in paper and steel kirigami. Based on these results, metal TAK sheets were designed to exceed the strength of expected masonry stress (1-5 MPa), have similar stiffness to existing adhesives (10-100 MPa), and limit fabrication time where possible. These sheets were fabricated and tested in compression between two float glass panels to assess their mechanical response and interaction with glass. Finally, the performance of metal TAK interlayers is compared to existing dry interlayer alternatives from a mass and embodied carbon standpoint.
2. Methods
This study extends prior work by performing additional experiments and developing new empirical models for paper TAK. It also investigates the effect of thickness on the stiffness and strength of metal TAK, integrates the system with glass, and assesses its sustainability potential.
2.1. Paper TAK fabrication and testing
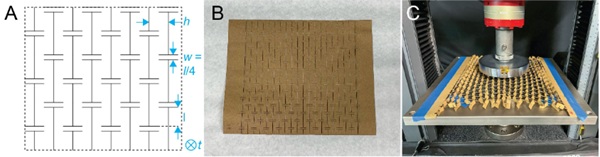
In previously published literature, Corrigan et al. reported compressive test results for paper TAK specimens with systematically varied cut dimensions l and h (Figure 3A) using a two-factor, three-level, five-replicate, full factorial experimental design to investigate resulting stiffness and strength (Corrigan et al. 2023b). All tests in Corrigan et al. were conducted using 18.1 kg (40lb) basis-weight kraft paper. The published sample means and standard deviations from Corrigan et al. (2023a) are utilized in a linear regression to develop this work’s parametric, empirical model.
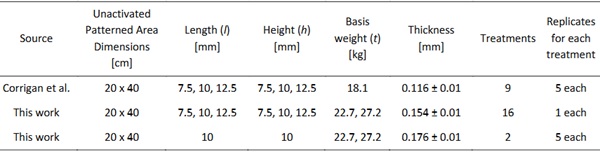
To incorporate material thickness as an additional factor, the existing dataset was supplemented with experiments at two additional thickness levels, 22.7 kg (50 lb) basis-weight and 27.2 kg (60 lb) basis-weight according to Table 1. These additional 42 experiments were consistent with Corrigan et al.’s process (2023b). Paper samples were fabricated on a laser cutter to create the pattern (Figure 3B), mechanically activated by taping each side on either end of a platen (Figure 3C), and then compressed with a 15 cm diameter platen centered on a 20 x 40 cm activated sheet. The lower platen was covered with 120-grit sandpaper to simulate a fixed boundary condition (Figure 3C).
Table 1: Experimental design matrix for paper TAK testing. Thickness is the measured thickness (mm) and standard
deviation for five measurements. Row one contains the existing data from Corrigan et al. (2023b). Rows two and three are
experimental designs performed in this work. Row two has one replicate each. Row three has five replicates at the center
points only, where l = 10 and h = 10, and the thickness is varied for each.
Compression testing was performed on an Instron 5969 universal testing machine (UTM) and 2580-50 kN load cell. Stiffness and the applied stress prior to buckling, hereafter described as the “strength”, was calculated in MATLAB using the same definition as Corrigan et al. (2023a).
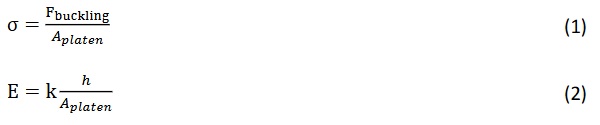
Where,
𝜎 = strength (Pa),
Fbuckling = the peak force before a dramatic drop (N),
A platen = the area of the upper compression platen (m²),
E = stiffness of the metamaterial (Pa),
k = calculated slope of the force-displacement graph before buckling (N/m), and
h = the height of the kirigami sample (Figure 3A) (m).
MATLAB was used for statistical analyses MATLAB(Conover 1980; Lilliefors 1969, 1967). Factors were normalized to range of -1 to 1 for analysis and terms with p-values greater than 0.05 were removed.
2.2. Steel TAK fabrication and testing
Kirigami specimens were fabricated from 316L stainless steel to extend the analysis to metal materials. Rectangular strips measuring 2.54 cm x 12.7 cm were laser cut on a Fablight FL4500 CNC fiber laser cutter at four thickness levels in a single-factor, four-level experimental design (Table 2). Samples were activated at a rate of 0.5 mm/s to a displacement of 7 cm. Activated samples were compressed at a rate of 0.35 mm/s with 15 cm diameter upper platens. Galvanized steel sheets were placed between the platens and specimens to prevent platen damage. Statistical analyses analogous to those used for the paper kirigami samples were applied to the metal dataset. A Levene’s test showed unequal variances between thickness levels and a weighted linear regression was employed. Using the results from the regression models from the paper and metal testing to maximize strength and stiffness while minimizing fabrication time, a 200 x 400 mm kirigami sheet was fabricated with dimensions l = 12.5, h = 7.5, and w = 3.125 mm (Table 2) based on paper TAK and metal TAK strip results. Two sheets each were cut from 0.254 and 0.381 mm thick 316L steel on an xTool MetalFab 1200 W system. Samples were activated on the same UTM as above at a rate of 0.5 mm/s to a displacement of 200 mm. To also evaluate performance when interfacing with glass, metal TAK sheets were sandwiched between two panes of glass and tested in compression. 10 mm thick Pilkington float glass was cut on a Sanken CNC 5-axis (60°) water jet into 10 x 10 cm squares for testing. Each metal TAK sheet was divided into four sections to match the size of glass squares. Sandwich specimens were compressed on a MATEST E161 compression testing machine at a rate of 0.03 mm/sec.
2.3. Environmental impact analysis
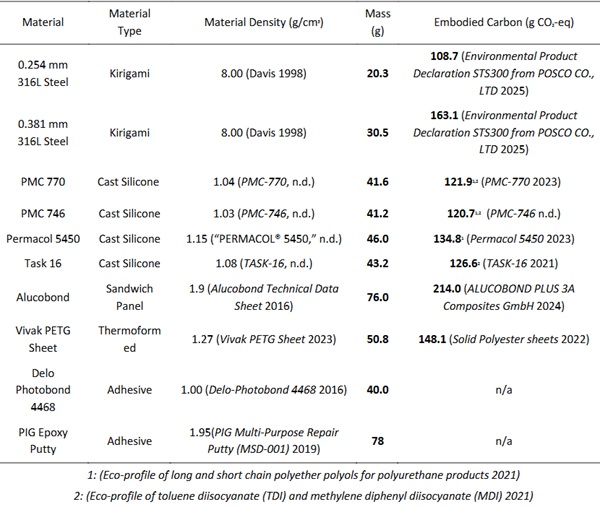
To determine the relative environmental impact of using metal TAK interlayers versus alternative adhesives and dry interlayers the mass of each system and, when available, the embodied carbon of these units was compared. The mass of the 316L steel kirigami was determined by using the density of the material (8 g/cm³) multiplied by the volume of a 10 cm x 10 cm sheet of specified thickness (0.254 or 0.381 mm). For other materials, density was multiplied by a volume equivalent to a 10 cm x 10 cm x 0.4 cm box, as 0.4 cm is reported by Oikonomopoulou et al. (2019) as the typical thickness for adhesives and cast interlayers.
To find the embodied carbon for these products, environmental product disclosures (EPDs) for each material, when available, were used to calculate the per-unit mass embodied carbon, which was then multiplied by the unit mass. For materials where a product-specific EPD was unavailable, a safety data sheet (SDS) was used to determine the material composition, and the EPDs for those constituent materials were used to calculate embodied carbon. In cases where the full composition was not disclosed in the SDS, the reported values were assumed to contribute to 100% of the composition. Results note which products’ EPD were not publicly available.
3. Results
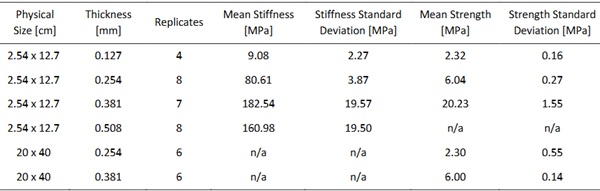
Results demonstrated that metal TAK interlayer sandwiches can be designed to buckle prior to glass fracture using empirical models for predicting metamaterial mechanical properties. These designs are capable of matching adhesive stiffnesses (10-100 MPa) and exceeding the strength of masonry system stresses (1-5 MPa). Parametric models were used to design metal TAK for desired structural properties. Results for all mechanical testing are displayed in Table 2.
Table 2: Results from the metal TAK strip testing. Physical size is the size of the unactivated kirigami pattern, while material thickness refers to the thickness of the stock material prior to activation. Stiffness values were not calculated for the larger sheet compression tests. Strength was not calculated for the thickest metal TAK strip sample (0.508 mm thick). Length (l) = 3.85 mm and height (h) 10 mm for strip samples. Length (l) = 12 mm and height (h) 7.5 mm for sheet samples.
3.1. Paper TAK results
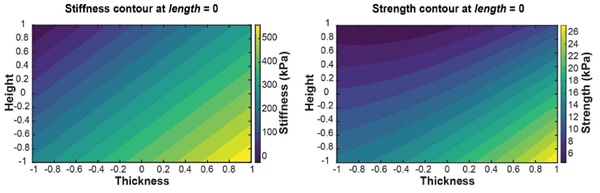
Paper TAK experiments demonstrated that length (l), height (h), and thickness (t) influence the strength of the metamaterial, while only thickness (t) and height (h) affect stiffness. A Bartlett’s test on center points of the strength data reported a significantly different variance (p = .002) for stiffness. Final linear regression models exhibited a favorable fit (adjusted R² = 0.92 for stiffness and strength) and significance, with p << 0.05 for stiffness and strength resulting in Equations 3 and 4. Their contour plots are shown in Figure 4. Input factors are normalized from -1 to 1 for each factor.

Where,
k = stiffness (MPa)
𝜎 = peak strength (MPa)
t = thickness (a range of basis-weight from 18.1 to 27.1 kg normalized from -1 to 1)
h = height (a range of 7.5 to 12 mm normalized to -1 to 1)
l = length (a range of 7.5 to 12 mm normalized to -1 to 1)
3.2. Steel TAK results
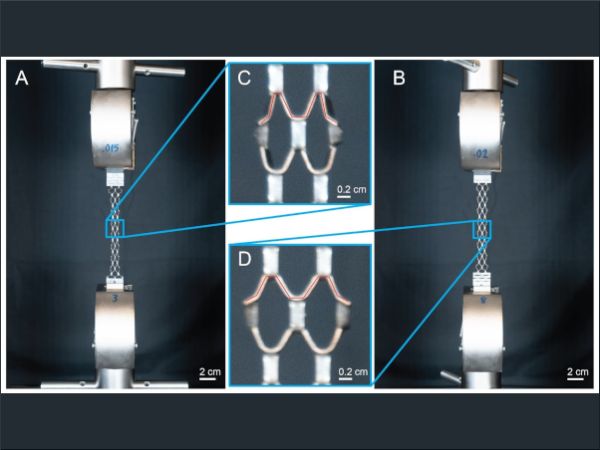
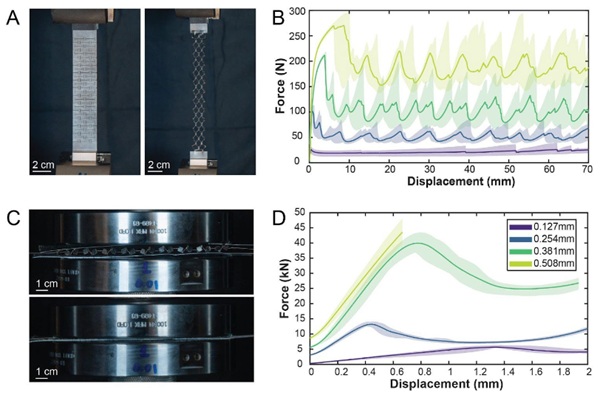
Metal TAK strips were activated and tested as shown in Figure 5. Activation testing exhibited sinusoidal-like force-displacement curves during activation as rows activated one by one (Figure 5B). Strength results only yielded a three-level experimental design because the buckling force for 0.508 mm thick samples exceeded the load cell’s 50 kN threshold (Figure 5D).
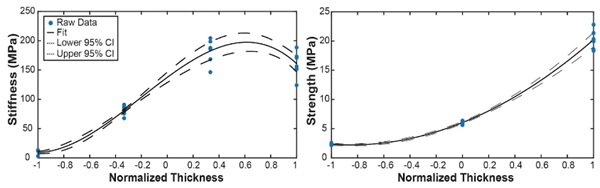
For the metal TAK strip specimens, a Lilliefors normality test indicated the thinnest (0.127 mm) thickness group deviated from normality (p = 0.02). The small sample size and limited deviation from the 0.05 significance threshold justified continued use of this dataset. Levene’s test for unequal variance indicated statistically significant differences in variance between the sample sets’ strengths (p = 0.015) and stiffnesses (p = 0.023), so a weighted linear regression was used. Fit was favorable with the adjusted R2 = 0.989 for both stiffness and strength, and results were statistically significant. Final equations are below and are shown in Figure 6.

Where,
k = stiffness (MPa),
𝜎 = peak strength (MPa),
tk = thickness (a range of 0.127 to 0.508 mm normalized from -1 to 1), and
tσ = thickness (a range of 0.127 to 0.381 mm normalized from -1 to 1).
From these data, the adjusted metal TAK sheets were tested (Figure 7A, B). One sheet was only partially activated, and only the activated portion was used for compression testing. This is shown in displacement values ending at 60 mm instead of 180 mm. Another sample was partially activated during fixture attachment, leading to a lower initial activation load (Figure 7B). The behavior of activation in metal TAK sheets did not match the metal TAK strip’s (Figure 5B) sinusoidal activation force-displacement graph and instead had an initial peak and then near constant force during activation. In all metal TAK sheet compression testing (Figure 7C-E), the kirigami buckled before the glass fractured. While performing preliminary tests, loading beyond the buckling point resulted in one glass sample fracturing from a surface defect. Edge chipping occurred in most samples where metal kirigami contacted the waterjet edge of the glass, and small surface scratches were also visible in some samples (Figure 8). Compared to the preliminary metal TAK strip testing, metal TAK sheets buckled at lower strengths than the linear regression model or empirical data predicted (Figures 7,9).
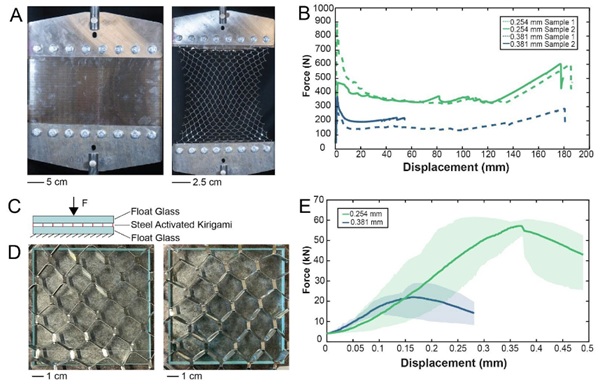
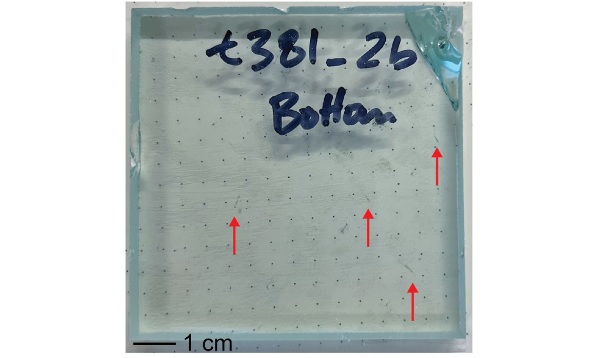
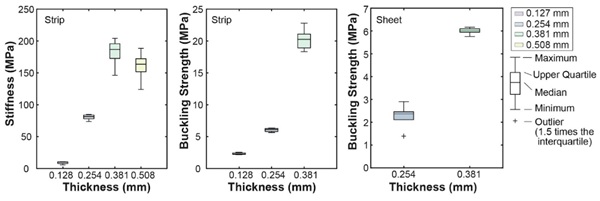
Table 3: Mass and embodied carbon results for testing kirigami, other dry interlayers, and adhesive alternatives as reported. Citations for material density and composition are noted in parenthetical citations next to the value that used these data sources. For cast silicones, citations for relating chemical composition to embodied carbon are noted in superscripts and below the table.
3.3. Environmental impact results
Mass property results demonstrate that the t = 0.254 and 0.381 mm thick stainless-steel kirigami is lighter than both dry interlayer alternatives and adhesives per unit volume (Table 3). Embodied carbon analysis also showed lower values per unit for t = 0.254 mm, but higher than most alternatives for t = 0.381 mm.
4. Discussion
The combination of testing, statistical analysis, and environmental analysis demonstrates that metal kirigami is a desirable alternative for demountable glass masonry interlayer materials. Statistical methods can be used to predict metamaterial properties with narrow confidence bands, but activation and compressive behavior changed when the stock material changed from paper to steel. Compared to the metal TAK strips, larger metal TAK sheets of the same material and thickness, but with a different cut pattern, buckled at lower forces, likely from different activated geometry. Glass sandwich testing showed that metal TAK metamaterial properties (stiffness and strength) were tunable, and materials buckled at higher applied stress than those present in typical masonry systems (1-5 MPa) (Heyman 1997). Environmental analysis showed that t = 0.254 mm stainless steel kirigami was lighter and had the potential for lower embodied carbon than existing dry interlayers and adhesives. These insights are further detailed below.
4.1. Empirical results follow analytical model trends
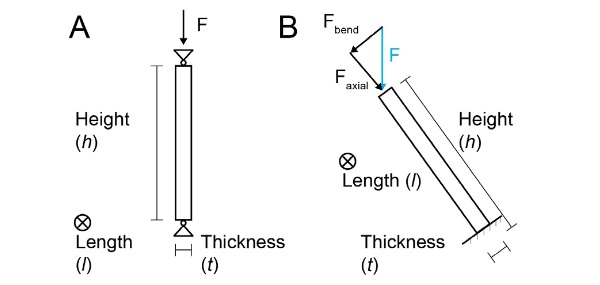
Empirical models from compressive testing in this work mostly follow classical structural mechanics analytical models. The paper kirigami empirical model relates stiffness (k) directly to thickness (t) and height (h). In contrast, buckling strength exhibited a quadratic relationship with thickness (t) and linear dependence on the remaining variables (h, l). These empirical relationships can be compared to Euler’s column buckling formula with pin-pin connections for a conservative approximation of relationships (Young 1989) (Figure 10A). After substitution for the 2 nd moment of area, for a pin-pin column the Euler buckling load is given in Equation 7. To analytically model the stiffness of the kirigami structure, a single out-of-plane plate of the activated kirigami structure can also be idealized as a simplified model of a cantilevered beam experiencing combined bending and axial loading (Figure 10B). Using axial displacement compatibility and Euler-Bernoulli beam theory, the pre-buckling deformation can be modeled as a beam with deformation defined in Equation 8.
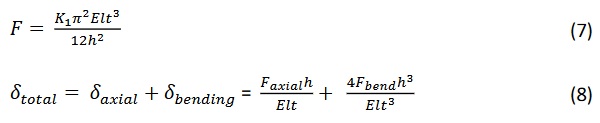
Where,
F = critical buckling force (N),
K1 = 1 for pin-pin boundary conditions,
E = Young’s Modulus of the material (Pa),
l = the length of a column and pattern dimension (Figure 3) (m),
t = thickness of the material (Figure 3) (m), and
h = height of the column and pattern (Figure 3) (m).
This buckling force analytical model predicts higher-order sensitivity of stiffness to the thickness (t) and height (h) of the cut-pattern than to length (l) and is consistent with trends observed in the empirical models (Equations 5 and 6). The cubic dependence on thickness and inverse-square dependence on height align with the dominant term identities in the experimental results.
The empirical stiffness model derived from the paper kirigami experiments follow trends consistent with these analytical expressions, in which thickness (t) and height (h) appear as higher-order terms and therefore exert a stronger influence on stiffness than length (l). These empirical results demonstrate that length (l) has a minimal impact on stiffness and strength. For this reason, the l = 12 mm cut pattern was chosen for the final glass sandwich compression testing to limit cutting time, without significantly affecting performance. h = 7.5 mm was chosen to maximize stiffness and strength, and two thicknesses (t = 0.254 and 0.381 mm) were chosen to match estimated masonry stress levels.
4.2. Deviations from linear regression assumptions and analytical models
Both paper and metal data showed signs of properties which may have skewed linear regression results. Additionally, metal TAK results depart from analytical models in one thickness’s stiffness result. In paper TAK samples, a Bartlett’s test for unequal variance between the centerpoints of the t = 18.1, 22.7, 27.2 kg basis-weight paper found unequal variance in stiffness, which contradicts an assumption for linear regression. The significance of this inequality on stiffness data is still relatively low (p = 0.096) compared to a 95% confidence level, meaning the effect on coefficient term significance was likely small. Paper linear regression results did not result in heteroscedasticity because only means were used as the input parameters. Bartlett’s test found that variance was not significantly different for strength datasets. Because this unequal variance is only found in stiffness results, this discrepancy may have been caused by the large load cell (50 kN) and use of the crosshead for displacement measurement in this study’s new experimental data may have led to less precise force or displacement easurements at lower force values. Raw data from Corrigan et al.’s (2023b) data set, and additional replicates in this work’s work are needed to validate the effect on the model and accommodate for the difference in variance.
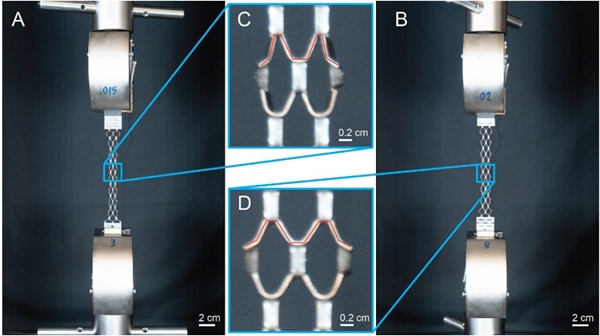
Unlike the paper TAK samples, linear regression results for metal TAK strip specimens exhibited heteroscedasticity, indicating further analysis is needed for more reliable model estimates. Metal sample empirical models also had significant cubic terms, albeit larger sample sizes and full access to raw data allowed for testing of cubic terms. Analytical solutions to the simplified beam model predict an increase in stiffness with increasing thickness for both axial and bending components (Equation 8), but metal TAK strip stiffness results dropped between 0.381 and 0.508 mm thickness levels (Figure 6). Additional mechanisms in the experiment not captured in the simplified analytical model likely contributed to this discrepancy. One possibility was the observed change in the shape in the activated kirigami between the thickness levels (Figure 11). A more accurate analytical shell model or finite element analysis could provide a better understanding of how these subtle geometries change the mechanical properties of the metamaterial.
4.3. Empirical model and activation behavior differs in strip versus sheet metal TAK tests
An additional finding was that metal TAK strip empirical models were not accurate in predicting stiffness and strength in metal TAK sheet samples. Metal TAK strip and sheet testing also exhibited distinct differences in behavior during activation testing. In steel compression testing, metal TAK strips were much stronger than sheets of the same thickness (Figure 5). The different cut pattern dimensions in the metal TAK strips versus the sheets could have led to different strengths, although the magnitude of the difference is not explained by this change. The boundary conditions between the tests were also different. The galvanized steel plates in the metal TAK strip testing between the kirigami and the platens are softer and more deformable, while the glass plates are harder. In Euler’s column buckling formula, boundary conditions can change the critical buckling force by up to a factor of 16, illustrating how much of a difference this could make between tests. The difference in geometry of activated kirigami (Figure 11) is likely contributed to these discrepancies. Geometry within a single activated sheet differed spatially because of lateral constraints to the system. Future work to activate metal TAK sheets more evenly and allow for later movement could avoid the geometric variance. Overall, the glass sandwich compression tests demonstrated that metal kirigami can be tuned to buckle before glass fracture, enabling the design of kirigami to best fit performance requirements.
During metal TAK strip activation tests, large peaks were visible in the force-displacement data and oscillated as rows of kirigami flipped out of plane (Figure 3B). Similar force oscillations occurred during activation in the sheets, but with decreasing magnitude over time (Figure 5B). The larger width of the sheets (400 mm versus 25.4 mm) means that, during activation, local regions of the sheet are at high enough tensile stress to cause out-of-plane deformation. Unlike in metal TAK strips, this effect is spatially distributed, leading to smoother global force-displacement curves after the initial activation peak. Areas in the metal TAK sheets no longer have level-by-level activation as shown in metal TAK strip testing, allowing for more gradual activation.
4.4. Metal TAK has potential for lighter and lower embodied carbon interlayers
When considering the mass and embodied carbon performance, both 0.254 and 0.381 mm thick kirigami had lower relative masses than their counterparts. 0.254 mm also resulted in lower embodied carbon than previously studied interlayers, but 0.381 mm thick kirigami had similar or greater embodied carbon. Thicker metal TAK strips may yield lower overall embodied carbon if transportation is considered in the analysis. The lower mass and unactivated kirigami system volume are advantageous in transportation use cases, where units could be more tightly packed and shipped. Using 316L steel or other recyclable metals also benefits from existing robust steel recycling infrastructure. Together, these results indicate that monomaterial metal TAK interlayers can be more easily disassembled, reclaimed, and recycled than dry interlayers previously proposed by Oikonomopoulou et al. (2019).
4.5. Applicability and Limitations of TAK Interlayers in Dry-Stacked Glass Masonry
Experimental results indicate that the proposed metal TAK interlayer is a viable solution for dry-stacked glass masonry, capable of resisting the stress levels expected in such systems, while allowing for a fully reversible, material efficient solution. Nevertheless, several limitations must be addressed for real-world applications, including thermal expansion effects, stress concentrations at contact interfaces, alignment with glass units, and protection against moisture ingress and corrosion.
Due to its low coefficient of friction, the TAK interlayer is best employed in non-planar, interlocking glass geometries. In this context, the cut-pattern parameters can be engineered to produce spatially varying stiffness, enabling adaptation to non-uniform load distributions characteristic of interlocking assemblies. The experimental work presented here further revealed that, while global failure is governed by buckling of the TAK interlayer, local cracking may initiate earlier at points of direct contact between the stainless steel and glass. This highlights the need to reduce peak contact stresses at the metal-glass interface. Potential design strategies include alternate cut patterns to cause partial bending and enhance load redistribution, the use of interlayer materials with hardness comparable to or lower than glass (e.g. aluminum, subject to fabrication constraints), and the development of hybrid sandwich interlayers. A hybrid TAK metal core can provide stiffness, creep resistance, and structural efficiency, while softer outer layers can allow for stress homogenization, accommodate surface irregularities, and compensate for fabrication and assembly tolerances.
5. Future Work
Future work could include, but is not limited to, further experimentation and analysis to improve empirical models. Heteroscedasticity in the metal TAK strip model indicated that the linear regression might have some unreliability. Further studies on how boundary conditions affect the stiffness and strength of the metamaterial could better align test environments with glass building systems. More data on the embodied carbon in adhesives would allow for better comparison of the relative tradeoffs between those materials and metal kirigami or other dry interlayer systems.
Future research should extend the evaluation of metal tension-activated kirigami (TAK) interlayers to glass masonry systems with non-planar and interlocking glass interfaces. Emphasis should be placed on tailoring cut-pattern parameters to achieve spatially varying stiffness that responds to uneven load distributions typical of such geometries. Numerical and experimental optimization of kirigami cut patterns and hybrid sandwich configurations is required to control local contact stresses and enable spatially graded stiffness. Finally, system-level investigations on full-scale dry-stacked assemblies, including construction tolerances, assembly sequencing, and reversibility, are needed to validate the applicability of TAK interlayers in real structural glass masonry systems.
6. Conclusions
This paper investigated the viability of metal TAK as a drop-in replacement for glass masonry dry interlayers with lower embodied carbon and mass than its counterparts. Experimental results showed that metal TAK can achieve target stiffness and strength properties with the selection of cut patterns and material thickness. These properties can be modeled using statistical analysis, but models do not translate well when changing from small strips to larger sheets due to changes in activated geometry. Despite this, the discrepancies between experimental and this work’s empirical models are significantly smaller than previous models using finite element simulation methods. Integration with glass did lead to damage in the form of scratching and edge chipping on glass sheets during compression testing, and mitigation strategies should be investigated. Environmental analysis demonstrated that metal TAK has lower mass and embodied carbon than relevant alternatives where data were available.
Acknowledgements
Funding for materials was provided by the Bose Grant. Travel between TU Delft, in The Netherlands and MIT, in the United States, was supported by the MIT MISTI travel grant. Special thank you to Daniel Gilbert in the Center for Bits and Atoms for providing fabrication facilities, TU Delft Civil Engineering for testing assistance, and Professor David Hardt for guidance in statistical analysis.
References
ALUCOBOND PLUS 3A Composites GmbH, 2024. EPD HUB, Alusingenplatz 1 78224 Singen Germany.
Alucobond Technical Data Sheet (Technical Data Sheet), 2016. HVG Facades.
Aurik, M., Snijder, A., Noteboom, C., Nijsse, R., Louter, C., 2018. Experimental analysis on the glass-interlayer system in glass masonry arches. Glass Struct. Eng. 3, 335–353. https://doi.org/10.1007/s40940-018-0068-7
Callens, S.J.P., Zadpoor, A.A., 2018. From flat sheets to curved geometries: Origami and kirigami approaches. Mater. Today 21, 241–264. https://doi.org/10.1016/j.mattod.2017.10.004
Conover, W.J., 1980. Practical nonparametric statistics, 2d ed. ed, Wiley series in probability and mathematical statistics. Wiley, New York.
Corrigan, T., Fleming, P., Eldredge, C., Langer-Anderson, D., 2023a. Strong conformable structure via tension activated kirigami. Commun. Mater. 4, 31. https://doi.org/10.1038/s43246-023-00357-4
Corrigan, T., Srivastava, A., Xie, D., Arthur, C., Brownell, N., 2023b. Folding-Wall Kirigami, Design and Compressive Performance, in: Volume 8: 47th Mechanisms and Robotics Conference (MR). Presented at the ASME 2023 International Design Engineering Technical Conferences and Computers and Information in Engineering Conference, American Society of Mechanical Engineers, Boston, Massachusetts, USA, p. V008T08A046. https://doi.org/10.1115/DETC2023-114915
Corrigan, T., Xie, D., Srivastava, A., 2025. An Undulating Kirigami Pattern With Enhanced Tear Strength. J. Mech. Robot. 17, 044515. https://doi.org/10.1115/1.4067430
Davis, J.R. (Ed.), 1998. Metals Handbook Desk Edition, 2nd ed. ASM International. https://doi.org/10.31399/asm.hb.mhde2.9781627081993
Delo-Photobond 4468 (Technical Data Sheet No. Revision 44), 2016. Supratec Syneo.
Dimas, M., Oikonomopoulou, F., Bilow, M., 2022. IN BETWEEN: An Interlayer Material Study for Interlocking Cast Glass Blocks. Challenging Glass Conf. Proc. 8. https://doi.org/10.47982/cgc.8.416
Eco-profile of long and short chain polyether polyols for polyurethane products, 2021. PlasticsEurope.
Eco-profile of toluene diisocyanate (TDI) and methylene diphenyl diisocyanate (MDI), 2021. PlasticsEurope.
Environmental Product Declaration STS300 from POSCO CO., LTD, 2025. EPD International AB, Box 210 60 SE-100 31 Stockholm Sweden.
Heyman, J., 1997. The stone skeleton: structural engineering of masonry architecture, 1. paperback ed. ed. Cambridge Univ. Press, New York, NY.
Lilliefors, H.W., 1969. On the Kolmogorov-Smirnov Test for the Exponential Distribution with Mean Unknown. J. Am. Stat. Assoc. 64, 387–389. https://doi.org/10.1080/01621459.1969.10500983
Lilliefors, H.W., 1967. On the Kolmogorov-Smirnov Test for Normality with Mean and Variance Unknown. J. Am. Stat. Assoc. 62, 399–402. https://doi.org/10.1080/01621459.1967.10482916
Massimino, D., Townsend, E., Folinus, C., Stern, M., Becker, K., 2024. Additive manufacturing of interlocking glass masonry units. Glass Struct. Eng. https://doi.org/10.1007/s40940-024-00279-8
Oikonomopoulou, F., Bristogianni, T., 2022. Adhesive solutions for cast glass assemblies: ground rules emerging from built case studies on adhesive selection and experimental validation. Glass Struct. Eng. 7, 293–317. https://doi.org/10.1007/s40940-022-00178-w
Oikonomopoulou, F., Bristogianni, T., Barou, L., Jacobs, E., Veer, F.A., Nijsse, R., 2018. Interlocking cast glass components, Exploring a demountable dry-assembly structural glass system. Heron 63, 103–138.
Oikonomopoulou, F., Bristogianni, T., Van Der Velden, M., Ikonomidis, K., 2022. The adhesively-bonded glass brick system of the Qaammat Pavilion in Greenland: From research to realization. Archit. Struct. Constr. 2, 39–62. https://doi.org/10.1007/s44150-022-00031-2
Oikonomopoulou, F., Massimino, D., Guha, S., Bigler, T., Kessel, V., Bristogianni, T., Becker, K., 2025. Reversible joinery methods for full glass vaults made of cast or 3D printed glass components, in: Proceedings of the IASS Annual Symposium 2025. Presented at the international association for shell and spatial structures, IASS, Mexico City, Mexico, p. 12.
Oikonomopoulou, F., Veer, F., Nijsse, R., Baardolf, K., 2015. A completely transparent, adhesively bonded soda-lime glass block masonry system. J. Facade Des. Eng. 2, 201–221. https://doi.org/10.3233/FDE-150021
PERMACOL® 5450, n.d.
Permacol 5450 (Safety Data Sheet), 2023.
PIG Multi-Purpose Repair Putty (MSD-001) (Safety Data Sheet No. 165903 / 500351 / MSD–001), 2019. . New Pig Corporation, One Pork Avenue, Tipton, PA 16684-0304.
PMC-746 (Technical Bulletin No. 030724DH), n.d. .Smooth-On, Inc., 5600 Lower Macungie Rd., Macungie, PA 18062.
PMC-770 (Safety Data Sheet No. SDS No. 687B), 2023.Smooth-On, Inc., 5600 Lower Macungie Rd., Macungie, PA 18062.
PMC-770 (Technical Bulletin No. 061824DH), n.d. Smooth-On, Inc.
Solid Polyester sheets (Environmental Product Declaration), 2022. Exolon Group, Wakkensesteenweg 47, 8700 Tielt, Belgium.
TASK-16 (Safety Data Sheet No. SDS No. 687A), 2021. Smooth-On, Inc., 5600 Lower Macungie Rd., Macungie, PA 18062.
TASK-16 (Technical Bulletin), n.d. Smooth-On, Inc., 5600 Lower Macungie Rd., Macungie, PA 18062.
Vivak PETG Sheet (Technical Data Sheet), 2023. PLASKOLITE, 400 W Nationwide Blvd, Suite 400 Columbus, OH 43215.
Young, W.C., 1989. Roark’s formulas for stress and strain, 6è ed. ed. McGraw-Hill, New York St Louis San Francisco [etc.].