This paper was first presented at GPD 2025.
Link to the full GPD 2025 conference book: GPD_2025_ConferenceProceedingsBook.pdf

Author: Christian Hammer, Thorsten Weimar
Universität Siegen, Chair of Building Structure, Germany
Abstract
Fibre optic sensors enable the measurement of strain and temperature in a comprehensive manner due to the distributed measuring technology based on the Rayleigh signal analysis. The measurement technique is suitable to determine the shear elasticity on small scale tests as well as to specify the load bearing behaviour of specimens at component scale. After determining and evaluating the elasticity of polyvinyl butyral in the laminated state at variable load velocities at room temperature, the present work shows its mechanical properties as a function of temperature. In terms of correlation between the measured signal and the real state of strain, it is necessary to define suitable adhesives for application fibre sensors on the glass surface in a wide temperature range and the behaviour of a single embedded fibre. Investigations on various adhesives using small-scale bending tests on monolithic glass are intended to determine both the rheology and the adhesion between glass and fibre sensor. The behaviour of embedded sensors in different adhesives is determined with an entirely new developed test set-up, which is used for the first time in this context. Small test specimens of glass are bent in time- and temperature-controlled experiments. The test generates a delineated region of homogeneous stress that is monitored by a couple temperature-compensated strain gauge circuit. The results provide a temperature- and time-dependent correlation between frequency shift of the measurement system and surface strain including effects such as slipping and relaxation of the used adhesives. The method for measuring the interlaminar shear modulus from the distributed strain of the glass surface is then presented as a consistent procedure using an analytical model of a uniaxially bent beam and its numerical solution. At the end the effect of gradation of the shear elasticity due to variable velocity of shear strain in the composite beam is shown in large scale tests on laminated beams and plates.
Article Information
- Published by Glass Performance Days, on behalf of the author(s)
- Published as part of the Glass Performance Days Conference Proceedings, June 2025
- Editors: Jan Belis, Christian Louter & Marko Mökkönen
- This work is licensed under a Creative Commons Attribution 4.0 International (CC BY 4.0) license.
- Copyright © 2025 with the author(s)
1. Introduction
To determine time- and temperature dependent mechanical characteristics of polymeric interlayers, there are some test available (Schneider, 2016). Mainly we use static tests like the tension test, the shear test and the four-point-bending test. Mostly these tests are carried out as relaxation tests, recording the load decrease by holding a constant deformation. The three rheology states energyelastic, glass transition an entropy-elastic are determined in dynamic tests such as dynamic mechanical thermal analysis (Ehrenstein, 2003). The time- and temperature-dependency is well described by using the standardises dynamic-mechanical-thermal analysis (DMTA) with its results of glass transition temperature, master curves and time superposition factors from the theory of Williams Landel and Ferry. With regards to Boltzmann’s superposition the strain in the linear viscos-elastic state, we have a suitable method to define a materials law in a wide range of temperature and load velocity (Schwarzl, 1990). However, absolute values of shear elasticity of the polymeric interlayers show errors using test like tension, shear and bending test with a special regard to the four-point-bending test. The tension test provides values of the Young’s modulus and the Poisson’s ratio that requires a strain measurement with high resolution in the region of small strains. The shear test provides values of the internal shear stress without considering the curvature of the bent glass layers. The bending test provides the real stress state in the glass laminate but requires a comprehensive measurement of the strain and deflection, as the bending lines show deviations compared to analytical solutions, which are not detected by measuring the strain and deflection at only a few points.
The analysis of the sensitivity in bending tests shows that small deviations in the measured deflection and strain in the centre of a bent beam in the four-point bending test lead to unacceptable errors in the calculation of the shear modulus according to the linear sandwich theory. Lower deflection and strain is caused by the locked shift between the glass layers in the region of the supporting, that results in a discontinuous bending line which is difficult to describe using classical bending theories. The boundary conditions of the linear sandwich theory as well es the theory of laminated beams and plates provide for curvatures without turning points, that are in fact existing, as we can observe in bending test. To solve this problem, the fibre optic sensors are chosen to measure strain on the glass surface comprehensively as basis of further calculations. Other distributed measuring systems such as digital image correlation (DIC) proves to be difficult in the application to glass laminates and less suitable. With DIC systems a sufficient accuracy is only possible with a high spatial resolution, which only is achieved with small distances and small measuring fields. Furthermore, the rigid body movement part is difficult to determine from curved laminates for calculating the shift between the glass layers, that is important for the calculation of shear strain and the shear elasticity. With fibre optic sensors it is now possible to capture both the strain on the glass surface and the shear elasticity in the interlayer in bent glass laminates.
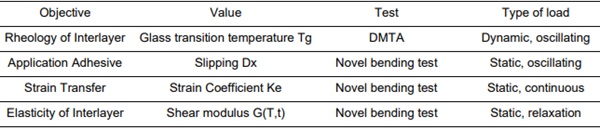
To make the fibre-optic strain measurement a suitable tool for both determining the interlaminar shear elasticity and its evaluation it is necessary to study the behaviour of the fibre sensors itself embedded in in several adhesives under different climatic conditions. The tests are carried out at three temperatures from each rheology state of the used Interlayer of polyvinyl butyral. For the energy-elastic state we use -10 °C, for the glass transition part +25 °C and for the entropy-elastic state +60 °C. With the focus on the primary goal of quantifying the viscoelastic properties of interlayers and its shear elasticity some preliminary examinations must be done. With regards to the wide temperature- and time range the measurement system of fibre optic sensing must be investigated comprehensively. This includes tests on the fibre sensor to define the temperature dependent correlation between the frequency shift of scattered light and the force-induced strain. Furthermore, it is necessary to identify a suitable adhesive which behaves stable over time under various temperature conditions. Because tests on component scale are carried out using bending tests, the primarily examination on the measurement systems are bending test too. These tests use a novel test setup in combination with a standard testing machine and a temperature chamber. In total there a three small scale bending tests, one for the influence of various adhesives, one for the correlation between frequency shift of scattered light and the strain on the glass surface and the third one for the determination of the shear elasticity of interlayers in the laminated state. Table 1 provides an overview of the presented tests.
Table 1: Overview of experiments carried out to investigate a fibre optic measurement system in the context with laminated glass and the shear elasticity of viscoelastic interlayer.
2. Rayleigh Signal Analysis
Rayleigh scattering, named after British physicist John William Strutt, 3rd Baron Rayleigh, is the type of scattering in which electromagnetic waves are deflected by particles (Gifford, 2005). As light has both particle and wave properties, Rayleigh scattering can also be observed in visible light. The wavelength-dependent deflection of the light reflected from the surfaces of objects produces a discolored image for the observer. In nature, Rayleigh scattering can be seen in the reddish light on the horizon at dusk and in the bluish coloration of distant objects in daylight. The effect is based on the deflection of light by molecules and larger particles such as dust and aerosols in the atmosphere as a gaseous optical medium. The blue coloration is caused by diffuse scattering and reflection of the light spectrum in the range of approximately 420 nm to 480 nm by oxygen and nitrogen molecules, which make up the majority of the gas mixture in the Earth's atmosphere. The shift towards the reddish light spectrum in the range of approximately 580 nm to 620 nm is caused by the deflection of the blue components of the wavelength spectrum due to the long path through the atmosphere when the sun is low.
Technically, Rayleigh scattering can be used by detecting backscattered light with a fixed wavelength in a time-resolved manner. In optical waveguides in the form of glass fibres, scattering occurs due to production-related density differences. The resulting change in the refractive index along the fibre axis produces different scattering of the incident light. Due to the light-conducting property of a glass fibre caused by total reflection at the interface of the glass core, the scattered light, which is generally deflected in different directions, is partially backscattered in the opposite direction to the direction of incidence. The backscattered light has a characteristic and individual wavelength or frequency pattern that is clearly linked to the location on the fibre axis (Froggatt, 2004). If the fibre is stretched or compressed as a result of temperature or force, there is a shift in the frequency pattern, which can be converted into strain and temperature using appropriate transfer relationships. The relationship between frequency displacement and fibre elongation is shown schematically in Figure 1.
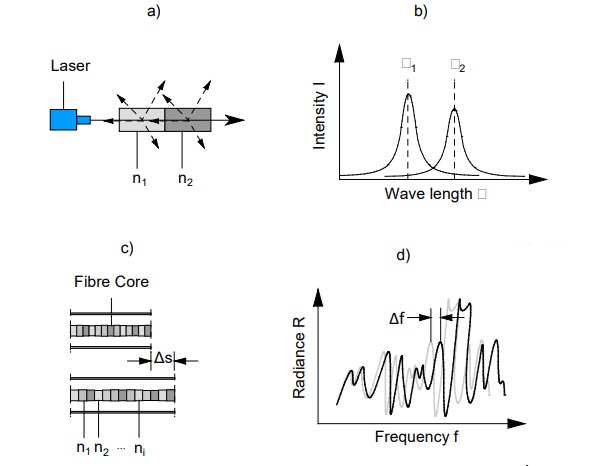
The relationship between frequency change and strain is linear and can be described with a transmission coefficient Kε as a constant factor. The conversion of the frequency signal into temperature follows a non-linear relationship that can be approximated with a fourth-order polynomial (Luna, 2014). Both the transfer coefficient and the parameters of the polynomial function must be determined experimentally. If the elongation of the fibre results from the combination of force and temperature change, it is not possible to assign the temperature or force components. The temperature and force components are coupled and cannot be separated. If, for example, a statically indeterminate structure that is subject to stress under the influence of temperature heats up, the temperature cannot be determined with a sensor applied to the surface. The fibre follows the structure and outputs the strain on the surface as a signal.
The relationship between wavelength λ or frequency f, temperature- and force-induced strain ε is defined by equation 1. In this equation, ∆λ is the change in wavelength, ∆f is the change in frequency, Kε is the transfer coefficient of strain and KT is the transfer coefficient of temperature.
![]()
With c = λf, c as the speed of light and λ* as the reference wavelength, the change in elongation without the influence of temperature can be written as equation 2.

Analogous to equation 2, equation 3 results for the temperature without the influence of force-induced strain.
![]()
With the device-specific reference wavelength of the used laser of λ*= 1,550 nm and the transmission coefficients KT = 6.45 x 10⁻⁶ K⁻¹ and Kε = 0.78 for a germanosilicate glass single-mode fibre, the change in elongation results according to equation 4 and the change in temperature according to equation 5 (Soller, 2005).
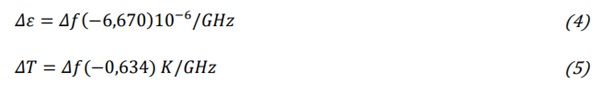
However, these transmission coefficients are dependent on the sensor material used. If the characteristics of the glass core or the manufacturing process changes, the transmission coefficients must be determined experimentally using external, calibrated sensors for strain and temperature as a reference. If glass fibres are embedded in polymer materials or adhesives, for example, the possibly flexible bond between the fibre cladding and the environment results in deviating transmission coefficients.
3. Identify suitable adhesives
The application adhesive must be resistant to the effects of heat during the lamination process, as the sensor fibres are also arranged in the laminate and run through the lamination process. With most adhesives, excessively high temperatures lead to the outgassing of weakly bound components and thus to the decomposition of the adhesive (Habenicht, 2009). The internal structure and molecular composition must not be affected by the lamination. Preliminary tests are therefore required to determine the temperature and time-dependent behaviour, which are the basis for selecting a suitable adhesive. Adhesives that have a low viscosity and are therefore capillary-active are preselected. Capillary activity is required for the gap closure between the round glass fibre and the flat glass surface to ensure contact between the glass fibre and the glass surface and to keep the amount of adhesive as low as possible. Viscosities in the range of 90 mPa∙s to 150 mPa∙s, prove to be suitable. Moisture and light-curing acrylate adhesives are generally suitable ins this case. Adhesives based on epoxy resin and those that are two-component usually have a highly viscous to pasty consistency, which is unsuitable for uniform bonding of the fragile sensor fibre.
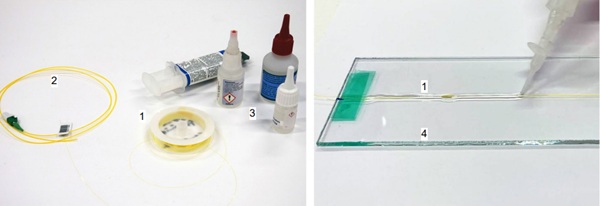
The required resistance to the bonding temperature during lamination of nearly 120 °C limits the variety of adhesives available on the market. The moisture-curing acrylate adhesives Z70 for strain gauges from HBK , the adhesive Loctite 406 from Henkel Adhesives and the radiation-curing acrylate adhesive Acrybond 2002 from Staik were selected. First, a sensor fibre is bonded to a small, rectangular strip of soda-lime silicate glass with a thickness of 3 mm. After application and the time required by the manufacturer, the adhesives remain in an air-conditioned laboratory room at an average temperature of 23 °C and an average relative humidity of 50 % until fully cured. To simulate the laminating process for the laminated glass, the adhesive is stored in the climate chamber at a temperature of 120 °C for 90 minutes. Figure 2 shows the components required for the measurement, consisting of sensor fibre (1), pigtail as connection between fibre and laser (2), application adhesive (3) and the glass strip (4).
The measured strains are not to be understood as absolute values, as the exact transmission relationship between frequency signal and fibre strain can only be determined after the bond slip test has been completed in accordance with chapter 4. Since the strain coefficient has a constant value due to the measuring principle according to chapter 2, the subsequent superposition of the measured values is permissible and thus the evaluation of the bond stiffness of the bond is also possible before the coefficient is determined.
To enable the most direct possible transfer of the fibre strain to the glass surface, an adhesive with high stiffness must be selected that exhibits only a very slight change in the temperature range of the tests as a function of the load level and the load speed. The transfer coefficient for the elongation of the fibre is determined under different, selected temperatures to convert the frequency change in the measurement signal into elongation change at changing temperature. However, the influence of changing temperature during the test is not relevant for further investigations, as the temperature is constant at every point of the test specimen over the duration of the test. Although different temperatures are provided for the characterization of the interlayers, the tests themselves are carried out under isothermal conditions, without temporally and locally variable temperature. As different strain rates result both around the test section and from the test program, the adhesive must be stable over time and show as little change as possible as a function of the strain rate.
A relationship as a function of speed cannot be determined, as the strain rate on the glass surface of a laminated glass is in principle time-dependent at any location on the measuring section. The distributed values measured with the fibre sensor can therefore not be referenced, as the strain measurement within the laminated cross-section is carried out exclusively with the fibre-optic strain measurement. If there is a flexible bond between the fibre and the glass surface, it is therefore not possible to clearly transfer the measured strain rate to the strain rate on the glass surface, as the behaviour of the laminated test specimen to be determined is still unknown before the measurement. Laminated beams made of laminated glass, which have a partial shear bond, have inflection points in the bending line. This results in a change of sign in the curvature curve and during the surface strain along the beam axis. A sensor fibre bonded over the entire length of the beam is therefore both compressed and stretched along a section. If the bonding is flexible, slip occurs between the sensor fibre and the glass surface, which leads to incorrect measured values.
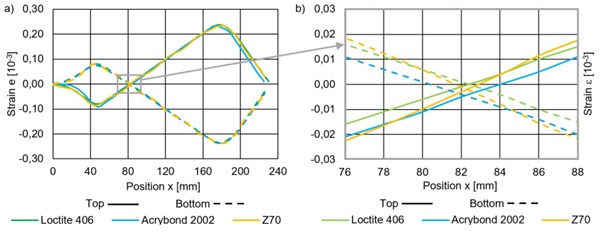
The change of sign in the strain curve results in a zero crossing, which can shift along the axis because of retardation, relaxation and the elastic deformation of the adhesive. The displacement of the zero point in the strain curve can be interpreted as a measure of the slip between the sensor fibre and the glass surface and serves as an evaluation criterion for the stiffness of the bonded joint in the direction of the fibre axis. Figure 3 shows the principle of the slip of the fibre due to a flexible bond on the progress of the strain measured in the fibre. If the strain curves measured with different adhesives are superimposed, the slip can be determined by the dimension ∆x. The lower the slip, the lower the deviation from the actual zero passage at the point of inflection WP.
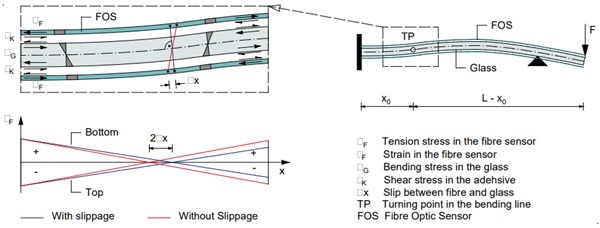
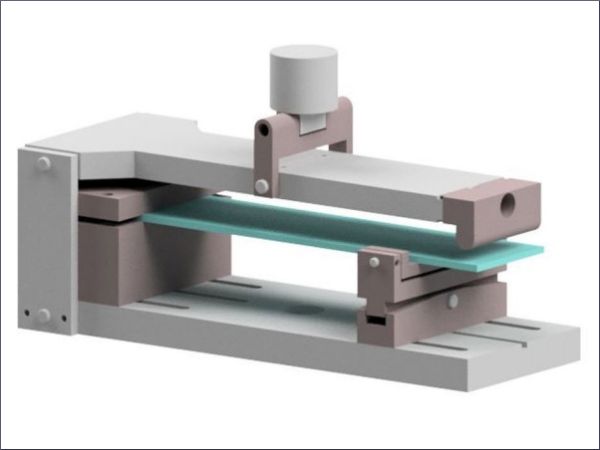
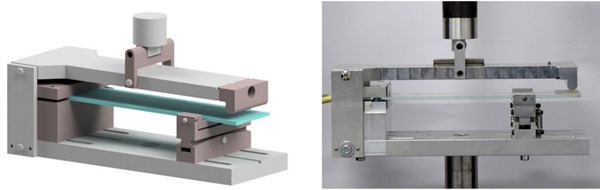
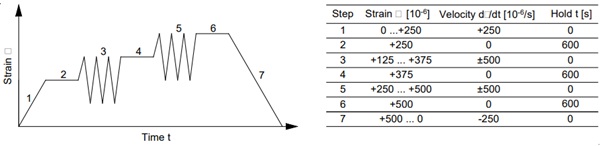
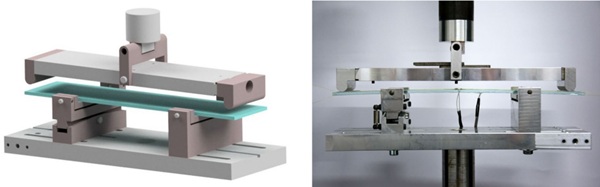
The strain distribution in the test setup is exactly linear at a small distance between the supports. The actual zero crossing of the strain curve can therefore be determined using equidistant strain gauges at some distance from the turning point. The test setup is designed in such a way that a statically indeterminate supporting of the glass beam generates a change in curvature of the bending line between the supports. The specimen holder is manufactured of aluminium components, which are connected with dowel pins and metric machine screws. Only axial forces may be introduced into the testing machine. To avoid bending moments in the testing machine and the sensitive load cell, a pivoted load lever is arranged on the left-hand side of the structure, which is loaded in the centre. The load is applied to the test specimen at the tip of the cantilever arm with half the value of the measured force. To compensate for imperfections in the test specimen and tolerances in the test setup, the movable support is designed as a universal joint that allows rotation both around the longitudinal axis of the test specimen and transversely to it. The load application on the right-hand side of the load lever must therefore have a further degree of freedom, which follows any rotation of the test specimen about the longitudinal axis and enables tests free of constraint loadings. Figure 4 shows the developed bending test-setup as rendering on the left and realised with the test specimen as well as the applicated fibre sensor. The Specimen of soda lime silicate glass has the length of 230 mm, the width of 50 mm and the thickness of 3 mm. The fibre sensor is applicated in the centre axis of the specimen. The test procedure with values of strain and strain velocity are shown in figure 5.
The measurement data first is captured as raw data from the measurement system. The shown curves are postprocessed using a sliding median by creating sub matrices in the time and the position domain. The flat supporting detail causes a smooth progression of strain in contrast to a sharp and linear supporting. Previous tests show that the setup behaves linear over time and load, so that a constant position of the turning point can be assumed. Figure 6 shows exemplarily the progression of strain over time and position at the temperature of +25 °C. The graph on the left is recorded during increasing strain and the one on the right during constant strain.
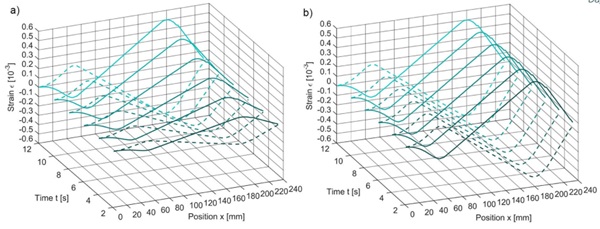
The data analysis is carried out at different time steps. The greatest slipage is expected during the highest load. At the end of the test procedure, the results should detect any permanent defects or deformations. The comparison of the selected adhesives Loctite 406, Acrybond 2002 and Z70 as illustrated in figure 7 a) shows the flexible bonding of the UV-curing adhesive Acrybond 2002. The resulting slippage is clearly visible in figure 7 b). The Adhesive Z70 shows a stiffer behaviour than Acrybond 2002. However, it shows irreversible deformations resulting in fluctuation of strain over the x-axis at the end of the test procedure. The Loctite 406 adhesive exhibits rigid behaviour with no time dependency over the entire duration of the test. There is no visible slippage or permanent deformation of the bonding. Therefore, this adhesive is used for all further examinations.
4. From frequency to surface strain
To determine the frequency-strain relationship, a small-format bending test is used, analogous to the analysis of the time stability of the application adhesives as described in chapter 3 but with a statically determined supporting. The test setup can be modified accordingly. Loading in the four-point bending test proves to be suitable, as a range with a constant bending moment or a surface strain that is constantly distributed over the beam axis is established between the inner load application points. In accordance with the bending test in Chapter 3, the sensor fibre is bonded centrally to the top and bottom of the glass strip. This results in two measuring sections on one sensor, one on the upper side in the tensile range and one on the underside in the compression range. In addition, high-precision strain gauges are arranged in the middle of the top and bottom sides, which serve as reference. The measuring points each have two strain gauges, which are arranged a short distance to the left and right of the fibre and produce a measured average value. Figure 8 shows the developed bending testsetup as rendering on the left and realised with the test specimen as well as the applicated fibre sensor next to the strain gages.
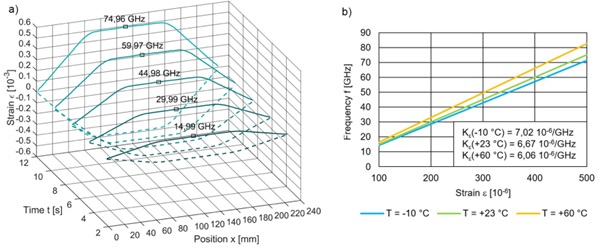
The test to determine the strain transfer coefficient between measured frequency signal as GHz-values and the measured strain from the strain gages are carried out at the three temperatures -10 °C, +25 °C and +60 °C. Figure 9 a) contains the strain curves over time and position under constant load velocity up to the maximum strain of 500 µm/m at 25 °C. The strain transfer shows linearity over strain level and time. Due to the independence of time and strain, the frequency signal can be transmitted with individual factors over the entire strain and velocity spectrum. However, a temperature shift is recorded, as shown in Figure 9 b)
5. Determination of interlaminar shear modulus
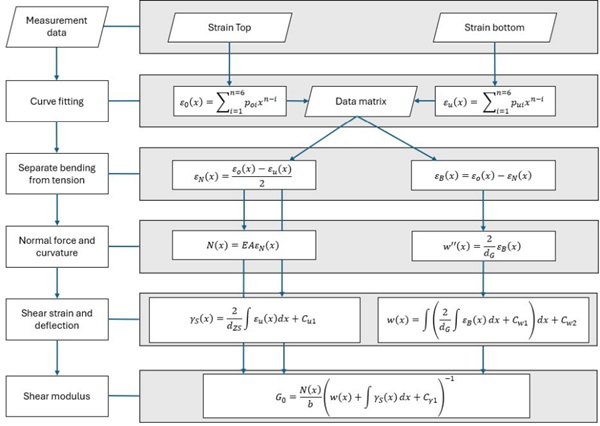
The stress in the glass cross-section is calculated under the assumption that Hooke's law is valid and that the modulus of elasticity of the glass is constant in the relevant time and temperature range. Furthermore, the glass cross-section is assumed to remain flat and perpendicular to the beam axis in the deformed state. The normal stresses are linearly distributed over the layer thickness. The shear stiffness is approximately infinite and therefore the shear distortion in the glass layers is zero. The interlayer is soft in shear and distorts due to the differential displacement of the glass layers. The slip of the interlayer is distributed constantly over the layer thickness and produces a flat cross-section inclined to the normal of the beam axis. It is also assumed that the shear stress is constantly distributed across the width of the beam (Altenbach, 1996). First, the elementary deformation variables curvature of the glass layers and shear strain of the interlayers must be determined from the surface strains of the glass layers. The basis is the differential equation of the bending theory according to Euler-Bernoulli (Gross, 2005). Due to the internal state of equilibrium, the stress distribution of the upper glass layer is the same as that of the lower layer, considering the boundary condition of geometric linearity. Figure 10 shows the kinematics of the composite cross-section of an infinitesimal element.
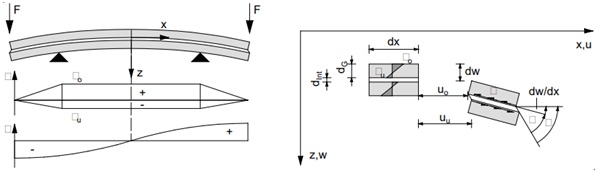
With the knowledge of the distributed strain on both sides of the upper glass layer it is now possible to calculate all further deformation and stress. After the postprocessing the data is fitted polynomial using a 6th order regression. Starting from the center of ther beam as point of origin to the edge, integration constants are easy determined using the coefficients of the polynomial regression. Separating the bending moment from the normal force using the relevant stress resultants enables to calculate the elongation of each layer in the composite as well as the curvature of the beam. After integrating curvature and Strain of the bottom side of the upper glass layer follows deflection and shear strain. The shear modulus is than calculated by Hooke’s Law with equilibrium of shear force, normal force and shear angle. Regarding the linear sandwich theory, it is revealed that the absence of normal force in the glass layer results in a shear modulus of zero. In addition, the shear modulus is a function over the beam-axis that should be a constant value during relaxation tests considering Boltzmann superposition law. The procedure is implemented in a MATLAB-code and illustrated in picture 11.
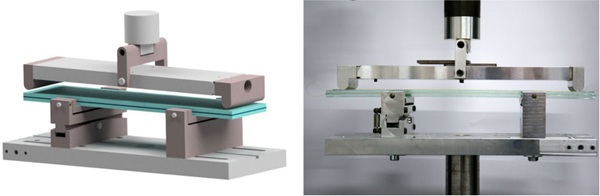
The Bending test setup is similar to the test setup which is used for the transfer of frequency to fibre strain according to chapter 4. The investigation is carried out using a small beam of laminated glass. The glass layers have a thickness of 3 mm and the PVB- interlayer of 0.76 mm. The width is 50 mm and the length is 230 mm. Figure 12 shows the developed bending test-setup as rendering on the left and realised with the test specimen as laminated glass beam as well as the applicated fibre sensor.
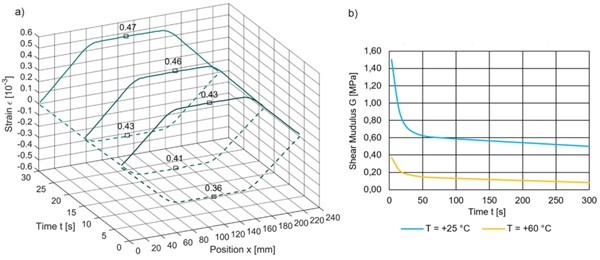
The bending test is performed as strain-controlled relaxation test at temperatures from -10 °C, +25 °C to +60 °C while recording the strain on the top and the bottom side of upper glass layer. The results of the strain measurement are shown in figure 13. Figure 13 a) contains exemplarily the strain curves over time and position at the times 3 s, 15 s and 30 s. Figure 13 b) shows the calculated shear modulus from fibre optic strain measurement at temperature +25 °C and +60 °C. Using the curve from figure 13 b) it is now possible to include values of the shear modulus in a generalized maxwell model (Baumgaertel, 1998) which is mathematically represented as Prony series. The transmission from the frequency to the time domain enables the use of experimental data from DMTA experiments in conjunction with relaxation tests using the time superposition principle (Schuster, 2023).
6. Summary and Outlook
The present work shows the application of fibre optic sensors as strain measurement system on the glass surface. To use measurement data from fibre optic strain measurement for further calculation of the shear modulus on laminated glass beams, tests on the fibre and the application adhesive must be carried out first. The humidity-curing acrylate Loctite 406 is suitable for application of fibre sensors on the surface of flat glass during the lamination process with temperature up to 130 °C. A novel test setup enables two different bending tests, which are required both for identifying a suitable application adhesive and to determine the transition between frequency signal and fibre strain. Afterwards the same setup is used for the examination of the shear elasticity of small scale specimens of laminated glass by distributed measurement of the surface strain on the top and the bottom of the upper glass layer. The recorded stress state in the laminated glass forms the basis for further calculation using the mechanical model of the linear sandwich theory. The procedure from the raw data fit over stress resultants to the interlaminar shear modulus is shown as flowchart for a MATLAB routine.
Actual work includes the investigation of laminated glass beams and plates at component scale in relaxation tests as well as cyclic tests. Especially in cyclic tests using sinusoidal loads a gradation of the interlayer stiffness is expected due to the variable shear velocity over the beam axis and the plate area respectivly. After completion of the component-scale tests in mono- and bidirectional bending tests, a standardised method for determining the interlayer properties in the laminated state is presented.
References
Schneider, J., Kuntsche, J., Schula, S., Schneider, F., Wörner, J.-D. (2016). Glasbau. Berlin, Germany: Springer Vieweg
Ehrenstein, G. W., Riedel, G., Trawiel, P. (2003). Praxis der thermischen Analyse von Kunststoffen. München, Germany: Hanser
Schwarzl, F. R., Polymermechanik. (1990). Berlin, Germany: Springer
Gifford, D., Soller, B., Wolfe, M., Froggatt, M. (2005). Distributed Fiber-Optic Sensing using Rayleigh Backscatter. Glasgow, Scotland: WB 4, p. 5, European Conference on Optical Communications (ECOC) Technical Digest
Frogatt, M., Soller, B., Gifford, D., Wolfe, M. (2004). Correlation and keying of Rayleigh scatter for loss and temperature sensing in parallel optical networks. Los Angeles, USA: OFC Technical Digest, paper PDP 17
Luna, Inc. (2017). ODiSI-B, User’s Guide v. 5.2.1. Blacksburg, VA, USA
Habenicht, G. (2009). Kleben. Berlin, Germany: Springer
Altenbach, H., Altenbach, J., Rikards, R. (1996). Stuttgart, Germany: Deutscher Verlag für Grundstoffindustrie
Gross, D., Hauger, W., Schnell, W., Schröder, J. (2005). Berlin, Germany: Springer.
Baumgaertel, M., Winter, H. H. (1989). Determination of discrete relaxation and retardation time spectra from dynamic mechanical data. In: Rheologica Acta 1989.
Schuster, M., Härth, M., Thiele, K., Bennison, S. J. (2023). Quantification of the linear viscoelastic behavior of multilayer polymer interlayers for laminated glass. In: Glass Structures an Engineering 2023. Berlin, Germany: Springer