Authors: Maximilian Möckel & M. Engelmann
Source: Glass Structures & Engineering | https://doi.org/10.1007/s40940-025-00315-1
Abstract
It is evident that glass, a highly regarded building material, has already become a prominent feature in building construction, not only in the context of façades but also as a load-bearing element. Nevertheless, the use of increasingly larger glass elements in these prestigious buildings demonstrates that glass is not merely the external finish of the building. Glass beams or glass fins serve as the façade’s substructure. This means that glass must be considered in the building's fire protection concept to maintain structural integrity. However, prior research has demonstrated poor fire resistance of conventional glass beams. Therefore, a concept of an enhanced fire-resistant glass beam was developed. Conventional glass beams were encased in a fire protection system comprising fire-retardant gel and sacrificial glass panes. Their functionality was tested in fire tests. This paper presents the development of the novel fire protection system, as well as the planning, execution and evaluation of the fire tests. To check and ensure comparability and reproducibility, the experimental setup and results are compared with those reported in the literature. The results demonstrate, that the use of a proper fire protection system significantly enhances the fire resistance of mechanically loaded glass beams compared to conventional reference structures. We found an increase of fire resistance time of over 200% allowing for classification of R30.
1 Introduction
The increasing global interest in load-bearing glass stands against the challenges and requirements of fire protection in the planning of buildings. Glass, like other building materials, has a low transformation and melting temperature, rendering it unsuitable for use in load-bearing fire-resistant structures. A substantial body of experimental examinations exists concerning the lack of sufficient fire resistance of glass beams [for example Sturkenboom (2018) and Möckel et al. (2022b)]. These previous research projects showed that regular glass beams have a maximum fire resistance time of 24.4 min. Furthermore, some test specimens failed to achieve a fire resistance time of 15 min due to a failure time of minimum 4.7 min. Therefore, a defined classification could not be ensured. Moreover, the efficacy of conventional fire protection measures, such as fire-resistant coatings, is questionable due to the significant restriction of transparency [as shown in (Sturkenboom 2018)]. These conditions present a significant challenge in the planning of load-bearing, fire-resistant, yet very transparent glazing. On the other hand, fire-resistant glazing for the purpose of transparent fire compartmentalisation for a lifespan of up to 120 min is state of the art. Therefore, and as a novelty, we used their structural design concept in a load-bearing glass beam configuration. The Institute of Building Construction of TUD Dresden University of Technology in cooperation with industry partners participated in the research project FiReGlass, which aimed to develop a concept for enhancing the fire resistance of structural glass beams without compromising transparency. In order to achieve this goal, a glass beam was protected using fire-retardant gel for experimental testing. The validation of the test concept using reference samples constituted the planning, execution and evaluation of the tests are presented in this paper. Furthermore, the knowledge gained can assist in the avoidance of sources of error and the establishment of a reproducible test concept for future fire tests.
2 State of the art
2.1 Fire resistance
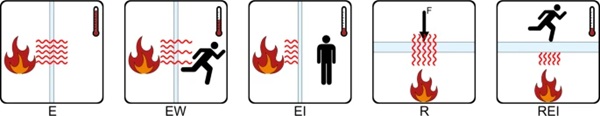
The assessment of fire behaviour is regulated by EN 13501-1 (2019) and EN 13501-2 (2016) standards on European level. This study exclusively considers the regulations set forth in EN 13501-2 (2016), which pertain to the determination of fire resistance. Fire resistance, in essence, denotes the duration for which a building product can maintain its intended functionality in the event of a fire. This definition of fire resistance is employed in the experiments presented here. EN 13501-2 (2016) defines various fire resistance classes, each corresponding to the specific functions of the construction products. For instance, a fire-resistant interior wall is designed to serve as a spatial separation, whereas a ceiling bears static loads and simultaneously forms a fire barrier. In accordance with the specifications set forth in EN 13501-2 (2016), the majority of building products can be classified into four categories: E (room closure), I (insulation), R (load-bearing capacity), and W (radiation). In accordance with the specific requirements, the aforementioned classes may also be combined. In the event that a partition is classified as EI, it is required to act as a shield for the radiation and heat emitted by the fire, preventing their transmission to other rooms. The classification time represents the duration of the fire resistance. A partition wall classified as EI 30 is required to maintain its designated functions for a minimum of 30 min in the event of a fire (according to the standard temperature–time curve (EN 13501-2 2016)).
Fig. 1 illustrates the fundamental functions of the discrete fire resistance classes in conjunction with partition walls and load-bearing ceilings. Classes E, EW and EI have been developed for glass structures. However, the load transfer of these constructions parallel to the glass pane is excluded in these approvals. Consequently, the load transfer parallel to the glass pane and thus the classes R and REI remain currently unregulated, thereby establishing an unresolved research gap in the field of structural glass construction. Due to the focus on load-bearing glass beams, this study is exclusively concerned with the fire resistance class R (load-bearing capacity).
2.2 Fire resistant glazing
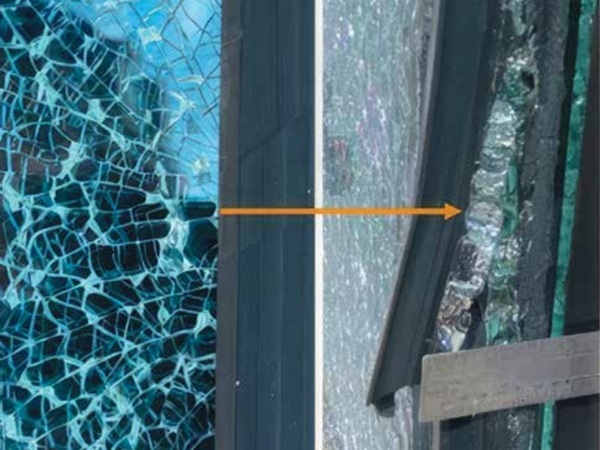
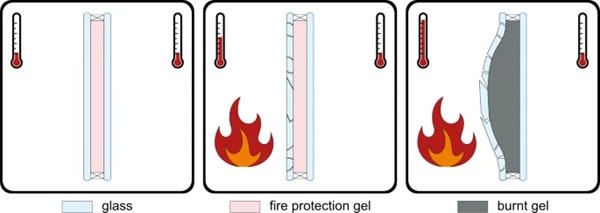
In comparison with annealed borosilicate glass (BSG), annealed soda-lime silicate glass (SLG) exhibits a higher coefficient of linear thermal expansion [SLG: 9.0 × 10⁻⁶ EN 572-1 (2016); BSG: ~4.0 × 10⁻⁶ EN 1748-1-1 (2004)]. Consequently, BSG demonstrates a higher thermal shock resistance than SLG [BSG: 100 K; SLG: 40 K; (Schneider et al. 2016)]. Therefore, BSG is the preferred option for use as Class E fire-resistant glazing. Monolithic fire-resistant glass can be used in this context but is usually insufficient for classes EW and EI, as it fails to meet their thermal energy and temperature transmission limits. A special fire-retardant gel is required to comply with these regulations. Fire-resistant glazing consists of two or more panes joined with a cavity up to 36 mm in thickness. The glazing consists of SLG, which is supposed to break as quickly as possible in the event of a fire (see Fig. 2). At around 150 °C, the water-salt based gel reacts, releases water, foams up, and cools the opposite side through the endothermic process. The burnt salt forms a black insulating crust that prevents heat from being transferred by radiation or conduction to the opposite side (Schneider et al. 2016). This protective layer allows fire-resistant glazing to last up to 120 min [e.g. class EI120 according to EN 13501-2 (2016)]. Every company has its own composition for the fire-retardant gel and as a result, the type of reaction differs between these types. In addition, different gel thicknesses cause different impact of fire protection. At present, the use of non-load-bearing partition walls as fire-resistant glazing is state of the art. However, there is no regulatory framework in place for the transfer of the functionality of fire-resistant glazing to load-bearing glazing.
2.3 Glass and fire
The temperature distribution within glass during a fire is influenced by a number of factors, including the dimensions of the component, its position relative to the fire, and the characteristics of the fire itself. The thermal shock resistance of annealed SLG [40 K, (EN 572-1 2016)] significantly enhances during tempering process, reaching 200 K for fully tempered glass (EN 12150–1 2020). Nevertheless, both SLG and BSG have a transformation temperature Tg of approximately 530 °C (EN 572-1 2016; EN 1748-1-1 2004). This is the point the glass changes from a solid to a viscoelastic state.
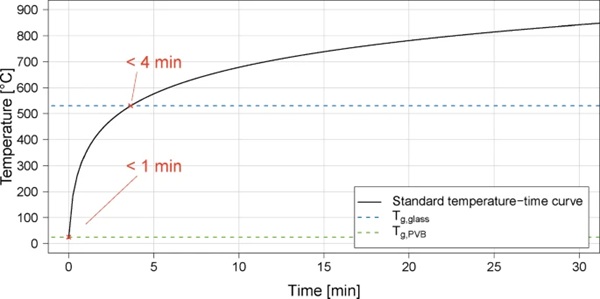
A review of the standard temperature–time curve (STC) defined in EN 13501-2 (2016) reveals that in the event of a fire the glass is exposed to critical temperature action of 530 °C (Tg) in less than 4 min. In addition, the temperature action reaches the glass transition temperature of standard PVB [Tg,PVB; Kuraray (2024)] within 1 min (Fig. 3) which is not indicative of any limit state but marks a minimum. It is part of recent research to find critical limit above as it depends on the composition and dimensions of the construction when the temperature reaches the core. There is a lack of generally applied and accepted procedures to successfully find the transient temperature development in a generalised construction.
If Tg is exceeded in the material, the viscosity of the glass decreases significantly. Critical orders of deformation occur, which are safety-relevant but cannot be determined with certainty at present. The determination of these deformations is only possible through the utilisation of experimental tests conducted on the component itself. Thus, it is worth striving for a generalized material model that allows a safe and reliable numerical estimation of the temperature distribution over time in any glass structure.
Bedon (2017) provides a comprehensive summary of current research on glass structures under fire load. Similarly, Ensslen et al. (2023), Galuppi et al. (2023) and Schwind et al. (2022, 2023) review the current state of research on glass in construction under climatic actions and fire loads. These publications highlight the existing research gaps, in particular the lack of specific normative provisions addressing the fire behaviour, fire resistance and overall thermo-mechanical behaviour of glass, especially in load-bearing applications. The authors highlight that existing fire regulations for structural glass, such as EN 1365-3 (2000), are generally formulated and lack specificity for application in glass construction. The current version of Eurocode 10 (CEN TS 19100-1 2021; CEN TS 19100-2 2021; CEN TS 19100-3 2021) does not include a section on the fire design of glass. As shown in this paper, the classification of glass beams in accordance with EN 13501-2 (2016) should be the first step in fire design of such glass structures.
2.4 Experimental tests
Early studies by Veer et al. (2001) and Bokel et al. (2003) examined the structural behaviour of glass under thermo-mechanical or fire load. Glass beams made of monolithic annealed panes and chemically toughened SLG beams laminated with polycarbonate were tested. In addition, the exterior surfaces of the specimens were coated with intumescent gel in order to examine the influence of the gel on the fire resistance. The specimens were subjected to four-point bending while exposed to a constant flame. Tests showed that for this specific test configuration chemically toughened and laminated glass offer 15–20 times higher fire resistance than annealed monolithic glass while intumescent gel can further extend this duration. Using thermally or chemically toughened glass and fire-resistant layers significantly improved fire resistance time within these test series. The intumescent coating layer extended the fire resistance time of the beams but reduced the transparency of the glass. As used for the specimens in this paper, fire-retardant gel offers better transparency properties than a coating.
While Heinemeyer et al. (2014) published some first insights into the structural behaviour of laminated safety glass (LSG) in fire conditions, Nodehi (2016) presents further fire tests on monolithic glass panes in both horizontal and vertical positions with the temperature load of the STC. The tests showed, for this specific test configuration that annealed glass failed within 3 min prematurely, while heat strengthened glass (HSG) and fully tempered glass (FTG) endured until melting. Thermally toughened glass exhibits more predictable fire behavior, making HSG or FTG the preferred choice for fire-resistant components.
Kozłowski et al. (2018) and Sjöström et al. (2020) describe the design and execution of fire tests on timber-glass composite beams with the aim of extending the fire resistance time. They combined a laminated glass beam with wooden flanges at the top and bottom to protect the glass edges from the heat of the fire. As a result, the glass panes broke prematurely because the temperature gradient in the glass was too large due to the shielding with the wood. A transparent fire protection layer would offer maximum transparency with good fire protection properties providing a minimum of shielding parts of the load-bearing structure.
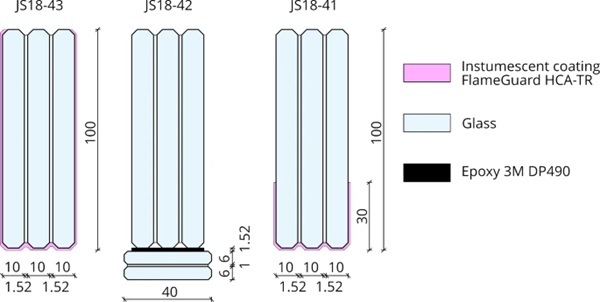
Sturkenboom (2018) proposed and initially tested ideas to increase the fire resistance of glass beams (Fig. 4). The approaches include fire-resistant coating over the full height of the beam to foam up in the event of fire (JS18-43), a protection of the lower glass edge with a laminated glass (JS18-42) and a fire-resistant coating of the lower glass edge up to a height of 30 mm of the beam (JS18-41). The translucent coating of JS18-43 and JS18-41, however, limits the transparency of the glass beam. One specimen of each design was tested. A statistical evaluation is therefore not possible. The results of the tests show that JS18-42 did not provide a considerable improvement, as both the edge protection and the beam itself broke prematurely. JS18-43 and JS18-41 showed an improvement in the failure time (see Table 2).
These approaches have been taken up and further developed in the current research project at TUD Dresden University of Technology. Further approaches for prototypes were presented in Möckel et al. (2023). The publication also describes the application possibilities and the European standards and regulations that are necessary for the use of a glass beam with increased fire resistance.
2.5 Laminated glass beams under fire load
In a series of four-point bending tests conducted under fire load conditions, Louter et al. (2021) and Sturkenboom (2018) examined the fire performance of laminated glass beams as an extension of the preliminary tests conducted by Louter and Nussbaumer (2016). The objective of these tests was to evaluate the effect of the level of prestress on the fire resistance of the specimen.
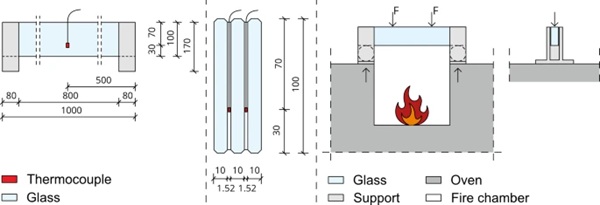
Fig. 5 shows a schematic illustration of the test set-up. The set-up was positioned above the opening of a ceiling test furnace. The furnace was sealed using fire resistant calcium silicate panels and mineral wool. In addition to the fire load using the STC, a mechanical load was applied on two points with a load stamp. Two thermocouples were embedded within the interlayers of the specimens and four thermocouples were applied within the burning chamber. As a result, the specimens failed by exceeding the failure criteria (deflection or deflection rate) according to the EN 13501-2 (2016) (Eqs. 1, 2) between 35 and 45 min of testing. This allows for classification according to class R30. The fire-resistant panels were applied in such a manner that they covered the upper 30 mm of the glass beams (see Fig. 6). The test setup did not reflect a real installation condition. Thus, it remains questionable how this set-up can be generalised.
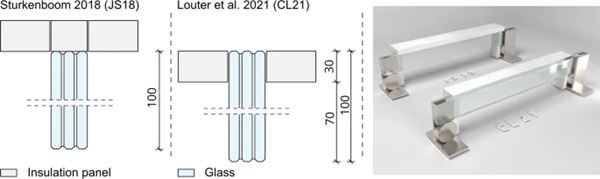
Sturkenboom (2018) conducted analogous experiments. In contrast to the test set-up of Louter et al. (2021) the fire-resistant plates were not covering any part of the beams. Fig. 6 illustrates the different configurations in both studies. Covering the upper 30 mm of the beams in the tests by Louter and Nussbaumer (2016) and Louter et al. (2021), resulted in significantly higher fire resistance times of up to 45 min (increase of 80%). Therefore, the results of Sturkenboom (2018) will be further considered in the following analyses, as his test set-up is closer to a realistic application.
Möckel et al. (2022b) conducted similar fire experiments to evaluate the results of Sturkenboom (2018) and Louter et al. (2021). The tested beams exceeded the maximum deflection rate according to EN 13501-2 (2016) by melting down or breaking between 5 and 25 min. A fire resistance time of 30 min could not be reached. Consequently, classification in fire resistance class R30 of Louter et al. (2021) was not achieved.
2.6 Numerical examinations
The previously presented fire tests on glass beams by Louter et al. (2021) have been numerically simulated for validation. The core temperature of the glass beam as a function of time as well as the deflection and the deflection rate as a function of time were simulated. Furthermore, the influence of the fire protection plates (see Fig. 6) on the temperature and deflection behaviour was examined. As expected, the top zone protection provided by the fire protection plates results in a significant influence on the failure time of the glass beam. With a width of 30 mm an increase from 18 to 48 min (increase of over 260%) in the failure time could be calculated. Furthermore, the impact of the level of mechanical load on the failure time was examined numerically. It could be calculated that an increase in the mechanical load results in a reduction in the failure time. It is therefore important to define load levels for classification that are as meaningful as possible, reflect the actual application, and comply with the applicable standard.
Möckel et al. (2022a) simulated the heat transfer through a laminated glass beam. The numerical model was validated using experimental results from Sturkenboom (2018) and Möckel et al. (2022b) and the numerical results of Louter et al. (2021). Möckel et al. (2022a) present also present a parametric study to analyse the influence of various parameters on the heat transfer through the glass beam. The model was then adapted with regard to the parameters glass thickness, glass composition and dimensions. While the component height has negligible influence, the results indicated that augmenting the material thickness have a substantial influence on the development of the core temperature of the glass beam. Therefore, additional of supplementary glass panes, or an increase in the glass thickness within the package, will shield the load-bearing layer for an extended period of time.
2.7 Summary
The state of the art shows that existing classifications under EN 13501-2 address only non-load-bearing glass elements, leaving load-bearing components such as beams outside the regulatory framework, even though experimental fire tests showed that load-bearing glass beams do not provide sufficient structural safety in the event of a fire. It was not possible to demonstrate a fire resistance time of at least 30 min. Furthermore, the tests have shown that the variation in failure time between 5 and 25 min is too high for a reliable classification. However, the literature also shows that there is a demand for glass beams with defined fire resistance, and initial ideas have been developed to successful extend the fire resistance time of glass beams even with reduction of transparency.
Accordingly, the main research gap that remains is the development of a transparent fire-resistant glass beam that demonstrates a defined fire resistance time of minimum 30 min. This paper shows the main steps of the development as well as the results of the experimental fire tests to define the fire resistance of these glass beams.
3 Glass beam with enhanced fire resistance
3.1 Development
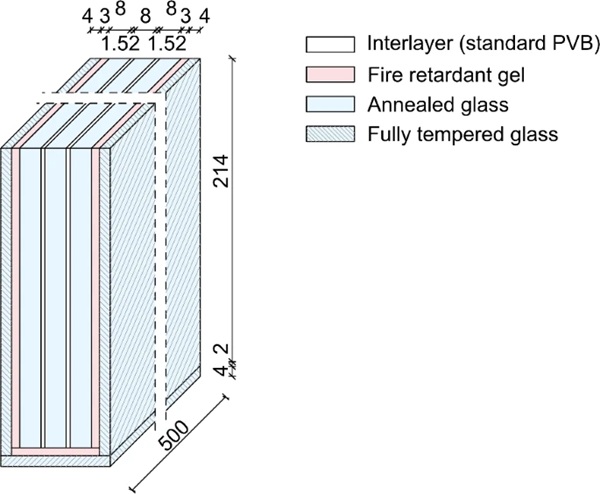
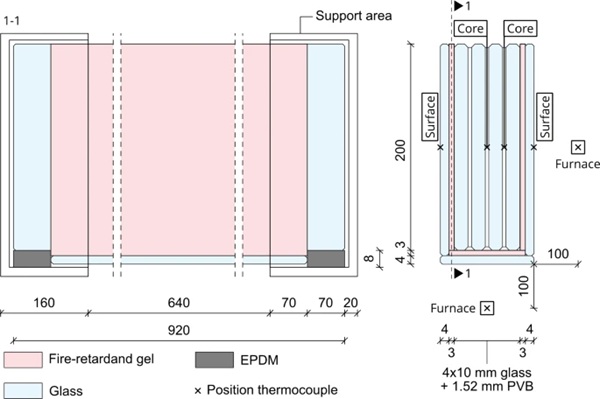
Fig. 7 shows a schematic illustration of the enhanced glass beam. Additional sacrificial layers made of 4 mm thick fully tempered glass and a layer of 3 mm thick fire-retardant gel shield the flanges as well as the weak bottom edge. Top edge will be covered by the top of the furnace. In addition to shielding the inner load-bearing structure, the fire-retardant gel is intended to serve the purpose of preventing burning materials from dripping off the beam in the event of a fire. The gel is a product of the industry partner. The specific composition is a company secret.
3.2 Preliminary functional test
3.2.1 Specimen and set-up
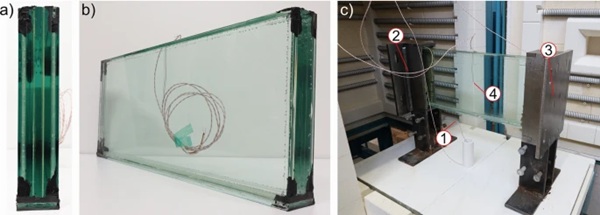
A preliminary test in a radiation oven was conducted to study the behavior of fire protection gel at high temperatures when applied around laminated glass. The goal was to compare the radiation oven with the firing furnace in terms of temperature curves and to examine the delay in heating of the materials in a glass beam with a support structure. It was hoped for to gain more knowledge being able to use straightforward radiation oven experiments as a preparation for complex furnace tests. A specimen was prepared with a fire protection gel layer (Fig. 7) and tested in the radiation laboratory oven at TU Dresden (Rohde ELS 330 S). Fig. 8a and b show the specimen in detail. Fig. 8c shows the built-in specimen with two supports. The sacrificial glass panes were expected to break within the first few minutes, releasing the gel. Four thermocouples type N were placed to measure temperature: ambient (1), supports faced to the glass edge (2, 3), and within the PVB interlayer (4), that was installed during production. The temperature measurements were verified through the calibration of the thermocouples before the test. The supports were made of steel (left) and stainless steel (right) and shielded an area of 60 mm at both sides of the beam. The oven heated at a rate of 14 K/min, and mineral wool was used to fill gaps in the supports, ensuring no contact between the glass and metal. After 45 min, the oven was opened to allow for natural cooling.
3.2.2 Results
Fig. 9 presents the temperature measurements. The red line represents the oven temperature (1), while the black line shows the STC. The fire test exposes the specimen to about 270% higher temperature than the laboratory oven after 10 min. A temperature difference of roughly 200 K was recorded between the oven (1) and the support temperatures (2) and (3) before the test stopped. (2) and (3) remained identical. The first 3 min show a steep rise for (1), followed by a nearly linear increase. The temperature curves of the supports and glass beam exhibit a delayed response, resulting in a 150 K difference between (1) and (2)/(3) after 30 min. After 10 min, (2) and (3) increased almost linearly until the test ended, with a peak support temperature of about 305 °C. The core temperature (4) remained much lower than the oven (330 K difference after 30 min) and the supports (150 K difference after 30 min).
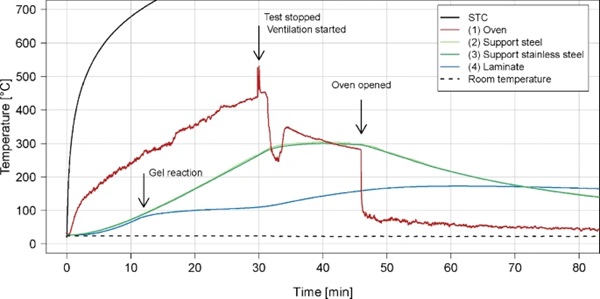
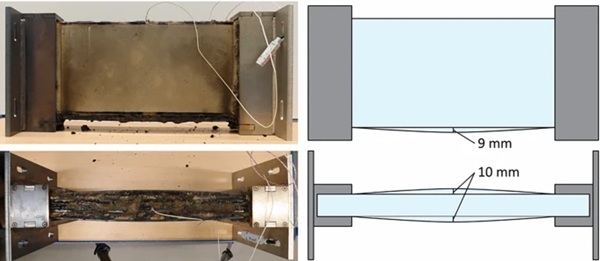
Fig. 10 shows the specimen after the test. No glass panes broke, but the gel expansion caused a maximum gap of 9 mm and 10 mm between the sacrificial layers and the laminated glass core. The gel foamed up white but did not burn to a black crust due to the intact sacrificial panes.
3.2.3 Discussion
The similarity of temperature curves (2) and (3) in Fig. 9 indicates a negligible impact of the steel type. Curve (4) suggests the gel foamed after approximately 12 min, flattening and leading to a core temperature of 110 °C at 440 °C oven temperature after 30 min. Regarding the increasing core temperature after the test stopped, it is assumed that due to inertia the heat from outside layers continued to be transferred to the core, which was at a lower temperature.
The measured 10 mm offset of the sacrificial panes corresponds to a gel expansion of approximately 300%, while the manufacturer states it can reach 600%. Full expansion requires breakage of the sacrificial panes. As the sacrificial layers were supported at the short edge only. The curvature at a span of 500 mm created a stress level of 45 N/mm²—well below strength of fully tempered glass. The intact sacrificial panes also hindered gel combustion, further reducing its cooling effect. Despite this, the gel kept the load-bearing element cooler than its ambient temperature (Fig. 9).
However, we recommend to observe temperature gradients in the glass close to the support structure closely as fracture might originate from this location as well.
For further tests, the design was retained and scaled to spans of up to 3 m.
3.2.4 Conclusion
In conclusion, the temperature development in the radiation oven at 36 K/min is significantly lower than in the fire furnace (100 K/min) during the first 5 min. After 30 min, the average heating rates are 14 K/min in the radiation oven and around 28 K/min in the fire furnace. Nevertheless, the temperature in the oven caused the gel to foam. Due to the lower heating rate, it is assumed that the foaming started later and caused less expansion than we expect it in a fire test. In addition, the measured data is relevant for a numerical simulation. The absence of glass fracture of the sacrificial panes needs to be confirmed in the large-scale fire test.
4 Fire tests
4.1 Specimens and set-up
The protection system's basic structure from the preliminary test (Sect. 3.2) was adapted for the fire tests. Fig. 11 shows the dimensions and structure. It should be noted that 70 mm support area remained unprotected within the stainless-steel bearing structure to prevent compression of the fire protection layer. A support length of 160 mm ensured a seamless transition from the support to the beam. Six thermocouples measured temperatures were positioned midway along the glass beam's length and height (Fig. 11):
- two thermocouples glued with Conlit® Fix adhesive on the sacrificial pane surface (Surface) and covered with small calcium silicate plates,
- two thermocouples embedded in the laminated glass (Core), and
- two thermocouples positioned 100 mm away from the specimen (Furnace).
The temperature measurements were verified through the calibration of the thermocouples before the test. The Conlit® Fix is an opaque adhesive and covered the thermocouples in combination with the calcium silicate plates at the glass surface from the radiation of the fire. Fig. 12b illustrates the setup, including furnace thermocouple positions. The mean temperature of OT1-6 was observed to maintain the furnace temperature within the required STC range according to EN 13501-2 (2016).
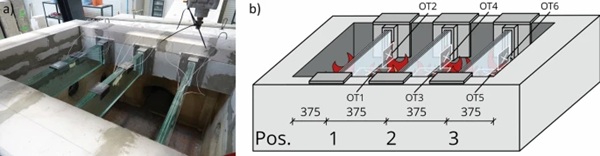
Fig. 12a shows the test setup. The glass beams were mounted in a fire test furnace so that the fire chamber could be flamed without the beams coming into direct contact with the flames. Metal–glass contact was avoided with EPDM blocking with 8 mm thickness. Three beams were tested per experiment in three fire tests. A pneumatic cylinder (force controlled) applied load at two points, enabling a four-point bending test in accordance with the literature. Displacement was measured at the cylinders via traverse path resulting in recording the displacement of the whole structure.
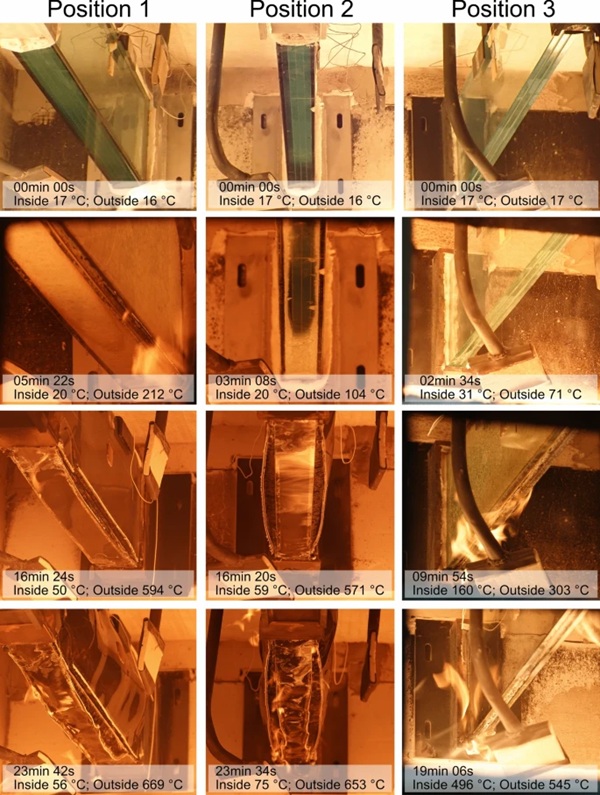
Of the nine tested specimens (Table 1), four had the novel protection system, while five served as references. The reference test specimens were first tested in positions 1 and 2 to enable a comparison between unprotected and protected specimens. The table shows the labels of the specimens (for example MM24_25p). MM24 is a label for the comparison with the literature, “2” defines the test run, “5” stands for five glass layers in the load-bearing element and “p” stands for “protected”. The table also lists the total load from the pneumatic cylinders and the glass composition of the load-bearing element. The mechanical load caused a bending stress of approximately 2.4 N/mm² per individual glass pane. Especially for beams in general, EN 13501-2 (2016) defines two failureodes—the maximum deflection Dmax [Eq. (1)] and the maximum deflection rate dDmax/dt. [Eq. (2)]. Exceeding one of the two specified limit values during the test means, the criterion for classification as R is no longer met. The elapsed time up to this point is then rounded down to the next lower fire resistance class.
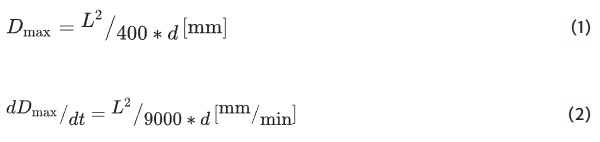
Table 1 Overview of the specimens, their glass composition in cross section, position in the tests and their labels - Full size table
with L span of the specimen [mm]. d height of the specimen [mm].
The tests were terminated after either the deflection limit was exceeded for all beams or after 40 min. It has to be mentioned that the test 1 had to be stopped prematurely. The glass panes of specimen MM24_13u broke instantly and causing the pneumatic cylinder to pierce the fire protection plates that closed the furnace opening. Due to the damaged closure of the furnace the test could not be continued. As a consequence of the premature termination of the test, it is not possible to analyse the deflection values for the test specimens MM24_15u and MM24_14u. However, the measured temperatures can be analysed.
4.2 Results
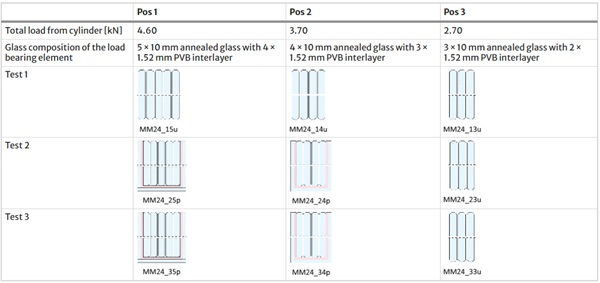
Fig. 13 documents different fire test stages, showing positions 1, 2, and 3 (see Fig. 12) along with core and surface temperatures. In positions 1 and 2, the fire protection gel reacted to the heat, foaming up and bending the sacrificial panes outwards after approximately 3 min (position 1 and 2, row 2). At approximately 8 min, the gel burned into a black crust (position 1 and 2, row 3), and at 15 min, the glass exceeded its transformation temperature and began to melt (position 1 and 2, row 3). Between 22 to 25 min, glass dripped down (position 1 and 2, row 4). Sacrificial panes bent outwards without breaking, again. As expected from the design of the fire-resistant beams, no hot materials (PVB interlayer or fire-resistant gel) were observed to drip down until the glass itself began to melt.
Position 3 shows an unprotected specimen. After approximately 3 min, the PVB interlayer started melting and burned as it dripped out (see Fig. 13, position 3, row 3). At approximately 10 min, no PVB was left in the specimen (position 3, row 4). After maximum 20 min, the unprotected beams failed and fell into the furnace.
Fig. 14 shows the results of the temperature measurements in the core for the five unprotected specimens as a function of time. Each temperature curve shows the mean value of the two embedded thermocouples (core). The temperature curves can be analysed up until the specimens broke. The temperature curves of the three-layer specimens (orange solid line) are in a range with a maximum difference of 70 K. The curve of the four-layer specimen (orange dashed line) shows a similar behaviour with a maximum difference of 141 K to the three-layer specimens. The temperature curve of the five-layer beam (orange dot-dash line) is flatter than the others with a maximum difference of 294 K to the solid lines.
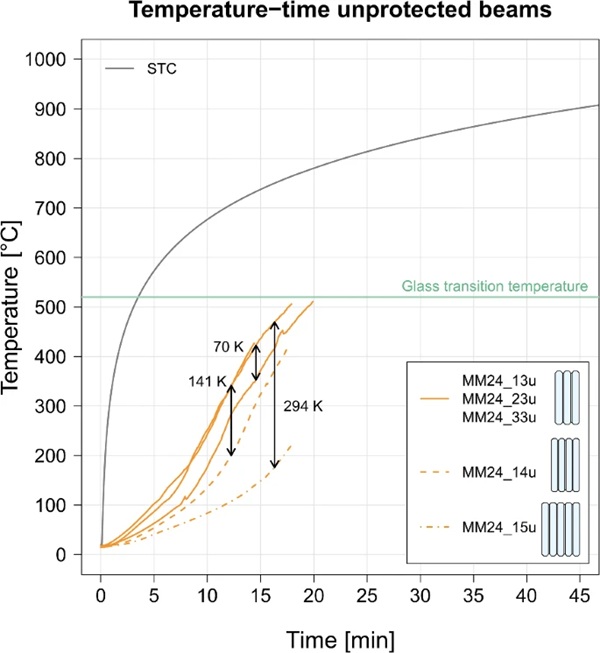
Fig. 15 presents temperature measurements as a function of time for the protected beams, with test runs 2 (red) and 3 (blue). Each specimen has three temperature curves: core (light), surface (normal), and furnace (dark). Each curve represents the mean value of the two measurement points. For the first 25 min, the core temperatures exhibited similar behaviour but then diverged, with a maximum difference of approximately 330 K. The core temperature of MM24_25p dropped after 25 min before rising again at the end. The highest core temperature recorded was approximately 400 °C after 40 min. Most specimens remained below 100 °C in the core for 30 min, despite furnace temperatures of 700 °C—850 °C. The furnace and surface temperatures demonstrate a high degree of similarity in their respective shapes, though surface temperatures were approximately 150 K lower. The maximum difference between core and surface temperatures was approximately 600 K.
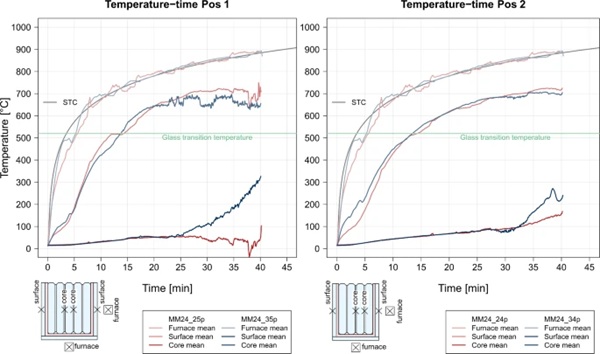
Fig. 16 shows deflection (left) and deflection rate (right) as a function of time for the unprotected (orange) and the protected (violet) beams. Only one protected beam (MM24_34p) exceeded maximum deflection after 38 min, while none exceeded maximum deflection rate. Unprotected beams failed on average after 17 min, whereas the protected beams lasted 11 min (223%) longer. MM23_34p (protected) lasted 19 min longer than MM24_23u (unprotected). Two out of three unprotected beams reached class R15, while the third failed early (14.5 min). All protected beams are categorised in class R30. Since the sacrificial panes melted and did not break, it must be assumed that they hindered the gel from expanding. So, there is potential in the performance of the gel to further extend fire resistance.
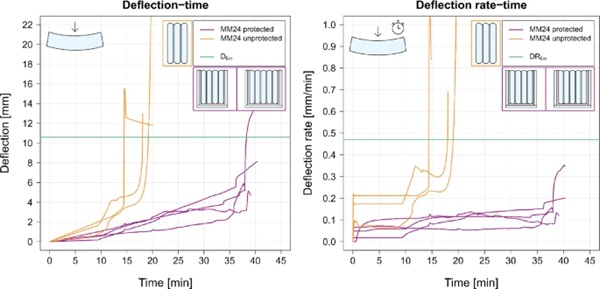
The deflection curves of the protected specimens show a slight slope of 0.05 mm/min–0.2 mm/min until 35 min of testing time. This can be read from both the slope of the curve of the deflection (Fig. 16 left) and the plateau of the deflection rate (Fig. 16 right). The curves of the unprotected specimens show a similar behaviour for the first 10 min–12 min. After that linear slope the deflection (Fig. 16 left) either increase until the maximum value or shows a sharp increase before exceeding the maximum value. These jumps are supposed to cause from breakage of single individual glass panes of the laminated glass. The linear slope of deflection of 0.05 mm/min–0.2 mm/min is supposed to be attributed to the blocking material EPDM preventing glass-metal contact. The supports were lined with EPDM blocking, which reached 8 mm thickness and exhibited a melting temperature at approximately 60 °C (TU Dresden DSC test). EPDM compression influenced measured deflection, meaning actual beam deflection may differ. However, the diagrams show the clear result that the protected specimens lasted longer than the unprotected ones.
4.3 Discussion
4.3.1 Prove of the methodology
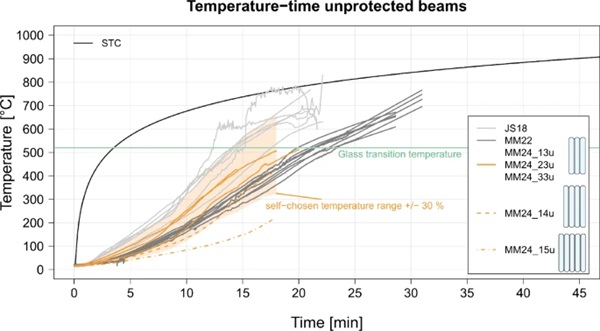
Fig. 17 shows the results of the unprotected specimen temperatures (MM24) in comparison with the results from Möckel et al. (2022b) (MM22) and Sturkenboom (2018) (JS18) (Fig. 5). For a better comparison between the test results and the literature a scatter range of ±30% of maximum and minimum core temperatures of the unprotected three-layer specimens of MM24 due to statistically low number of specimens was defined. The core temperatures of the three-layer specimens (Fig. 17, orange solid lines) fall within the scatter range (light orange area) of the results from the literature (light and dark grey lines). Fig. 17 (MM22 and JS18), exhibiting similar curve shapes despite differences in specimen height. Only a few outliers whose temperature curves lie well outside this range fall outside the grid. The fact that temperature curves remain within the scatter range confirms not only the comparability of the tests but also supports the conclusion of Möckel et al. (2022a) that specimen height exerts only negligible influence on the heating behaviour of glass beams.
The thicker glass composition (MM24_15u, Fig. 14, dot-dashed line) exhibited a markedly slower increase of the core temperature when compared with thinner laminates (MM24_13u, MM24_14u), leading to a difference of maximum 294 K after 17 min testing time. This observation directly confirms the finding of Möckel et al. (2022a) that increasing number of individual glass panes result in a slower heating of the element, given that the temperature must pass through a greater mass.
The results of the deflection were used to calculate the deflection rate. Fig. 18 shows the results of both the deflection (left) and the deflection rate (right) in dependence of testing time. In addition, the limit values of deflection and deflection rate of the different test series are shown in dashed lines (grey and orange). Table 2 shows the exact calculated limits for each test series including the time stamp and core temperature when the limit was reached.
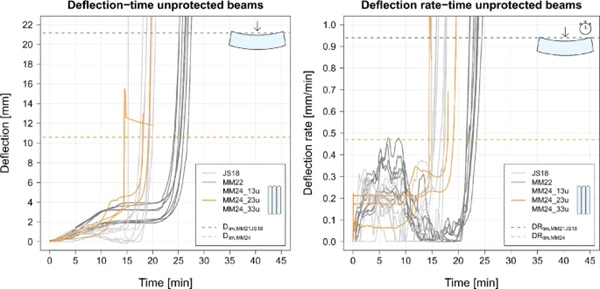
Table 2 Time and core temperature at Dlim and DRlim - Full size table
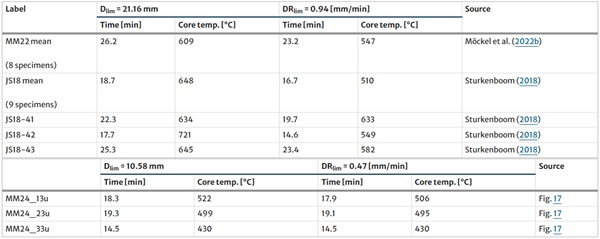
While such thermal responses appear to be generalisable across different configurations, the mechanical performance presents greater variability. The average failure times recorded for the unprotected specimens (17.2 min) closely aligned with the results of Sturkenboom (2018) (16.7 min), whereas Möckel et al. (2022b) reported longer resistance times of approximately 23.2 min (see Fig. 18 and Table 2). This indicates that, although thermal development can be consistently predicted, failure behaviour in terms of deflection and deflection rate remains strongly dependent on test setup and boundary conditions. These discrepancies highlight the continued necessity of extensive experimental validation in order to reliably classify load‑bearing glass beams with respect to fire resistance.
4.3.2 Impact of the fire protection layer
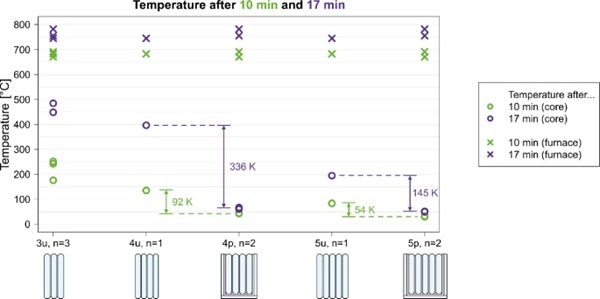
To assess the impact of the fire protection gel, temperatures, deflection, and deflection rate of unprotected and protected beams are compared. Fig. 19 shows the temperature data for the core and the furnace temperature after 10 min and 17 min. After 10 min, the unprotected beams reached core temperatures between 176 °C and 251 °C, while the protected beams remained at maximum 43 °C. Specimen MM24_15u reached 83 °C at 10 min and 194 °C at 15 min, while the protected beams remained at maximum 49 °C. That is a difference of 145 K. The difference is with 336 K higher for the specimen MM24_14u and the protected beams This demonstrates the insulating effect of the gel.
Figs. 20 and 21 present deflection and deflection rate as functions of measured temperatures, sorted by test positions in the furnace (see Fig. 12). The diagrams focus on the protected specimens, with green lines marking deflection and deflection rate limits. Results are shown for temperatures in furnace (light red/blue) and at sacrificial pane surface (red/blue), with mean values from two measurement points.
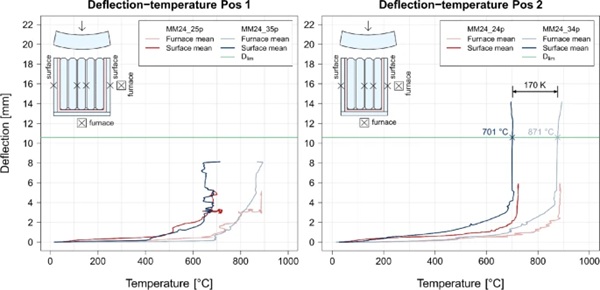
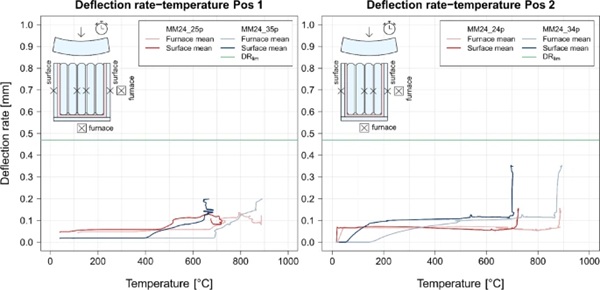
A 170 K difference is observed between furnace and surface temperature curves, as in Fig. 15. Potential causes might be: the furnace thermocouples, positioned 100 mm away, were exposed to convection and radiation by the direct flames, whereas the surface thermocouples, affixed to the glass, faced heat from only one side. Additionally, the opaque fireproof adhesive (Conlit® Fix by Rockwool) in combination with the calcium silicate plates used to attach the surface thermocouples may have blocked radiant heat transfer.
Only specimen MM24_34p exceeded the maximum deflection at temperatures of 701 °C (surface) and 871 °C (furnace), respectively, with a core temperature of 261 °C. The failure might result from high temperature gradients between the centre of the beam and the support area. In contrast, MM24_35p reached 394 °C in the core and stayed intact. All protected specimens showed similar behavior, with deflection increasing at nearly the same temperature and time, indicating definable fire resistance. However, four samples are insufficient for statistical evaluation.
5 Summary and conclusion
To enhance the fire resistance of glass beams, a fire protection layer comprising fire-retardant gel and sacrificial glass panes was applied. A total of nine specimens were subjected to fire resistance tests for up to 40 min. The glass beams with the fire protection layer showed a fire resistance increase of over 200% compared to reference specimens. Only one specimen failed, while the others remained intact. The sacrificial panes did not break as expected, suggesting that gel expansion was limited. Thus, even higher fire resistance might be possible if the panes break as intended.
The tests provided valuable insights for future experiments. The tests have shown that the height of the test specimen has no influence on the core's heating rate. However, increasing the number of individual glass panes in laminated glass increases the mass through which the temperature must pass, thereby slowing down the heating of the core. Additionally, the results from the literature could be reproduced using the presented test setup. Therefore, comparability with future tests is assumed.
The fire resistance of the glass beams was demonstrably increased, ensuring a defined resistance of 30 min. This enables classification as fire resistance class R30, in accordance with EN 13501-2 (2016). To further improve the impact of the fire-retardant gel, thicker layers exceeding 3 mm should be tested, as greater thickness could enhance fire resistance by increasing insulation. Furthermore, the influence of different types of gel from different manufacturers on fire resistance should be tested.
Since this type of enhanced glass beams had not been tested before, initial spans were limited to 920 mm, and mechanical loads were kept low (up to 4.7 kN, approximately 15% mechanical utilization of the beams). This approach ensured comparability with previous studies, maximizing insights from the complex and costly fire tests. Future research should examine larger spans and higher loads to better reflect real-life conditions.
The deformation measurement in these tests was influenced by errors from measuring by the traverse path. Most errors were eliminated, but in order to assess the fire resistance with the greatest accuracy, an alternative measurement method is recommended. Using fireproof, non-compressible materials at support areas could help isolate the specimen’s actual deformation.
6 Outlook
The tests show that load-bearing laminated safety glass beams can be classified in class R30 by integrating a fire protection system consisting of fire-retardant gel and sacrificial glass panes, enhancing fire resistance without limiting transparency. This approach addresses missing aspects of fire design in Eurocode 10 (CEN TS 19100-1 2021; CEN TS 19100-2 2021; CEN TS 19100-3 2021). Further tests with more specimens and parameters are needed for reliable results to form a data basis for the fire design of structural glass. Furthermore, special approvals for structural glass with a defined fire resistance can also be pursued to meet growing global demand. Large-scale fire tests (3000 mm spans) are planned at TU Dresden to demonstrate scalability.
Furthermore, future examinations should analyse how different types and thicknesses of gel influence the fire resistance of glass substrates. It is assumed that larger thicknesses of fire-retardant gel result in higher fire resistance. Considering deflection, deflection rate, and temperature data, a fire resistance class of R45 or R60 seems achievable by improving the structure and composition of the beam.
Additionally, it is recommended that the fire resistance of glass beams be examined through the implementation of a validated numerical model. Presented experimental results will contribute in this effort, for example providing deeper insights into heat and mechanical load interactions. This allows design optimizations and helps exclude unsuitable constructions before experimental testing. As a result, the number of fire tests and associated emissions can be reduced.