This paper was first presented at GPD 2025.
Link to the full GPD 2025 conference book: GPD_2025_ConferenceProceedingsBook.pdf

Authors: Jon Kimberlain a, Valerie Hayez b, Will Wholey c, Daniel Aggromito c
a. Dow Performance Silicones, USA
b. Dow Performance Silicones, Belgium
c. Arup USA
Abstract
Designing for blast performance for glazing units can be very complex. The test methods for evaluating performance include subjecting units to actual or simulated blast conditions, which occur rapidly on a very short time scale. Connecting laminated glass to a metal frame using structural silicone sealant creates a unique composite based on the use of a brittle plate with an elastic soft rubber to a ductile rigid metal. Glazed units were tested with a shock tube charged with various levels of explosive to record the damage development with various modes of failure of the material. Two test results were modeled to compare to the actual observations. Based on the outcome, techniques for effective modelling are discussed as well as future needs.
Article Information
- Published by Glass Performance Days, on behalf of the author(s)
- Published as part of the Glass Performance Days Conference Proceedings, June 2025
- Editors: Jan Belis, Christian Louter & Marko Mökkönen
- This work is licensed under a Creative Commons Attribution 4.0 International (CC BY 4.0) license.
- Copyright © 2025 with the author(s)
1. Introduction
Aesthetic desires to provide transparency in podium levels of buildings increase the potential use of glass in its construction. These lower levels of a building are most vulnerable for nearby blast events. Blast events can create extreme loads that damage the interior as well as project debris towards the exterior, creating significant danger to people and property alike. Laminated glass façades are commonly used in these building structures when concerned with the potential for a blast event. There have been standards developed for sizing the geometry of the structural silicone sealant when attaching laminated glass designed to withstand blast loading. For example, ASTM F2248, Standard “Practice for Specifying an Equivalent 3-Second Duration Design Loading for Blast Resistant Glazing Fabricated with Laminated Glass” recommends to design the structural sealant joints with a thickness of at least 5 mm and a width (bite) at least equal to or greater than 10 mm or the nominal thickness of the glass to which it adheres, but less than two times the nominal thickness of glass. It is, however, known that the joint geometry and material properties strongly influence the performance of bonded façades under various loads. Therefore, a numerical modelling approach is highly desirable to understand structural sealant joint performance under blast loading, which involves a combination of tension, compression and shear loading.
Silicone sealant performance was explored under blast loading through both numerical modelling and experimental testing. Glazing assemblies were fabricated and tested at a blast test facility using explosives charged in a shock tube. The first step was a comparative analysis completed between two test samples looking at observed behavior of the glass and silicone performance versus the predictive model. Next, a collaborative effort between authors improved the alignment of the modeled behavior of the glass to the experimentally observed behavior. The aim of these studies is to provide a roadmap for robust modeling practices to inform design.
2. Blast Test for Laminated Glass Facades
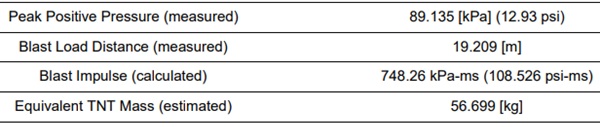
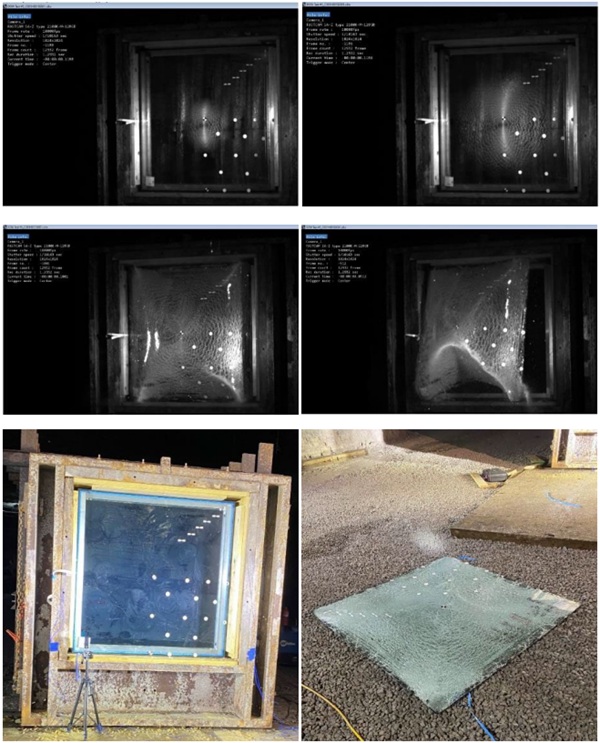
The blast tests for the silicone bonded laminated glass façades were performed at University of Kentucky underground test laboratory, as shown in Figure 1. The silicone sealant joint was prepared sin a temperature and humidity-controlled lab by bonding laminated glass onto welded metal frames of either steel or aluminum. Then, the silicone bonded laminated glass façades were assembled onto a shock tube for the blast test. The silicone structural bite of the test samples was varied to understand potential influence of bite dimensions on performance. Glass thickness was a nominal 6.35 mm heat strengthened (HS) by 2.28 mm polyvinyl-butyral (PVB) by 6.35 mm HS laminate. Explosives were charged into the interior of the shock tube and positioned a specific distance from the glazing assemblies to control the peak pressure and impulse delivered to the glazing. The blast loadings for the two shots described in this paper are summarized in Table 1.
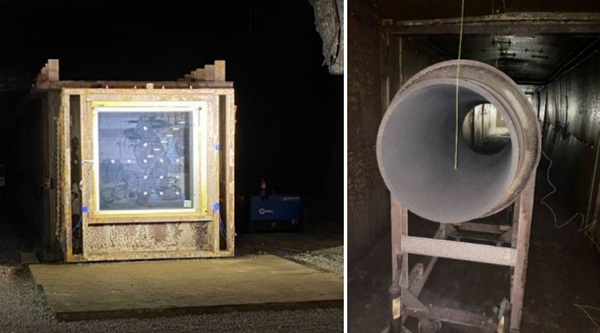
Table 1: Summary of Material and Properties Used in Blast Test.
The material properties for the laminated glass were estimated from published literature on laminated glass blast tests that included modeling. Typical material properties for Glass and PVB laminate layer are summarized in Tables 2-4 (Aggromito et al (2021), Aggromito et al (2022)).
Table 2: Glass Properties of the Laminated Glass.
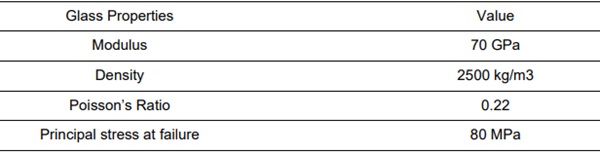
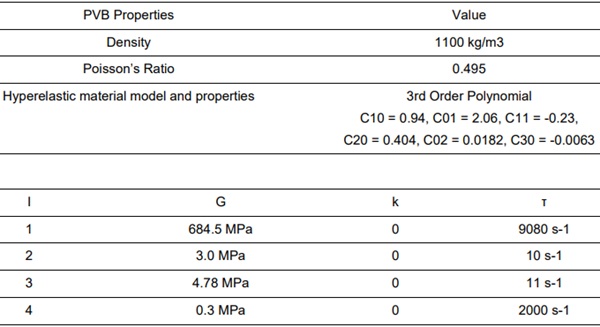
Table 3: PVB Properties in the Laminated Glass.
The structural sealant tested in this blast test is a two-part silicone sealant, and its simple tension, planar tension, and biaxial tension property measurement are shown in Figure 2. The data was used to determine the hyperelastic material model, Ogden, at quasi-static strain rates. The material model was selected based on the relative accuracy to stress strain results of a tensile adhesion joint at a similar strain rate.
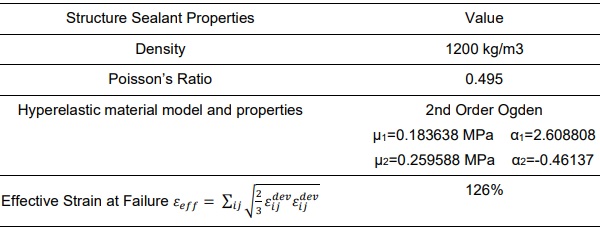
For failure criteria of the sealant, two strain components were evaluated. Historically, a maximum principle strain has been shown to be a good predictor for sealant behavior in glazing applications for windloads or seismic. Maximum principle strain focuses on the tensile behavior of a sealant. However, in blast simulations, the models became unstable after reaching the point of failure. Maximum effective strain accounts for the failure behavior in tension, shear and compression and was found to create a stable model past the point of failure for the sealant.
Its fitted Hyperelastic material properties are summarized in Tables 5.
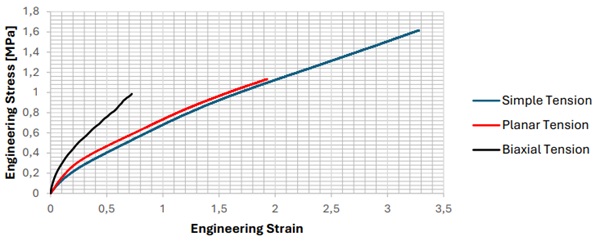
Table 5: Material Properties and Hyperelastic Model for Structural Sealant
To better incorporate the impact of strain rate on sealant behavior in the modelling exercise, the stress relaxation behavior of the sealant was also tested. A dogbone or dumbbell test specimen was used, see Figure 3, to develop a Prony series coefficient. The initial stress relaxation testing was intended to be the initial range of behavior of the sealant.
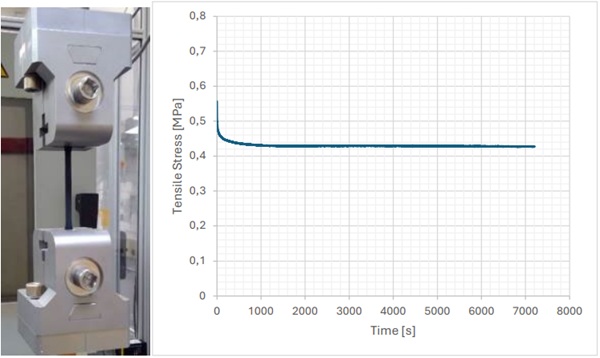
In addition to quasistatic testing, dumbbell test specimens were also tested at higher strain rates expected to be in domain that a sealant could experience in blast events. The data was used to optimize and refine the Prony series coefficients for use in the blast models.
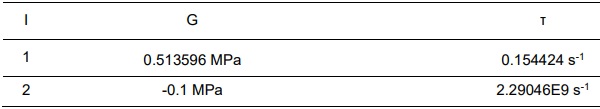
Figure 4 below shows the process used to refine the Prony series coefficient utilizing data from high speed tensile adhesion joint testing and an stress relaxation for the sealant. Table 6 summarizes the Prony series parameters used in the model.
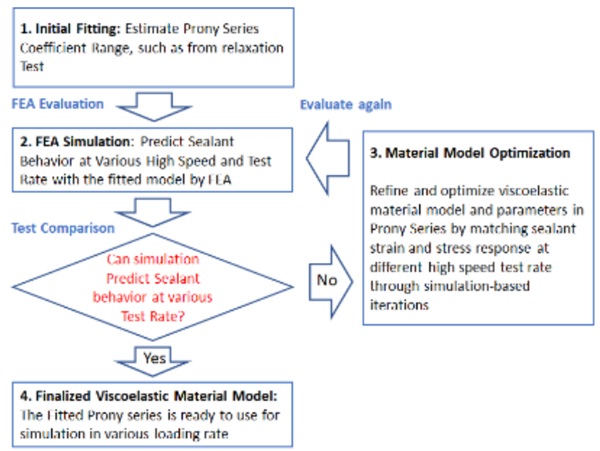
Table 6: Prony Series Parameter for the Structural Sealant.
3. Development of a Blast Model and Experimental Comparison with Case 1
A finite element analysis (FEA) model has been developed to predict laminated glass and silicone sealant performance under blast loading. The FEA calculation was implemented in a commercially available FEA software, LS-DYNA. The Case 1 simulation is shown in Figure 5, where a 1.219 m x 1.829 m laminated glass is bonded to a rigid metal frame through a 6.35 mm (thickness) x 12.7 mm (width) structrual sealant.
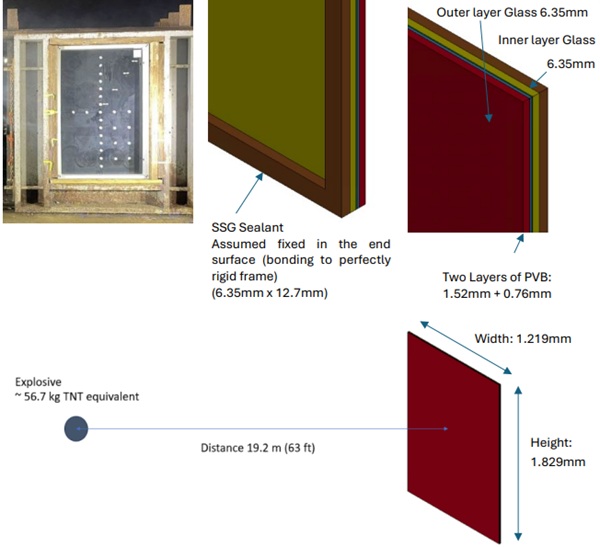
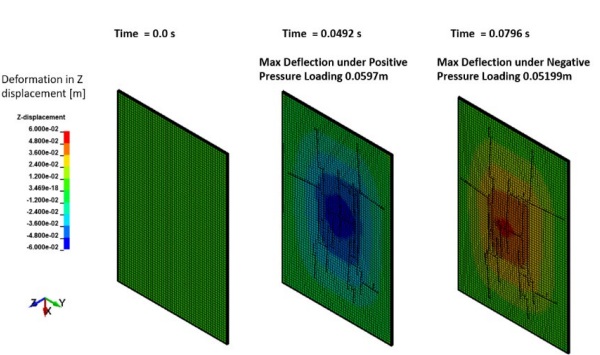
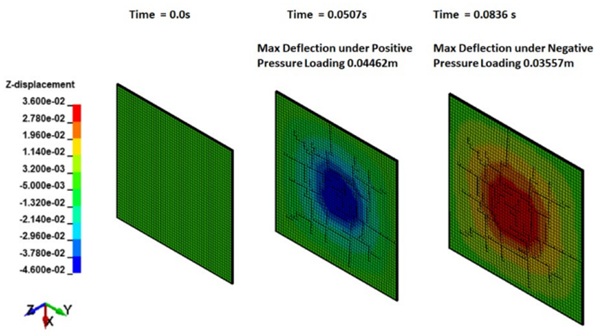
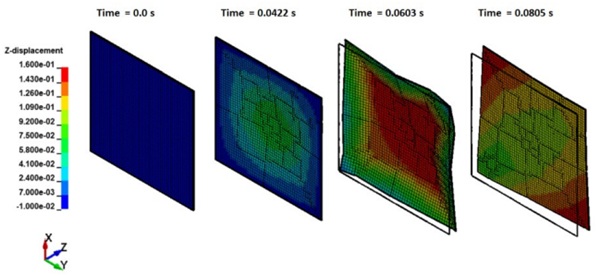
In the Case 1 blast analysis, 56.7 kg TNT equivalent explosive is ignited at 19.2 m distance away from the outer layer of the laminated glass. As shown in Figure 6, the laminated glass will reach a maximum inward deflection of 0.0597 m after 0.0492 s of explosion under the positive pressure wave. Then, the laminated glass deflects outward to 0.05199 m due to the negative pressure wave.
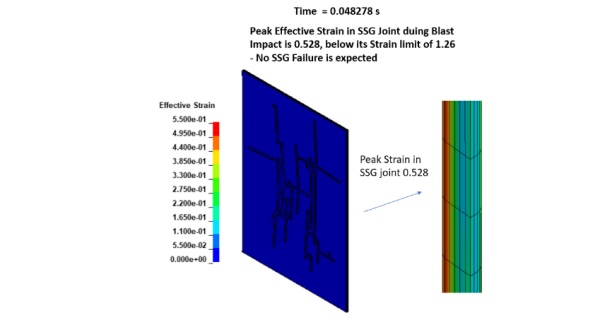
Although both plies of glass crack in the laminate, no structural sealant failure is observed in the calculation. The FEA results predict the peak effective strain in the structural sealant to be 0.528 during the blast, which is less than the effective strain limit (1.26) of the sealant, as shown in Figure 7. Hence, only glass laminate will fragment in the Case 1 blast loading case, the structural sealant is expected to hold the glass laminate onto the metal frame after the blast loading.
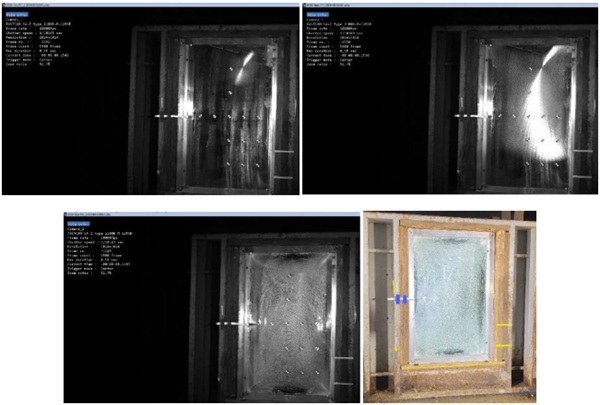
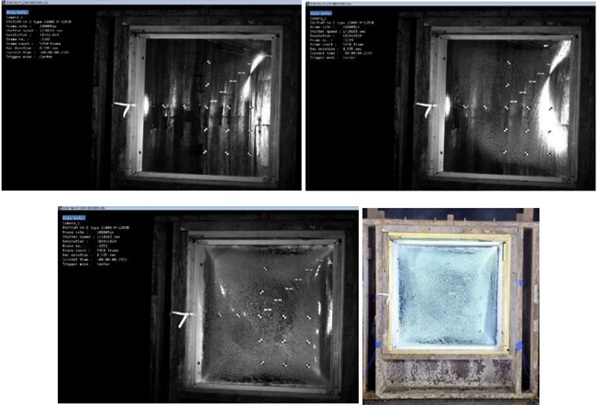
A blast test has been performed for the Case 1 simulation condition, as shown in Figure 8. During this blast test, the glass lite fragmented but was still retained on the frame by the silicone sealant without evidence of sealant rupture. This demonstrates that the FEA model for the blast test is reasonably accurate for predicting glass laminate and silicone sealant performance under blast loading.
4. Blast Test and Analysis for Glass Bonding Configuration Case 2
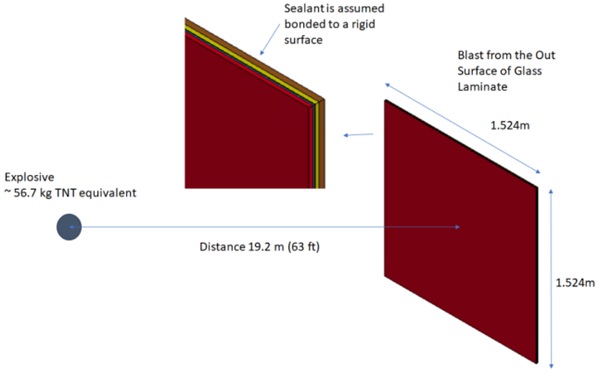
With the FEA model developed for the blast test, different glass bonding conditions have been evaluated by both numerical simulation and blast test. As shown in Figure 9, the Case 2 study evaluated the performance of a 1.524 m x 1.524 m laminate glass under same peak postive pressure (89.135 kPa) and blast load distance (19.209 m) as in Case 1. The silicone sealant joint dimensions are the same in Case 1 and Case 2 at 6.35 mm x 12.7 mm. The main difference between Case 2 and Case 1 is that Case 2 has a 4% larger surface area, and it has equal edge lengths for all sides.
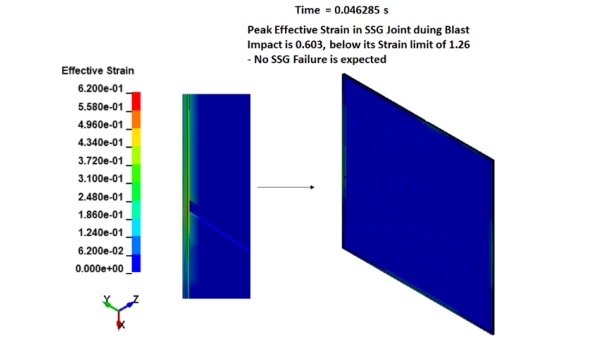
Modeling of the Case 2 laminate glass blast test predicted that the laminated glass will crack under the blast loading, but the silicone sealant will not fail, as shown in Figure 10. Modeling indicated that slightly higher peak effective strain (0.603) will develop in the sealant joint in Case 2 compared to Case 1 (0.528) due to its larger surface area, as shown in Figure 11. As this peak effective strain in the sealant joint is lower than its strain limit of 1.26, the silicone sealant will not fail.
5. Blast Test and Analysis for Glass Bonding Configuration Case 3
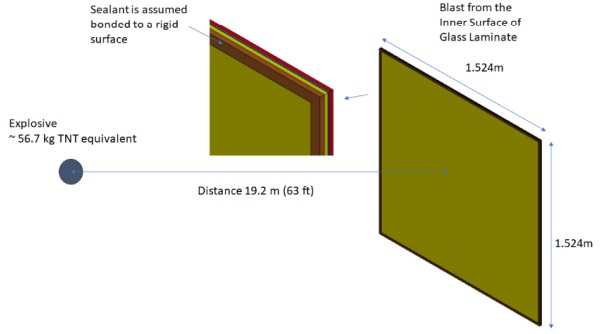
The Case 3 glass laminate features the same sealant joint design as Case 2, but it is different from Case 2 in that the Blast loading in Case 3 occurs from the inner surface of the glass laminate, as shown in Figure 13. From the FEA simulation, it is predicted that the glass laminate will be blown away under the blast due to silicone sealant failure, as shown in Figure 14. This indicates that the silicone sealant location is critical in the façade design under blast loading. The Case 3 glass laminate layout was then tested by applying the same peak positive pressure (89.135 kPa) and standoff distance (19.209 m) as Case 1 and Case 2 towards the inner surface of the glass laminate. It was confirmed from the test that the silicone sealant failed in the test (see Figure 15), as predicted by the FEA model.
6. Improving the Glass Breakage Model
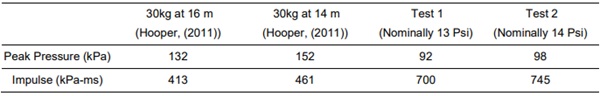
Utilising the properties detailed above in Table 4 and Table 5 and incorporating the cohesion properties from Aggromito et al. (2022) the same approach for modelling laminated glass was assessed against the two tests completed in the experimental program at the University of Kentucky. Table 7 provides a comparison between the peak pressure and impulse from Aggromito et al. (2022) and the measured loads and impulse from the testing at the University of Kentucky. Two load conditions were chosen as the one at 13 psi did not exhibit glass breakage, whereas the load approaching 14 psi resulted in glass fracture. Loads for analysis were generated via curve fitting of an exponential decay curve to the peak pressure, impulse, and duration observed in the experiments, including the negative phase of the blast.
Table 7: Summary of Blast Tests.
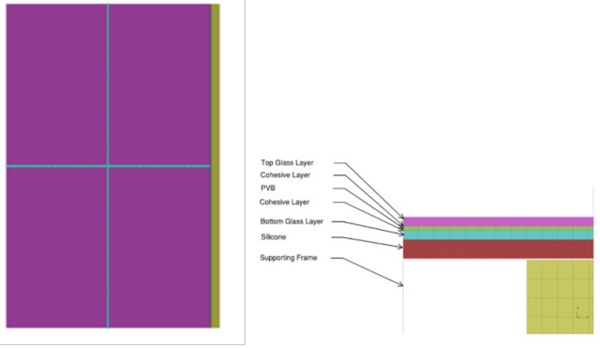
Expanding on the modeling approach (Figure 16) detailed in the sections above, the Glass layer in this section is modelled using T-shells and MAT_280 (MAT_280 is not developed for solid elements). MAT_280 was chosen for this study to try to better capture the crack patterns witnessed in the experiment. In the development of cracks for MAT_280, a crack occurs perpendicular to the maximum principal stress direction as soon as tensile failure occurs. Table 8 provides the material properties input to represent the glass in the initial assessments and are based on the values provided in Aggromito et al. (2022). The material inputs for the silicone are as detailed in Table 5 above.
Table 8: Model Parameters for Glass.

7. Results
Cracking was witnessed in the simulation for both pressure and impulse loadings when using the glass material properties in Table 8. As the strength of glass varies with strain rate, the scale factor for tensile strength (FTSCL) was varied until cracking was witnessed for a pressure load of 14 psi and cracking was not witnessed for a pressure loading of 13 psi, consistent with the test observations. Consequently, for this glass type and particular strain rate, an FTSCL of 2.705 was required to correlate to the experiment for cracking to occur (Figure 17).
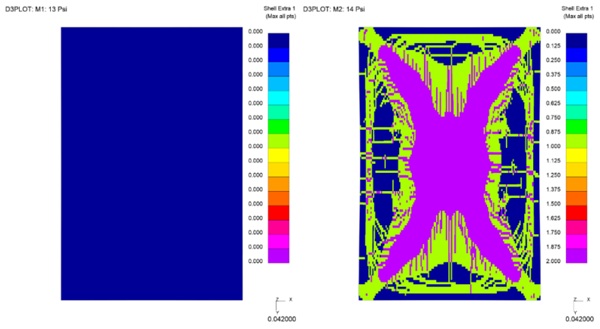
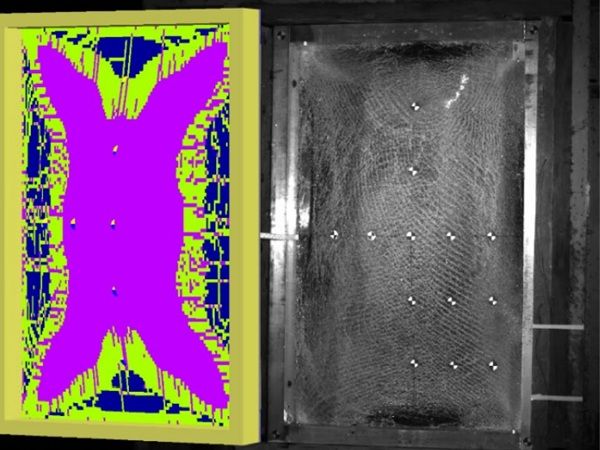
Figure 18 presents a comparison of the displacement of the pane for the analysis and the experiment for a loading of 14 psi, with the simulation results visually overlaid on stills from the high-speed video recording of the test. As is demonstrated, the displacements correlate well between the analysis and the experiment throughout the positive excursion and rebound of the glass.
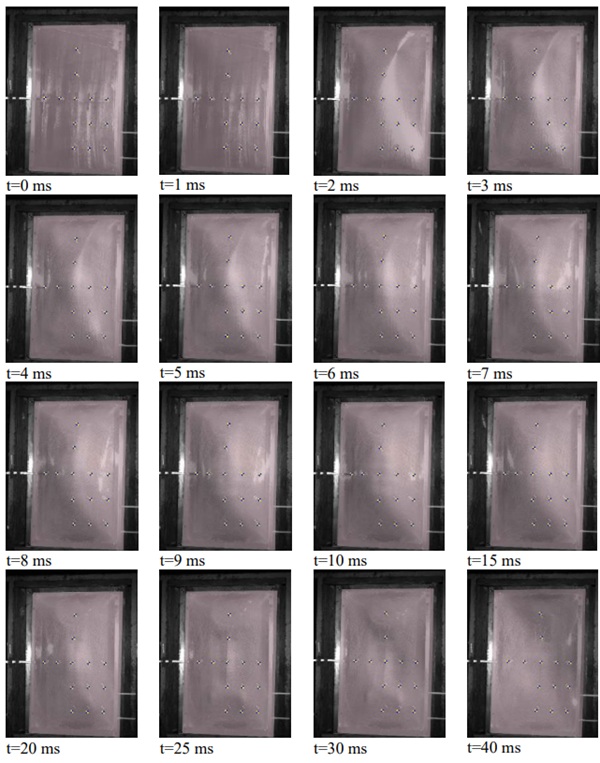
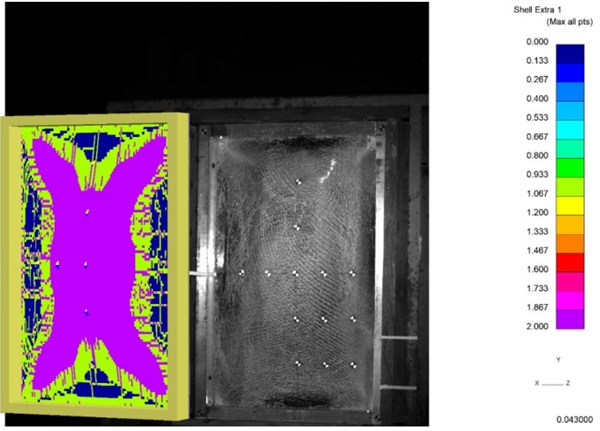
Figure 19 presents a comparison of the crack pattern between the analysis and the experiment. While the crack patterns do not line up completely between the simulation and the experiment, there is generally good correlation between crack pattern and density in the simulated and observed results. Around the edges of the pane, the simulation predicts slightly less cracking than the experiment; however, as the crack propagates from the corners towards the centre, a similar cracking pattern is witnessed between the simulation and experiment.
8. Conclusions
From this study, it was confirmed that the laminate glass and silicone sealant performance under the blast loading can be accurately predicted by an FEA model. Peak effective strain is a critical design parameter for silicone performance modelling under blast loading.
With the same sealant joint design, the same glass laminate stack design, larger glass surface area will cause a high strain into the sealant joint when total length of the sealant joint bite is the same.
With identical sealant joint design, glass laminate design and surface area, it is found that the direction of the blast loading is critical in affecting the failure of the sealant joint. When a blast is applied from the outer surface of the glass, sealant is mostly under compression loading during the peak positive pressure wave, and the sealant less likely to fail. However, if the silicone sealant is applied on the same side of the glass where blast loading is applied, it is mostly undertaking tension during the initial blast wave, and it is more likely to fail and result in the whole laminate glass unit being detached from the building structure.
Future efforts aim to use the validated materials model to run parametric analysis with Finite Element Analysis to understand the influence of design parameters (such as silicone and glass geometry) on the behaviour of the sealant. The outcome of the study hopes to be used to develop simplified joint design equations without the need for FEA, even if only for improved initial joint geometry for beginning design concepts.
References
Aggromito, D., Tartasky, M., Wholey, W., Farley, J., Klimenko, J., Pascoe, L.: Modelling laminated glass in LSDYNA under extreme loading conditions. In: 13th European LS-Dyna Conference, Ulm Germany (2021)
Aggromito, D., Pascoe, L., Klimenko, J., Farley, J., Tatarsky, M., Wholey, W. 2022,
Simulation of PVB-glass adhesion and its influence on the blast protection properties of laminated safety glass.
International Journal of Impact Engineering, Vol. 170
Descamps, P., Durbecq, S., Hayez, V., Chabih, M., Van Wassenhove, G.: Dimensioning silicone joints used in bomb blast resistant facade systems. In: Proceedings of Challenging Glass 6, Conference on architectural and structural applications of glass, Belis Bos & Louter, Ghent University (2018)
Hooper P. PhD Thesis. Imperial College London; 2011
Silicone structural glazing under blast loading, Valérie Hayez, Jon Kimberlain, Jie Feng, Sigurd Sitte, Mark Mirgon, Glass Struct. Eng, 2022