
This paper was first presented at GPD 2025.
Link to the full GPD 2025 conference book: GPD_2025_ConferenceProceedingsBook.pdf

Authors: Louis Moreau a, Adrian Betanzos b, Guillermo Casas Gonzalez c
a. MOGLEX Corporation, Canada
b. VIA, USA
c. Independent mathematician, Barcelona, Spain
Abstract
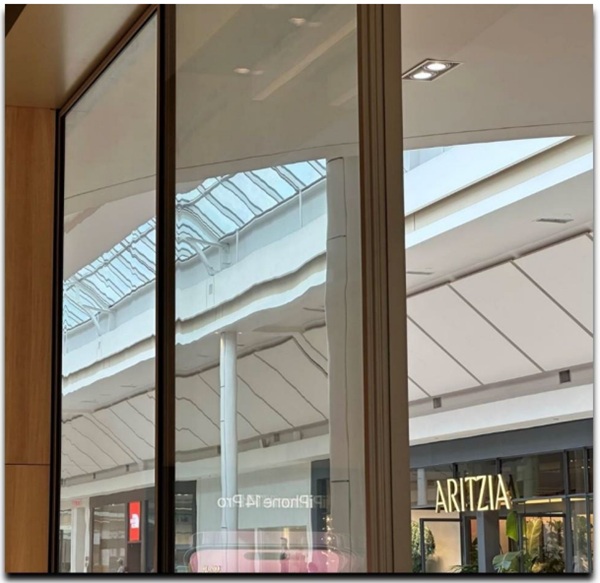
In the early stages of his consultancy career, a team member frequently encountered dissatisfaction among building owners and architects regarding visual distortion through architectural glazing. This type of optical distortion—commonly referred to as “see-through distortion”—can be highly disruptive in critical environments, such as observation decks and air traffic control towers. It may also detract from visual comfort and aesthetic quality in premium commercial, residential, and open-plan office settings. Despite its impact, current architectural glass standards do not adequately address or quantify this phenomenon. This study reviews international standards and practices related to see-through distortion across the architectural, automotive, and aeronautical sectors. We examine how existing standards can be leveraged to evaluate the optical quality of large-format glazing during manufacturing. Our findings, benchmarked against two recognized standards, demonstrate that current measurement techniques are complex and largely unsuitable for in situ assessments. Through this work, we aim to evaluate the market need for a portable device capable of accurately quantifying see-through distortion. Additionally, we propose the development of a standardized methodology to assess this optical imperfection, with the goal of advancing quality control practices within the architectural glass industry.
Article Information
- Published by Glass Performance Days, on behalf of the author(s)
- Published as part of the Glass Performance Days Conference Proceedings, June 2025
- Editors: Jan Belis, Christian Louter & Marko Mökkönen
- This work is licensed under a Creative Commons Attribution 4.0 International (CC BY 4.0) license.
- Copyright © 2025 with the author(s)
1. What happens when light travels through glass
Two phenomena can occur when light traverses from one transparent medium to another. The difference in refraction indexes (change in the speed of light) of each medium deviates the light rays. If the medium has parallel faces, the displacement will only be lateral. If the medium faces are not parallel, then there will be an angular transposition.
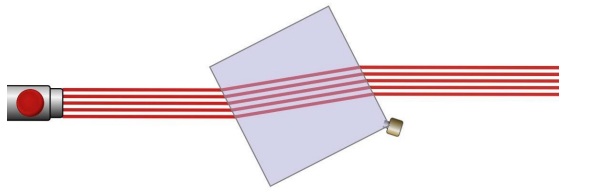
1.1. Lateral Displacement:
The shift in location of an image is caused by the refraction of light through a transparent material with parallel surfaces. The light rays are bent equally and oppositely, resulting in a shift in the image's position without changing its angle. So even if we move our eyes, the object we look at is not stretched or distorted, its image simply appears displaced from its original position. In a window or a windshield, the material is thin, so this displacement is small and does not significantly affect the accuracy of viewing objects at a distance. To better understand, imagine looking at fish in a clear pond. Here the medium is thicker, and the fish appears shifted from its actual position due to the water's refraction, but the shift is consistent regardless of the distance and the fish is not distorted.
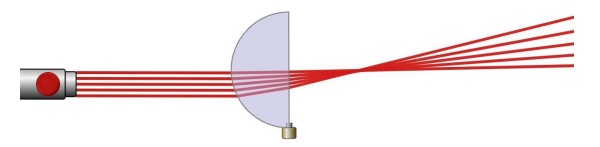
1.2. Angular Displacement:
When light passes through a transparent material with non-parallel surfaces, the unequal refraction angles cause a net angular change in the path of the light ray. Thus, the image appears displaced at an angle from its original position, and the error becomes more significant with an increase in distance. This type of displacement causes objects to appear in incorrect locations and distorts their shape.
Imagine looking through a curved glass. The image of an object seen through the glass appears at a different angle, and the error increases with distance, making it difficult to accurately determine the object's true location.
2. On site examples

3. Architectural glass distortion
Currently, the architectural glass industry focuses on distortion in reflection. This only impacts the outside view of buildings. Worldwide, there are hundreds of tempering ovens’ exit scanners to control heat-treated glass roller waves and edge kinks. There are standards on how to measure the deviation by mechanical flat gauges or optical means (ASTM C1651). On large projects, specifications clearly define maximum deviation, often in millidiopters where skilled professionals are aware of this phenomenon. They know the acceptable limits and have the industrial control tools to obtain numerical values for the quality level they envision.
Unfortunately, reflective distortion has little influence on see-through distortion.
In today’s architectural world, distortion in transmission is neither specified nor controlled.
Some of the factors that can cause see-through distortion are:
- Lamination
- Float glass quality
- Optical path interaction of different layers
- Localized polishing of the faces to remove scratches, pits or imperfections
Distortion in transmission can only be reliably detected through final product inspection, and currently, only a limited number of test methods are available. These methods will be detailed in the following sections.
4. Existing standards and their methodology
4.1. Architectural standards
ASTM C1036-25 Standard Specification for Flat Glass
Description
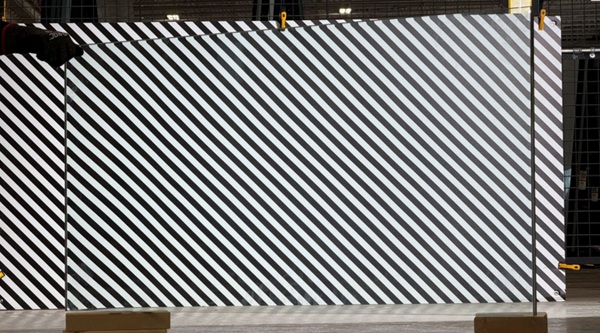
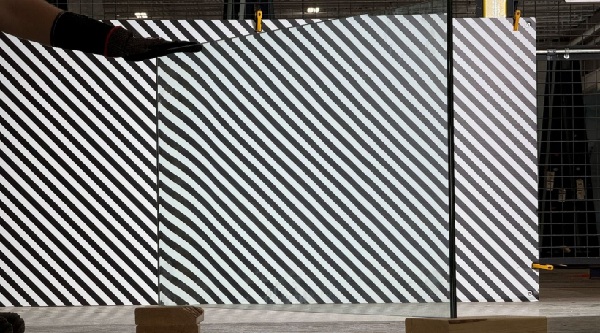
This specification covers the requirements for monolithic flat glass. The test methods paragraph 6.1.2 describes a method that was included in the Pilkington float licence quality package. It uses a zebra board (black-and-white diagonal stripes at 45°) placed 9 m away from the observer. The specimen is positioned midway, vertically on a rotating support. The operator rotates the specimen clockwise from zero until it reaches the angle at which the distortion appears and reports that angle as the vision interference angle. A similar method is described in European standard EN 572-2, paragraph 5.2.1 / 5.3.1.
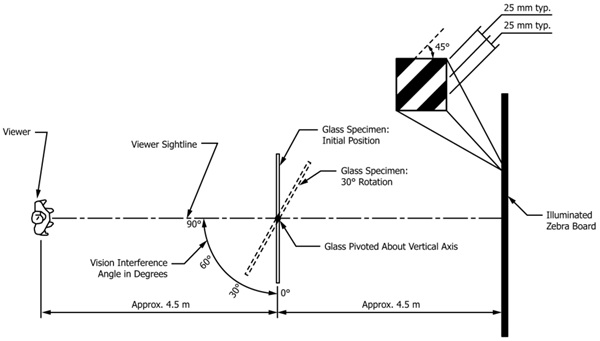
Positive—This method is relatively easy to implement, as it provides a numerical value for comparing vision interference angles. It encompasses all types of distortions, from fine draw lines to large lamination deflections. The standard sets interference angle ranges for the different float qualities.
Negative - safely holding and rotating a large specimen can be challenging. It is inherently a slow process where glass needs to be manipulated twice and is hardly compatible with production lines for a 100% inspection. To inspect the whole area, the zebra board must be twice the size of the specimen. The evaluation, done with human eyes, is subject to interpretation and not very precise.
C1652 – 21 Standard Test Method for Measuring Optical Distortion in Flat Glass Products Using Digital Photography of Grids
This test method uses a digital camera to capture a reflected or a transmitted image of a precise grid. It quantifies the distortion by measuring the change in the spacing between the lines. It is principally used to quantify roller waves in reflection but it is also suitable for distortion in transmission.
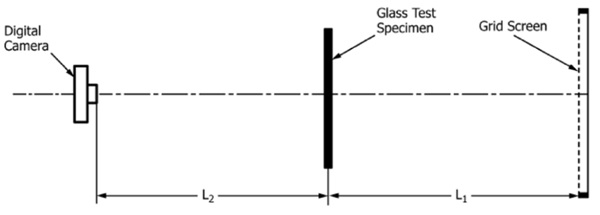
Appendix X1 explains how to calculate optical distortion by comparing two images of a grid reference background with and without the distorting piece. The key formula in the standard is X1.6, which is based on idealizing the local specimen deformations as a spherical lens. The optical distortion (D) is calculated as:

where the various parameters are defined as follows:
- Optical Distortion (D): A measure of how much the glass surface bends or distorts transmitted¹ images. It can be understood as the optical power of a lens representing the portion of the deformed glass affecting the measurement of the spacing variation on the grid.
- Grid Spacing (p): The distance between lines in the grid pattern.
- Radius of Curvature (R): Radius of curvature of a spherical lens that approximates the deformations on the glass as inferred by the observed distortion.
- Change in Grid Spacing (∆p): The difference between the undistorted spacing and the distorted spacing.
- Distance (L; L1 in Fig. 6): The distance between the specimen and the grid screen.
- Optical distortion is thus related to the curvature of the glass surfaces (the curvature of a sphere of radius R is its reciprocal: 1/R). The curvature is calculated from the changes in grid spacing (∆p) obtained by comparing the images obtained with and without the specimen in place, and the distance (L).
¹ A modification of the setup in Fig. 6 can be used to measure distortion in reflection in an analogous way.
Since the variables in this formula are ratios of identical units, you can measure them with a ruler on a printed photograph, or, if you’re using a digital camera, as simply as just counting pixels.
When L is measured in metres, D is expressed in diopters (1/m). Given the ranges of the normally observed distortions in architectural class, it is commonly more convenient to use millidiopters (mDp), i.e., one thousandth of a Dp, to measure distortion.
Using a grid allows you to find vertical and horizontal distortions, which, in our opinion, are less intuitive when considered separately. The analysis software we used compares each grid square area, allowing us to find the magnifying power of each grid node. The software also determines the original grid spacing (p) by averaging all squares. For more precise measurements, it can also use a picture of the grid without specimen as original grid spacing (p).
Positive - this method is also relatively easy to set up, and it provides an absolute numerical value in millidiopter (mDp). Depending on the grid pitch, it can encompass all types of distortions, from fine draw lines to large lamination deflections.
Using a moving conveyor system, a very fine grid and folding mirror, this could be integrated into an online inspection system, but no company offers this yet.
Negative - To inspect the whole area of the specimen, the grid screen must be at least twice its size. This makes on-site measurements challenging.
4.2. Automotive Standards
This report presents three standards that address the optical quality of automotive windshields:
- ECE/324 regulation 43
- ISO 3538
- ANSI/SAE Z26.1
All three standards essentially employ the same offline methods to assess optical quality: dot projection to evaluate distortion and red dot displacement to measure double imaging.. We will refer to the ECE/324 R43 to describe the methodologies, as this United Nations document is freely available online.
ECE/324 Regulation 43
This uniform provision is used for all safety aspects of glazing materials and their installation on vehicles. It presents two optical tests for windscreens: optical distortion and secondary-image separation. It was adopted by 41 countries in Europe, Asia, the UK and Russia but not by the United States nor Canada.
Optical Distortion Test
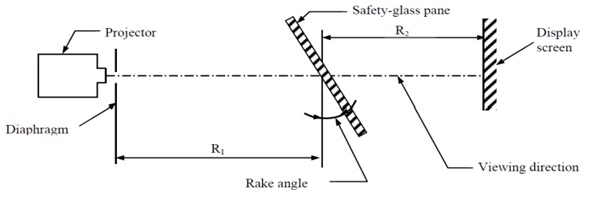
The windscreen is placed midway of an 8m optical path. An image of calibrated dots is projected through the windscreen raked at the car’s installation angle. The dot images are measured on the display screen using a range “donut” or quick assessment template.
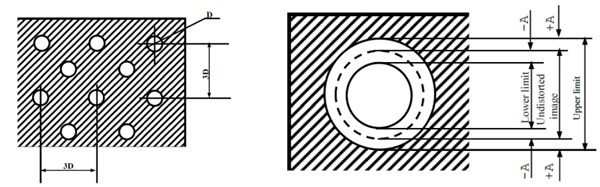
Secondary Image Separation Using Illuminated Targets
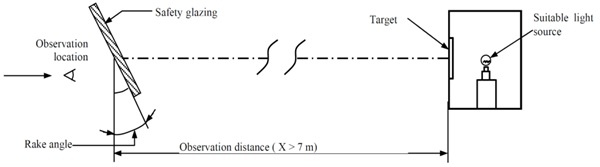
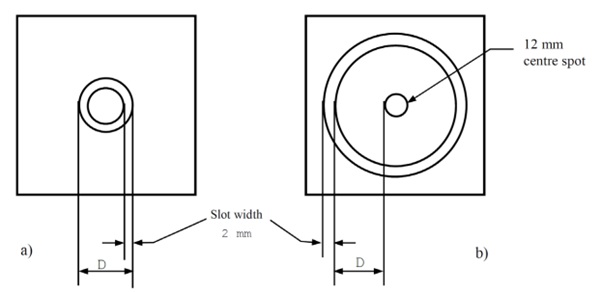
In Fig. 10, D = X tan ɳ were ɳ is the maximum allowable deviation and X the distance between glass and target. For cars, the maximum deviation ɳ is 15’ of arc in the main vision zone. This is a go/no-go test. Using target a) the ring and secondary image ring should always touch. Using target b) the secondary spot should be within the illuminated ring.
Secondary Image Separation Using the Collimation-Telescope Test
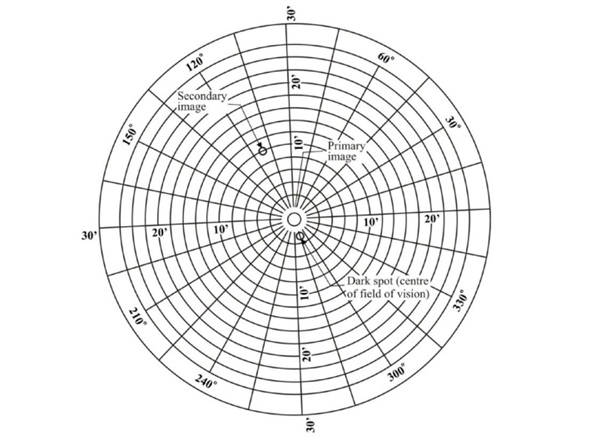
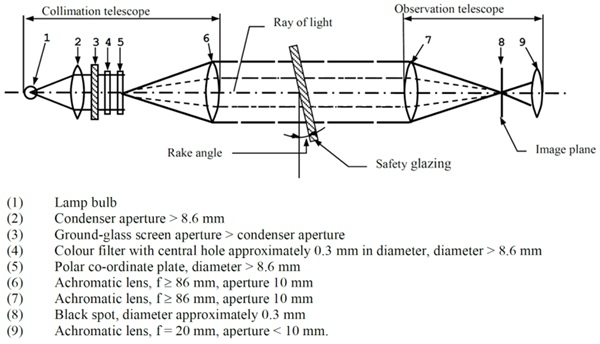
The collimation telescope forms at infinity the image of a polar co-ordinate system with a bright point at its centre.
In the focal plane of the observation telescope, a small opaque spot with a diameter slightly larger than the projected bright point is placed on the optical axis, thus obscuring the bright point.
When a windscreen which exhibits a secondary image is placed between the telescope and the collimator, a second, less bright point appears at a certain distance from the centre of the polar coordinate system. The secondary-image separation can be read out as the distance between the points seen through the observation telescope (see Fig. 12). (The distance between the dark spot and the bright point at the centre of the polar coordinate system-represents the optical deviation).
Automotive Optical Test Methods Summary
Positive: These decades-old test methods have proven effective in maintaining decent optical quality in automotive windshields. Although the set limits are high, they motivated OEM manufacturers to control their production and improve their process. They also give final users recourse if flagrant distortion is present in their windshields.
Negative – These methods require apparatus like projectors, collimation telescopes and large dark rooms. They are limited to punctual measurements that need to be repeated on the whole surface to create a map. They also only provide good/bad results, which makes it hard to see how process optimization can improve the overall optical quality.
These limitations have enticed scanner manufacturers like ISRA, SYNERGX and Glasstech to develop high-speed scanners providing colour mapping of windshields using horizontal and vertical distortion values in mDp. There are no national standards covering those equipment, but their output values must be correlated to international standards.
In addition, individual manufacturers have published their own standards - for example, Volkswagen AG TL957 - Silicate Glass for Vehicle Windows (PV 2501 - Vehicle Window Glass; Optics) – to monitor the performance of their suppliers.
4.3. Aeronautical Standards
These ASTM standards cover the optical quality of aeronautical parts. They are intended to be used on windscreens and cabin windows.
ASTM F733 - Standard Practice for Optical Distortion and Deviation of Transparent Parts Using the Double-Exposure Method:
Focus: Measures both optical distortion and deviation, in other words lateral and angular displacements.
This method employs a photographic double-exposure technique using a grid board and it is best suited for flat or nearly flat transparent components. Two exposures are captured: one with the transparent part in position and one without it. By comparing the grid lines in the resulting images, the optical distortion and deviation introduced by the transparent element can be quantitatively determined.
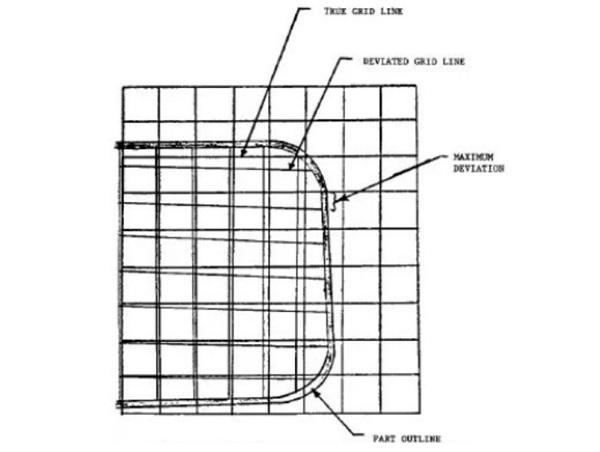
Output: By measuring the maximum deviation and applying environmental parameters: grid size, part to grid and camera to grid distances, one can obtain the distortion expressed in milliradians per cm or the deviation in milliradians. A photographic record is also created.
Key Features: Provides a visual, qualitative, and quantitative assessment of overall optical quality. It captures the combined effect of distortion and deviation.
ASTM F801 - Standard Test Method for Measuring Optical Angular Deviation of Transparent Parts.
Focus: Specifically measures optical angular deviation without lateral displacement. It is best suited for flat transparent components, such as aircraft windshields, where the precise angular shift of the line of sight is critical.
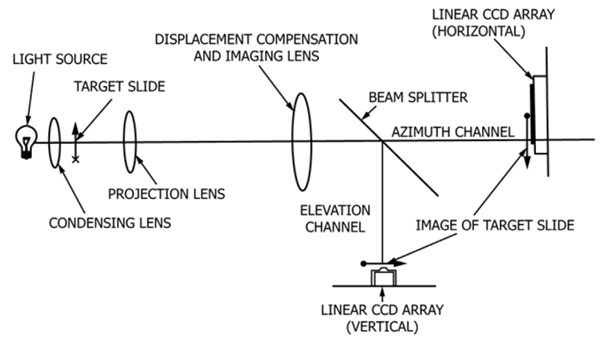
Method: Involves projecting a target through the transparent components and measuring the angular difference between the apparent and actual position of the target. Measurements are made by an optoelectronic system employing collimated light from an appropriate target pattern, a field lens, and a position-detecting device/system, such as linear diode arrays or a two-dimensional diode array.
Output: Quantitative data on the angular deviation in different directions in milliradian.
ASTM F1181 - Standard Test Method for Measuring Binocular Disparity in Transparent Parts
Focus: Measures binocular disparity caused by transparent parts. It is best suited for transparent parts where binocular viewing is important, such as aircraft windshields, and head up display (HUD) to ensure that the image seen by both eyes is sufficiently aligned to avoid visual discomfort or misperception of depth. It is not relevant to architectural glass.
Method: Determines the difference in angular deviation observed by two eyes looking through the same point on a transparent part but from slightly different positions (simulating binocular vision). It uses the same apparatus as the ASTM F801 described above with two sets of measurements separated by 64 mm.
ASTM F2469 - Standard Test Method for Measuring Optical Angular Deviation of Transparent Parts Using the Double-Exposure Method
Focus: Specifically measures optical angular deviation in flat transparent parts where a photographic record of the angular deviation is desired.
Method: Employs a double-exposure photographic technique, similar in concept to ASTM F733 as described above, but specifically designed to isolate and measure angular deviation. It typically uses a target or reticle instead of a full grid.
Output: Quantitative data on angular deviation derived from the photographic measurements in milliradian.
F2156 Standard Test Method for Measuring Optical Distortion in Transparent Parts Using Grid Line Slope
Focus: Specifically measures optical angular deviation.
Method: Employs a double-exposure photographic technique, similar in concept to ASTM F733, but specifically designed to isolate and measure angular deviation. It typically uses a target or reticle instead of a full grid.
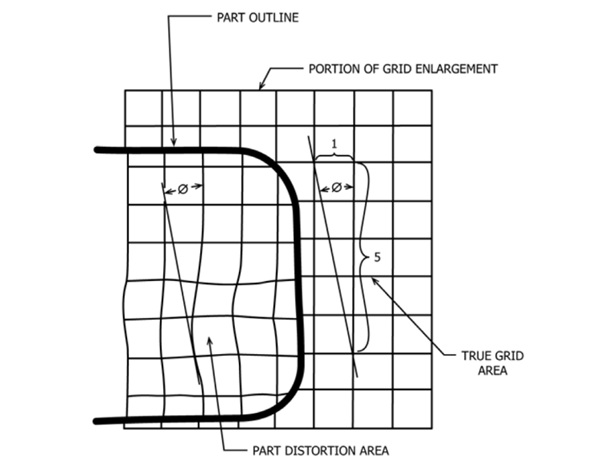
Output: Quantitative distortion data expressed as a dimensionless ratio of a tangent grid line slope.
Aeronautic Optical Test Methods Summary
These tests were originally developed by the military to ensure that pilots could accurately identify and aim at distant targets looking through windscreens. Even a minimal angular deviation can result in significant errors at long distances. Similarly, for commercial pilots who spend extended hours looking through their windscreens, high optical quality is also essential for comfort and safety. Based on our research and assessment, the methods outlined in this article do not provide a significant improvement over those specified in the ASTM C1652 standard. The aeronautical industry could adopt automotive scanner technology for optical quality assessment.
4.4. Experimentation Using Existing Architectural Standards
Our study aimed to compare existing architectural ASTM standards C1036 and C1652 with an automotive optical scanner to assess transmissive distortion. The objective was to produce a heattreated laminated glass specimen with significant distortion. To achieve this, the tempering recipe was deliberately altered to produce roller wave distortion. The glass was oriented on its long side parallel to rollers, inside the tempering oven.
Reflective distortion of each fully tempered 6mm clear glass was measured using a Lite-Sentry scanner.
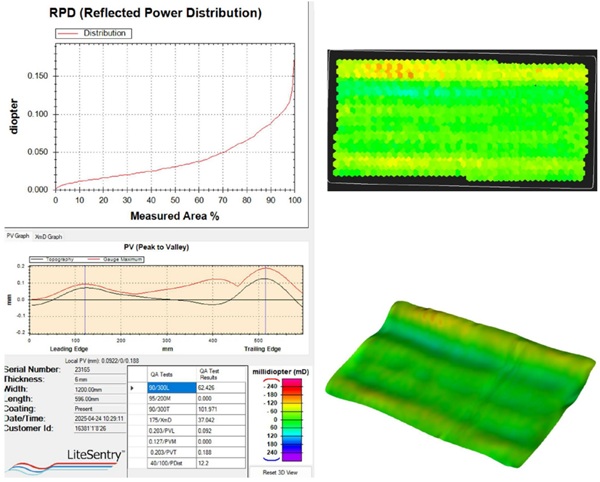
In Fig. 17, we can observe that the trailing edge had up to 140 mDp distortion which is a high value for 6 mm glass. Both lites had similar profiles.
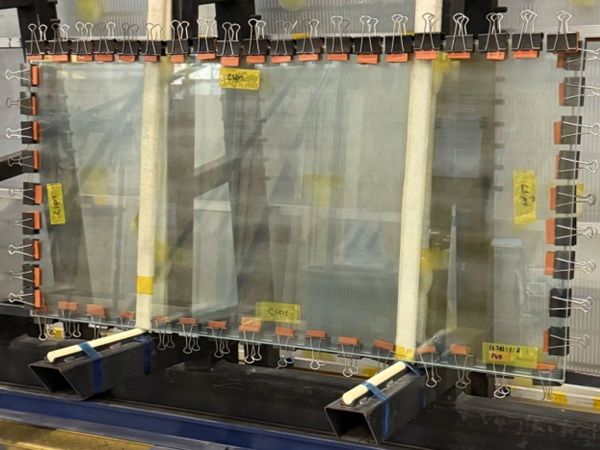
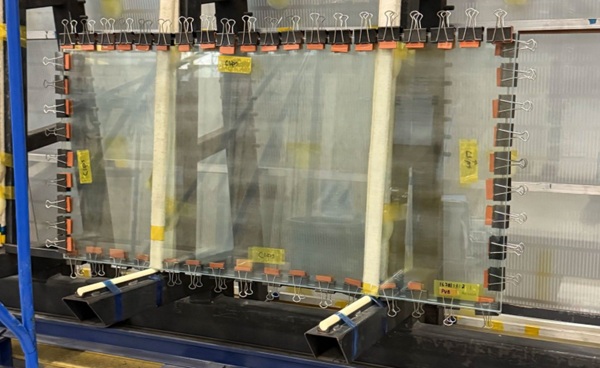
In lamination, 0.090” (2.28mm) PVB was used. The laminates were nipped, and two edges were clipped. While paper clips are sometimes used to prevent bubbles on the edges, they often produce an optical wedge effect on the edges that causes distortion.
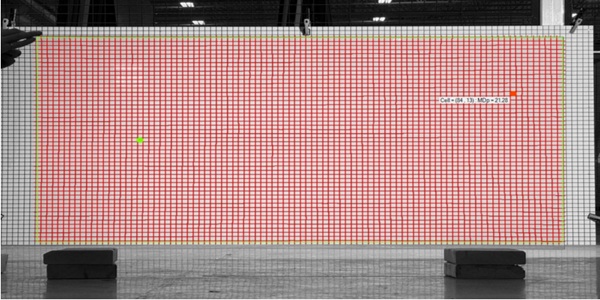
Grid Test setup
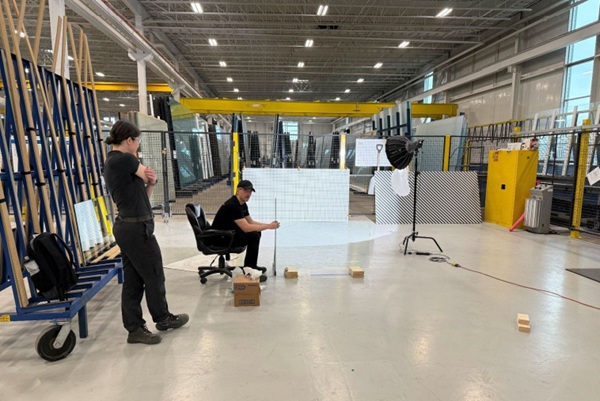
The grid dimension was 2440mm X 1220mm, twice the size of the laminate. A 25 mm X 25 mm grid with a 3mm line width, was chosen to have the same resolution as the Lite-Sentry using 25mm (1”) circles.
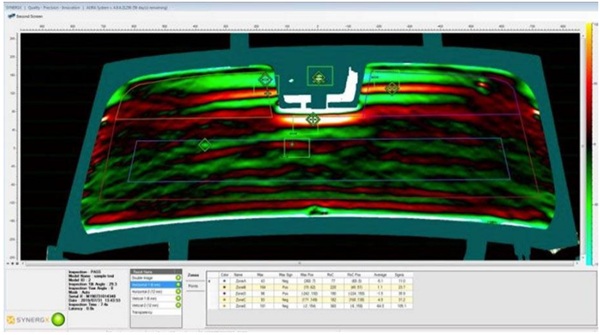
To analyze the digital pictures of the glass in transmission, we used InspectorG, a software developed by Robert Maltby and Gary Brinker. The software employs a Gaussian-based approach to accurately identify each grid node by evaluating each image pixel intensity across the image. The approach of InspectorG is to treat the area change of a small square area as the average magnification at that point. This magnification is then correlated with the average surface curvature and consequently converted into a dioptric value utilizing the physical lens law (physical optics principles).
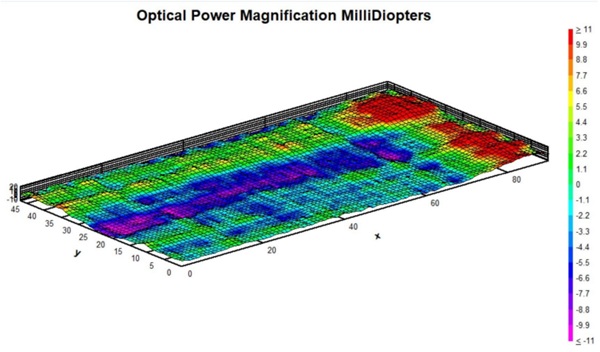
The graph shows the effect of clipping on the top and right. The more intense red zone is on the short edge but the values are still very low. The software confirms a maximum magnification of 21.3 mDp in cell position 84,13.
Despite the presence of 144 mDp roller wave distortion in reflection, the lens effect in transmission is not perceptible even at an acute angle of 60°. Even when variations exist in the front surface geometry, the distance between the front and rear surfaces remains unchanged, thereby eliminating any lens effect. The temperature and duration required for tempering do not permit sufficient modification of the glass’s viscosity, preventing any alteration in its thickness.
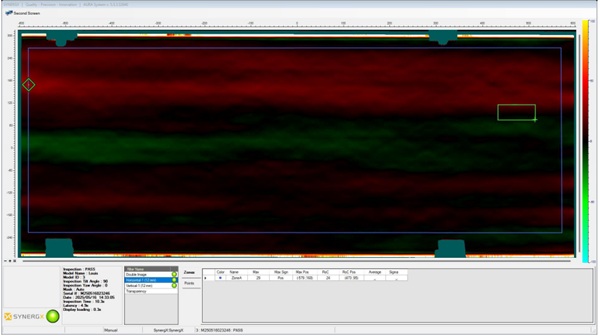
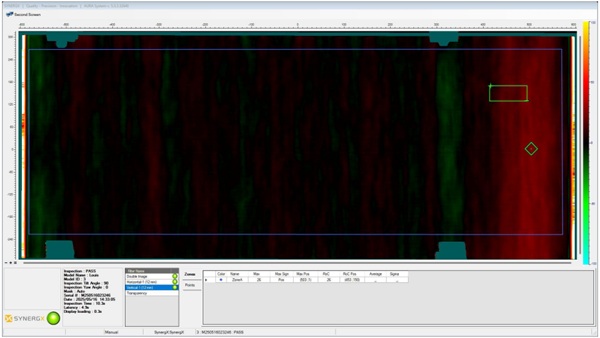
The automotive scans were performed using SYNERGX WINDX laboratory scanner. Because the information is separated into horizontal and vertical distortions, interpretation becomes more challenging. However the values obtained are close to the values of Fig. 20, where the maximum measured distortion is 29mDp vs. 22 mDP using the InspectorG software. We believe that the difference arises from the evaluation grid: 25 mm X 25 mm for Inspector G, compared to the 12mm for the WINDX.
Conclusions
In multiple instances, we encountered building owners expressing dissatisfaction upon discovering optical distortion through their glazing - an issue not addressed in standard construction specifications. In certain cases, this omission let to costly glass replacements and legal disputes.
This paper investigates measurement methodologies and standards from other industries - such as automotive and aerospace - that systematically measure transmission distortion. Additionally, we analyzed and compared two architectural guidelines suitable for offline implementation in manufacturing environments. Our findings reveal a measurable correlation between these two approaches.
Our aim is to build upon the mathematical framework established in ASTM C1952 to develop a reliable, field-applicable measurement technique.
Acknowledgements
We express our gratitude to AGNORA for manufacturing the laminated glass and providing the test setup, to Dr. Maltby and Dr. Brinker for allowing us to use the InspectorG software, and to SYNERGX for providing the automotive scanner - and we wish peace to the world.


Comments
I think it's a massive oversight in our industry that we meticulously scan for reflective distortion on building exteriors while almost completely ignoring the "see-through" optical quality that actually affects the people inside.