
This paper was first presented at GPD 2025.
Link to the full GPD 2025 conference book: GPD_2025_ConferenceProceedingsBook.pdf

Author: Eric Hegstrom | LiteSentry – Softsolution – Strainoptics – GlassQuality.com, US
Abstract
This presentation builds on our “Controlling Glass Quality During Heat Treatment” talk from GPD 2023 and includes an overview of the science and technology behind objective and subjective measurement and grading systems, particularly as they apply to coated glass. Today, nearly all high-end architectural glass products feature at least one, often multiple, coated surfaces. A well-defined and repeatable grading system is required to be able to specify an acceptable level of optical quality and objectionability in coated glass after heat treatment. Although there has been extensive research and discussion over the past 20 years, most work has focused on uncoated glass and does not account for the specific characteristics of coatings. Currently, the industry lacks widely accepted standards for objectively grading the optical quality of coated glass products after heat treatment. As a result, architects and end-customers are not able to specify a meaningful objective quality threshold. This presentation will explore how incorporating the visual impact of modern coatings offers significant opportunities for improvement. Here we’ll examine measurement and analysis techniques that quantitatively characterize coatings and model how they impact the visibility of distortion and anisotropy. We'll delve into the physics and optics behind optical distortion from physical deformation, as well as optical retardation —often referred to as anisotropy, iridescence, or quench marks— resulting from stress imbalances imparted by heat treatment. We’ll demonstrate a subjective analysis method that incorporates coating characteristics (transmission and reflection) to objectively grade the visibility of these effects. Additionally, we’ll review psychophysical testing, including human studies on perception and objectionability, showing how subjective analysis supports the objective calculations. The presentation will conclude with practical guidance on implementing these grading methods in realworld facilities, including essential equipment and procedures for efficient quality control.
Article Information
- Published by Glass Performance Days, on behalf of the author(s)
- Published as part of the Glass Performance Days Conference Proceedings, June 2025
- Editors: Jan Belis, Christian Louter & Marko Mökkönen
- This work is licensed under a Creative Commons Attribution 4.0 International (CC BY 4.0) license.
- Copyright © 2025 with the author(s)
1. Introduction
Today, nearly all high-end architectural glass products feature at least one, often multiple, coated surfaces. A well-defined and repeatable grading system is essential to specifying an acceptable level of optical quality in coated glass after heat treatment. Although there has been extensive research and discussion over the past 20 years, most work has focused on uncoated glass and does not account for how specific coatings impact the visibility of distortion and anisotropy. This problem is faced by all participants in the heat-treated product supply chain from architects to fabricators to end users. After a quick review of the tempering process and the physics behind anisotropy, we’ll discuss two key calculations, SigmaQM and Global Score, and demonstrate how these are scientifically derived and empirically verified, and finally review practical implementation concerns.
2. The Heat Treatment Process
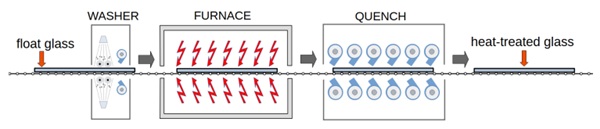
Fig. 2 is a flow diagram of the heat treatment process. Raw annealed glass enters from the left and is cleaned and dried. It is important for any foreign matter to be removed from the glass to avoid staining. The glass is then transported into the furnace and heated to a temperature above its transition temperature (~550°C) but below its softening point (~750°C). The goal is to get the temperature of the glass high enough to relieve all the internal stress while keeping the temperature and duration low enough to minimize physical distortion. The glass then moves into the air-cooling or quench phase where, in the case of tempering, it is cooled rapidly by forced air (cooled more slowly in the case of heat-strengthening).
The rapid cooling in the quench phase sets up an internal stress gradient which imparts the three improved characteristics of the final tempered product:
- four to five times stronger
- shatters into small dull fragments rather than large sharp shards
- far superior ability to withstand rapid temperature changes
During rapid cooling, the outer surfaces of the glass cool first, forming a compressive outer shell that 'locks in' the slower-cooling interior, which is subsequently forced into tension. The cooling of the quench also locks in any physical deformation or warping that has occurred while the glass was above transition temperature.
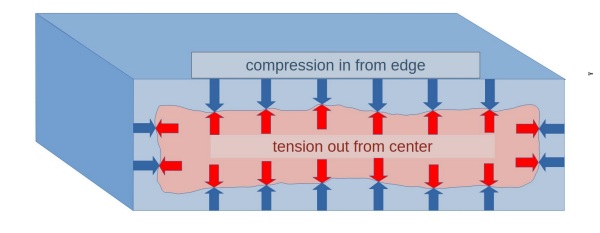
Fig. 3 is a visualization of the compressive and tensile stress zones in a cross-section of tempered glass. The boundary between the tension and compression is depicted as uneven to highlight that, in reality, tensile and compressive stress levels vary locally due to slight differences in cooling rates across the glass. These local inconsistencies alter the way light propagates through the material, leading to the phenomenon of anisotropy or iridescence.
Heat-treatment of glass can adversely affect two largely independent properties that we will call Optical Distortion and Anisotropy.
3. Optical Distortion
Optical distortion is caused by the physical warping of the glass. When viewed in reflection like a mirror, reflected images become magnified or de-magnified based on the local curvature of the surface. The level of optical distortion is expressed in millidiopters (mD) which is a measurement of local optical power (ASTM 1652). Specific shapes of distortion include roller wave (sag between rollers in the furnace), edge lift, center kink, and pocket distortion. These are covered in greater detail in our earlier presentation (Hegstrom 2023). Some of the subtler optical distortions, such as center kink, which may be overlooked in an uncoated product, become quite prominent in coated products, as found in this forensic study (Rosen, A., Hegstrom, E. 2024).
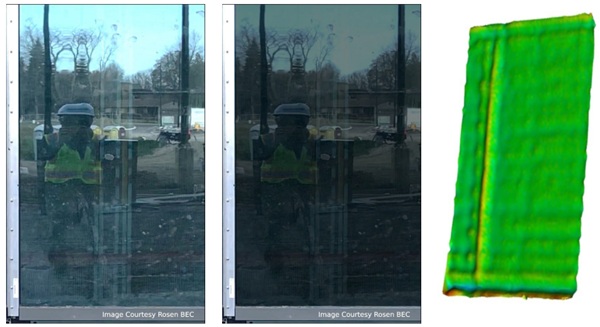
In the case of the optical distortion, the impact on the reflected image is proportional to the reflectivity of the coating. Fig.4 shows an actual photograph of center kink optical distortion. The second image is a simulation of how a less reflective coating makes the entire reflected image darker therefore minimizing, but not eliminating, the objectionable visual impact. The rightmost image is an optical power map in mD as measured by an automated optical distortion inspection machine. Note the objectionable center kink is superimposed on very low-level classic roller wave. Center kink is often not visible during the standard zebra board visual check conducted after heat treatment. This part passed all tests related to roller wave, edge lift, and pocket distortion yet was still objectionable as installed.
4. Anisotropy or Quench Marks
Anisotropy is not simply based on the reflectivity of the coating as in optical distortion. The analysis of the phenomenon of anisotropy requires a basic knowledge of polarized light. All light can be considered as being comprised of two components (or polarizations) P and S that oscillate in orthogonal planes. In Fig. 5, P (red) is oscillating in the plane of the page and S polarization (blue) comes out of the page. A key phenomenon to be aware of is that when light interacts with a non-metallic surface (such as glass or water) it selectively reflects P but allows S to pass through as in the Fig. 5. This effect can be demonstrated when wearing polarized sunglasses near water on a sunny day. The glare off the surface of the water is mostly S polarized. Polarized glasses block this S polarization so you can see the fish underneath the water. In the case of practically stress-free float glass all the P polarized light will pass through.
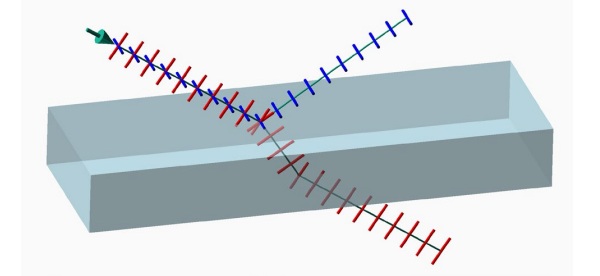
For the sake of clarity, we shall limit the following analysis to P polarized light at a 58-degree incident angle as that is the scenario that will cause the maximum potential anisotropy visibility.
In the case of annealed glass, and in a theoretical perfect tempered glass where the tensile and compressive stresses are exactly balanced, all P polarization light will pass through the glass like in these figures (the red central area of the glass represents inner tensile zone), and no anisotropy will be present.
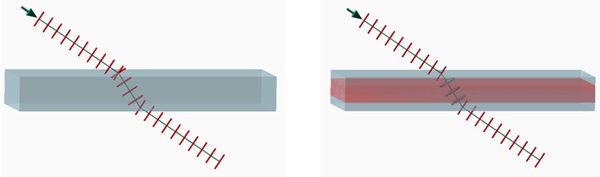
In tempered glass the internal stresses induce an anisotropic (direction-dependent) deformation in the internal glass structure. These localized differences in the density and arrangement of glass molecules cause the polarization to rotate as the light traverses the thickness of the glass. When the stress layers are perfectly balanced, the rotations caused by the outer compression layers are exactly balanced out by the rotation caused by the inner tension zone, resulting in a net zero rotation of the polarization as it exits the glass.
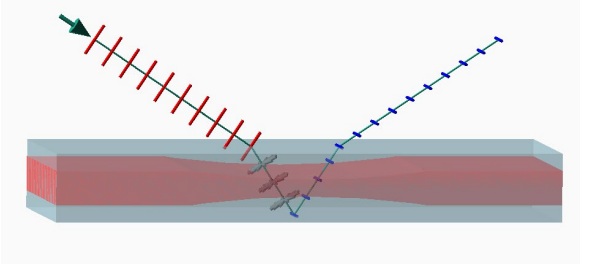
In practice the thicknesses of the compressive and tensile layers always vary slightly due to different rates of cooling on the surface of the glass. These areas of imbalance cause the polarization to have a net rotation as it reaches the far surface of the glass and some of the light that would otherwise pass through the second surface now reflects. This reflected light is the basis of the ghostly bright areas of anisotropy. This is often termed as iridescence, heat stain or quench marks. In the extreme case depicted in Fig. 7, the light is rotated completely from P to S or one-half the wavelength of the light (approx. 225nm in the case of blue-sky).
5. Standards
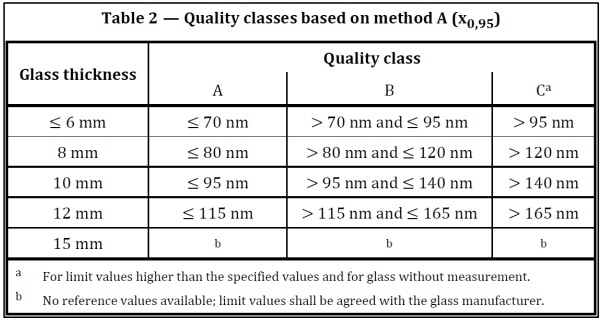
ASTM C1901-2021 is a test method for measuring anisotropy in flat glass. It describes the equipment and procedures needed and defines optical retardation in nanometers (nm) as the standard unit of measurement. It does not define any specific quality limits.
DIN standard 18198-2022 goes further and defines 3 quality classes for different levels of anisotropy, but it only applies to uncoated clear glass. It is a great start, but as mentioned in the beginning, nearly all high-end architectural glass products feature at least one, often multiple, coated surfaces, and these coatings can make a significant visual impact on the visibility of anisotropy.
6. How Coatings influence Anisotropy
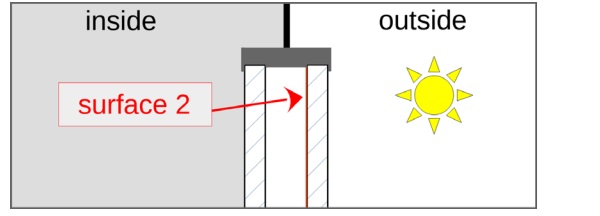
Up until this point we have only considered anisotropy on uncoated glass, but in practical commercial and residential architecture the largest contributor to anisotropy is the external (outer) pane in an insulated glass unit. In the following analyses we examine effects from the coating on the inside surface of this pane (surface 2 coating).
It has been widely observed that change in transmission and reflection increases the visual perception of anisotropies (Fachverband, Konstruktiver, and Glasbau (2019)), but until recently this has not been analyzed in detail. Saint-Gobain Research Paris presented the development of a measurement that characterized the sensitivity of a coating to quench marks and undertook the daunting effort to model exactly how the spectral response of the coated glass affected the visibility of anisotropy (Maccariell and Hivet (2022)).
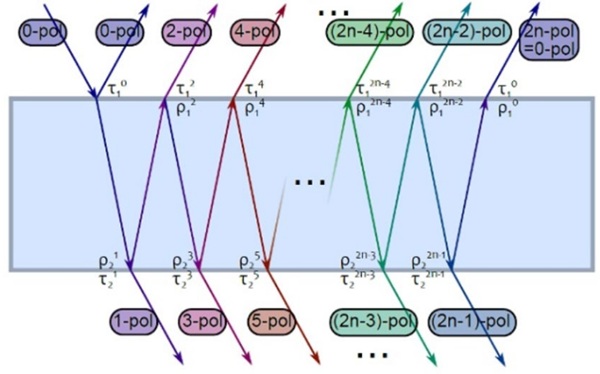
It is beyond the scope of this paper to go into great detail, but by analyzing a mathematical series computation of the effects of the multiple internal reflections, the range of visual influence was converted into a well-established perceptual color model (CIEDE2000). From this a well quantified perceptual separation could be computed. Fig. 10 shows a ray diagram of the internal reflections and how they contribute to the visibility of the level of anisotropy.
This perceptual separation, or the apparent anisotropy visibility difference attributable to variations in coating, was termed 'sensitivity to quench marks' or SigmaQM (σQM) for short. Psychophysical testing, including human studies on perception and objectionability, showed that subjective analysis supports the objective calculations of SigmaQM. A set of glass samples was produced at 5 different total temper strengths with 8 different coatings for a total of 40 samples. A group of approximately 30 observers rated these samples. The analysis showed that "for a given product, the visibility increases with the tempering strength… [T]he global tendency of detection of the defects from the observers matches with a good level of accuracy the trend of the σQM. So, the global trend suggests a good reliability of the estimated quench mark sensitivity factors” Maccariello (2022).
7. Further Modelling of Human Perception with Global Score
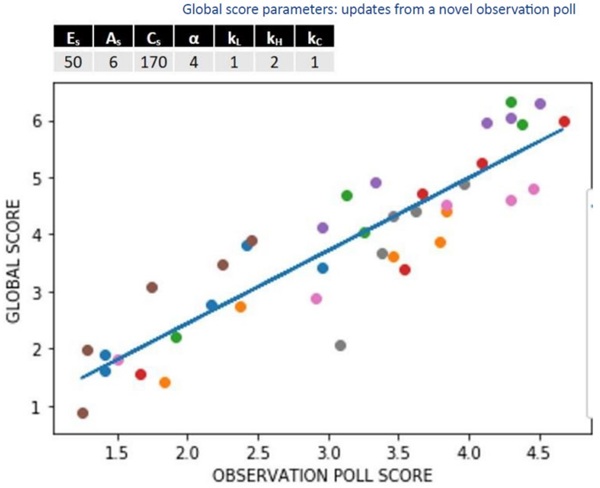
Anisotropy quality controls have historically been based on cumulative statistics of all anisotropy measurements without regard for their visual pattern. Human vision is highly acute in perceiving small changes in contrast. Campbell, F. W.; Robson, J. G. (1968) showed the sensitivity of human contrast pattern perception peaking at around 4 cycles per degree. This formed the basis of a science in contrast analysis. Maccariello (2020) presented a method for computing a Global Score of a contrast pattern by analyzing the mean local contrast in anisotropy images. This calculation was further refined by removing edge contributions and subsequent local filtering.
Further psychophysical testing, including multiple human studies with refined protocols showed how subjective analysis supports the objective calculations to an even higher degree (Maccariello, 2021). Fig. 11 from that study shows a high positive correlation between a computed Global Score and a human observational score:
8. Implementation
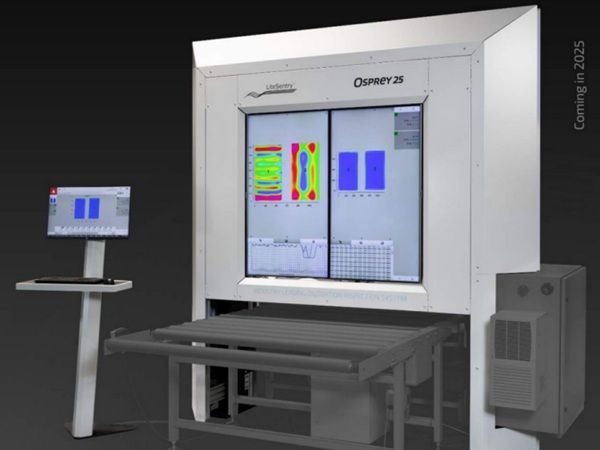
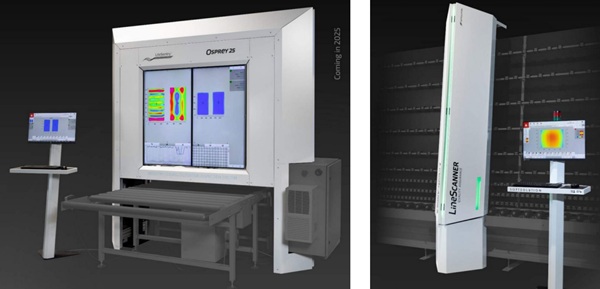
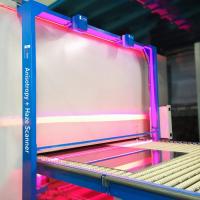
A fundamental requirement for controlling anisotropy and distortion during the heat-treatment process is to have online measurement/inspection. Only with accurate proven real-time 100% measurement and tracking can a glass fabricator monitor the process to identify trends in these measurements and tune the process before rejectable products are produced and, worse yet, missed and installed at the end-user. Systems such as the LiteSentry Osprey and the Softsolution LineScanner offer anisotropy inspection that comply with ASTM C1901. The LiteSentry Osprey will also measure all types of distortion in any direction including center kink.
9. Automatic Coating Detection
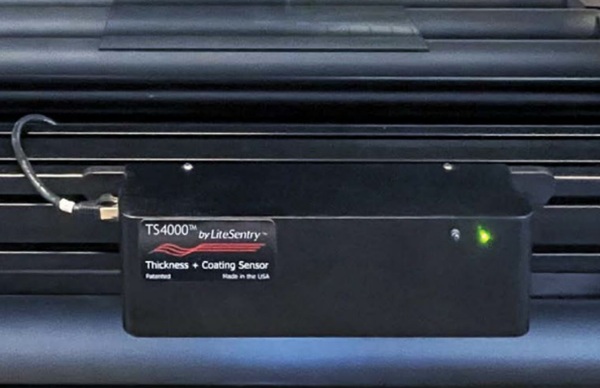
To provide advanced measurement and grading based on coating response one must adjust analysis and quality limits based on the characteristics of the glass and coating type that is currently being processed. A key component to successful implementation is accurate real-time information. Coating information can be entered manually by the operator, but this is prone to error and no auditability is provided. Another option is to receive this information from ERP software, which is more robust but still prone to mismatches due to sequencing issues resulting from breakage, remakes etc. The most reliable technology for this is the integration of online sensors for automatic coating identification. One example is the LiteSentry TS series of products. These online sensors analyze the optical response at 18 different wavelengths to identify coatings in real-time. For example, the LiteSentry TS4000 measures glass thickness (1-25mm) and discerns coating type (including electrochromic, pyrolytic coatings and more) on front and most back surfaces. It can also discern tinted glass. It is a robust solution that requires no sensors or lighting below the glass. In addition, options are available for additional IG measurements of air gaps and coating surfaces.
10. Conclusions
Implementing scientifically validated distortion and anisotropy measurement techniques, along with adjustments to quality thresholds based on defect visibility influenced by coating response, ensures superior optical quality in heat-treated coated glass. These advancements offer a robust framework for defining quality standards, enhancing industry practices, and ultimately improving architectural glass performance.
References
Rosen, A., E Hegstrom, E. (2024). Glass Distortion: Not Such a Clear View, Presented at International Institute of Building Envelope Consultants
DIN SPEC 18198:2022-05, Measurement and evaluation methods for optical anisotropic effects in thermally toughened glass, Deutsches Institut für Normung, May 2022.
ASTM C1901-21, Standard Test Method for Measuring Optical Retardation in Flat Architectural Glass, ASTM International, West Conshohocken, PA, 2021.
ASTM C1652/C1652M-21, Standard Test Method for Measuring Optical Distortion in Flat Glass Products Using Digital Photography of Grids, ASTM International, West Conshohocken, PA, 2021 - - https://www.astm.org/c1652_c1652m-21.html
Hegstrom, E. (2023). Controlling Glass Quality During Heat Treatment. Presented at Glass Performance Days (GPD) 2023, Tampere, Finland.
Fachverband Konstruktiver Glasbau e.V. (2019). Technical Note FKG 01/2019: The Visual Quality of Glass in Building – Anisotropies in Heat Treated Flat Glass. Retrieved from
https://www.glas-fkg.org/wpcontent/uploads/FKG_Technical_Note_anisotropies.pdf
Maccariello, D., & Hivet, R. (2022). Coating Sensitivity to Quench Marks. Saint-Gobain Research Paris. Retrieved from www.glassonweb.com/article/coatings-sensitivity-quench-marks
CIEDE2000. Perceptual Color Space. Retrieved from https://en.wikipedia.org/wiki/Color_difference#CIEDE2000
Maccariello, D. (2021). Global Score Parameters: Updates from a Novel Observation Poll. Saint-Gobain Research Paris.
Maccariello, D. (2020). Classification Method for Quench Pattern Visibility. Saint-Gobain Research Paris.
Campbell, F. W., & Robson, J. G. (1968). Application of Fourier Analysis to the Visibility of Gratings. Journal of Physiology, 197(3), 551–566. doi: http://doi.org/10.1113/jphysiol.1968.sp008574
Maccariello, D., & Hivet, R. (2022). Coatings Sensitivity to the Quench Marks. In J. Belis, F. Bos, & C. Louter (Eds.), Challenging Glass Conference Proceedings (Vol. 8). https://doi.org/10.47982/cgc.8.406


Comments
What stood out to me is bridging objective data with human perception. That's where better standards begin. chipped windscreen