
This paper was first presented at GPD 2025.
Link to the full GPD 2025 conference book: GPD_2025_ConferenceProceedingsBook.pdf

Authors: Franz Paschke, Matthias Seel, Miriam Schuster, Michael Kraus
Glass Competence Center, Institute of Structural Mechanics and Design, Technical University of Darmstadt, Germany
Abstract
The use of Vacuum Insulated Glass (VIG) in retrofitting projects, particularly in heritage buildings, is rising steadily as the demand for energy efficiency in building lifecycles grows. Here, VIG offers low and stable U-values (0.3 – 0.7 W/(m²K)) and long-term durability while maintaining minimal changes in the overall heritage layout. Moreover, VIG presents significant advantages over conventional IGUs in new construction projects, offering enhanced durability, a slender profile, and superior thermal performance. Its adaptability to diverse boundary conditions further underscores its potential as a highperformance glazing solution. However, the wider adoption of VIG requires standardised design and analysis guidelines, particularly for temperature induced stress, as this is an inherent design challenge for VIG. While wind, snow, and even climatic loads for conventional insulating glass units are standardised in many regions, loads due to ambient temperature differences and solar radiation are not yet regulated in most countries. For VIG, the load case associated with ambient temperature differences lacks a clear definition and harmonization across Europe. Additionally, VIG remains an unregulated product, and a robust data foundation is needed before developing standards for these loads and the product itself. This paper presents the design of a test setup for the experimental investigation into the temperature load of VIGs under specific boundary conditions. A preliminary study was performed to analyse temperature profiles, deformations, and stress distributions along the VIG during temperature load tests, to validate the test setup through comparison with results from numerical and analytical computations. The findings contribute to a deeper understanding of the challenges associated with establishing a reliable temperature test setup and provide insights into the thermomechanical behaviour of VIG under a temperature load. The study focuses on accurately defining the thermal load and implementing it within an experimental test setup. The evaluated data offers a comprehensive basis for refining temperature load testing methodologies, ultimately contributing to the development of design approaches that could inform future VIG design standards.
Article Information
- Published by Glass Performance Days, on behalf of the author(s)
- Published as part of the Glass Performance Days Conference Proceedings, June 2025
- Editors: Jan Belis, Christian Louter & Marko Mökkönen
- This work is licensed under a Creative Commons Attribution 4.0 International (CC BY 4.0) license.
- Copyright © 2025 with the author(s)
1. Introduction
The growing demand for energy-efficient buildings has led to increased interest in advanced glazing technologies as a key component of the building envelope. Windows play a crucial role in thermal performance, as they are responsible for significant heat loss in winter and heat gain in summer. Traditional double-glazed and low-emissivity (low-E) glass windows have contributed to reducing energy consumption; however, further improvements are required to meet stringent energy efficiency standards and sustainability goals (European Comission, 2019).
Vacuum insulated Glazing (VIG) has emerged as a promising solution to enhance the thermal performance of windows. With their low Ug-values (0.3 W/(m²K) to 0.7 W/(m²K)) they top standard triple glazing units and are comparable with insulated walls while keeping the facade still transparent (Collins, R.E. and Robinson, S.J., 1991). VIG offers benefits such as a slim profile, reduced weight, reduced carbon footprint and long-term durability, making it an attractive alternative to conventional Insulating Glass Units (IGUs).
The adoption of VIG in building envelopes can lead to substantial reductions in heating and cooling loads, subsequently lowering greenhouse gas emissions and operational energy costs (Peng, et al., 2024).
Despite these advantages, significant design challenges persist, particularly towards the standardization of VIG (VIG). While several commercial manufacturers already offer reliable VIG products, the lack of universally accepted design and verification standards hinders broader application of VIG in current construction projects. In addition to conventional environmental loads such as wind and snow, VIG units must withstand two intrinsic construction-related loads that require precise definition and standardized calculation methods: difference between atmospheric pressure and the vacuum cavity, and temperature induced stresses. Establishing robust analytical and experimental methodologies to quantify these effects is crucial for reliable design of VIG together with the development of comprehensive design guidelines and future standardization efforts.
1.1. Background and Motivation
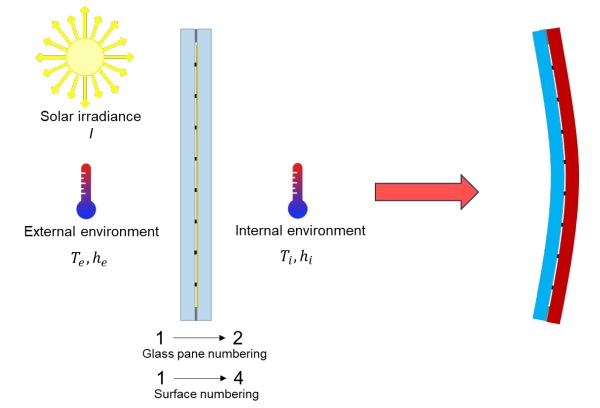
This study investigates the thermal load case of VIG through experimental analysis. The origin of this load condition stems from the fundamental function of VIG as an insulating glass unit. Since VIG separates two environments with distinct temperatures, Ti (interior) and Te (exterior), as well as different heat transfer coefficients, hi and he, the two glass panes experience different average temperatures. The difference between the average temperature of each glass pane of the VIG describes the temperature load ΔTa (ISO, 2021). Due to this temperature difference, thermal expansion occurs at different magnitudes in each pane. However, as the panes are rigidly connected through the edge seal, the differential expansion induces bending, causing the VIG unit to deform toward the warmer glass pane, see Figure 1. Additionally to the out of plane bending the VIG can also experience hoop stresses which occur due to a temperature difference between the mean value of the temperature in the centre region Tmean and the temperature in the edge region Tedge of the glass panes which is analogue to the the thermal breakage phenomena of monolithic glass panes (Schwind, Paschke, & Schneider, 2022). A non-uniform temperature load (e.g., due to shading or glass indentation in the frame) could amplify this effect, potentially increasing or decreasing the stress in the glass (Ensslen, et al, 2023). Therefore, understanding the temperature distribution within the chamber and on the glass pane is crucial for accurately evaluating the results of the temperature tests described in this paper.
The fundamental thermomechanical behavior of VIG, as well as the analytical structural analysis model and numerical investigations thereof underlying this investigation, has been extensively described in prior research (Collins, R.E.; Fischer-Cripps, A.C and Tang, J.-Z., 1992), (Aronen & & Kocer, Vacuum insulated glazing under the influence of a thermal load., 2017), (Wullschleger, L.; Manz, H.; Wakili and K. Ghazi, 2009), (Aronen, A. and Kocer, C., 2024). In the analytical model according to (Collins, R.E. and Robinson, S.J., 1991), the VIG is assumed to deform freely in plate direction without any edge constraints, meaning there are no external bearings along the perimeter. This condition is only achievable in the vertical test setup and is replicated in the experimental temperature test stand, as described in more detail in section 2.1.
To verify glass structures against a given load case, both the nature of the load and the resistance of the structure must be carefully defined. This includes specifying the origin of the load origin, its duration, and magnitude, as well as its effects on the VIG (stress) determining the resistance (strength) of the glass, depending on the glass product type and potential failure locations (e.g. edge or surface). For the temperature load case, the analytical model developed by Collins et al. (Collins, R.E.; FischerCripps, A.C and Tang, J.-Z., 1992) has been extended and documented in ISO 19916-3 (ISO, 2021).
However, in terms of verification, there are only a limited number of experimental investigations that address the temperature load on VIG. These tests have been conducted using both horizontal (Simko, Fischer-Cripps, & Collins, 1998), (Liu & Bao, 2013) and vertical test setups (Büttner, et al., 2023). The results from these experiments demonstrated good agreement between the measured temperatures, deflections and strains and numerical and analytical models (Collins, R.E. and Robinson, S.J., 1991), confirming that the test setups accurately represent the thermomechanical behaviour of VIG. Nevertheless, previous studies have either measured deflections or strains, or temperature data independently, but never all parameters simultaneously. Additionally, temperatures and deflections were predominantly measured at a single location. A comprehensive understanding of VIG resistance against temperature loads requires the correlation of strain, deflection, and temperature data. Measuring only one or two parameters may fail to identify critical stress points or failure mechanisms that could impact the overall performance of the VIG.
Furthermore, durability testing of VIGs subjected to cyclic thermal loading is described in ISO 19916- 3 (ISO, 2021) and has been addressed in the work of Fang et al. (Fang, Hyde, Eames, & Hewitt, 2009). These tests primarily focus on demonstrating that the thermal transmittance of the VIG does not change after undergoing thermal cycling. However, none of the existing experimental investigations have applied a temperature load sufficient to fracture the VIG. When considering a load that may cause failure, it is crucial to evaluate both the magnitude and the origin of the failure in detail. Without this, it cannot be verified that the stresses calculated using numerical or analytical models accurately reflect the conditions required for the design and verification of VIG units. To obtain representative results, it is essential to fulfill a variety of boundary conditions. Consequently, the primary focus of this paper is on the design and setup of the test setup, as well as the execution of the test. Later, the test results can be used to evaluate later the resistance of VIG to a temperature load in a manner that accurately reflects real-world conditions.
2. Methodology
2.1.Temperature Test Stand
The construction of the temperature test setup should adhere to the specifications outlined in ISO 19916-3 (ISO, 2021). The standard describes two variants for the test setup: one with a single temperature chamber and one with two temperature chambers. The advantage of using two temperature chambers is that it allows for independent control of the temperature on both sides of the VIG specimen. In contrast, with a single temperature chamber, only the temperature on the side facing the chamber can be controlled precisely, while the other side is exposed to the ambient room environment, where the temperature should remain stable. Regardless of the chamber configuration, continuous measurement of both the air and glass surface temperatures on both sides of the VIG is essential.
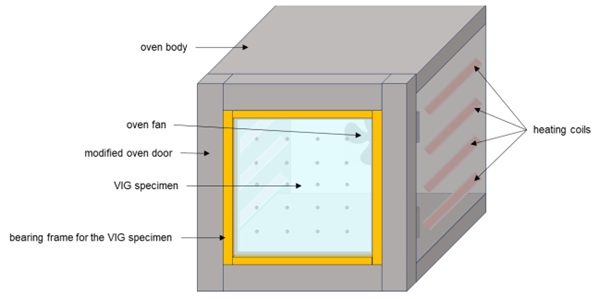
According to ISO 19916-3 (ISO, 2021), thermocouples should be placed near the centre of the VIG specimen, one on the cold glass surface and one on the warm glass surface. Additionally, thermocouples should be used to measure the air temperature in both the cold and warm environments, with the sensors positioned approximately 100 mm - 200 mm from the glass surface. The temperature chamber used should facilitate air circulation and maintain temperature regulation. For the construction of the temperature test setup a furnace Nabertherm N 50 was modified. In a first step a new door was designed and built to be able to install the VIG specimens in the door frame. Additionally, a wind sheet can be implemented in the door frame as it is recommended in ISO 19916- 3 (ISO, 2021). And different bearing situations can also be implemented in the door frame. A schematic of the temperature test setup is shown in Figure 2.
The primary objective of the test stand is to investigate the resistance against thermal fracture in VIG, requiring the temperature chamber to operate at elevated temperatures, while the room temperature remains constant at 20 °C. Using analytical formulas and numerical simulations, the minimum temperature to induce thermal fracture was calculated to yield 160 °C, as shown in section 2.3 Figure 7. This temperature was selected to ensure that the induced temperature load exceeds the characteristic flexural strength of annealed float glass (45 MPa). The characteristic flexural strength of annealed float glass represents the 95 % fractal value, indicating that failure remains unlikely under typical conditions. However, since maximum stress occurs at the edges, where the strength of glass is lower compared to its surface, the probability of failure increases.
Nevertheless, temperature chamber can reach up to 1200 °C, which provides more than sufficient capacity to apply a high-temperature load to the VIG specimens. Temperatures exceeding 200 °C could be particularly useful for investigating fully tempered VIGs. The temperature within the chamber is controlled by heating coils positioned on both the right and left sides. Additionally, a controller was installed to program temperature profiles with up to 21 temperature segments, allowing for precise temperature steps. Each step is held for a specified duration to achieve a stable temperature in the chamber, thereby enabling the investigation of the temperature load as a steady-state condition, which facilitates better comparison with analytical and numerical models.
Initially, the temperature chamber sensor lacked sufficient sensitivity, prompting the need to measure temperatures at various locations within the chamber. Furthermore, in the absence of a fan, the distribution of temperature in the chamber and across the VIG specimen was not uniform, meaning that the applied temperature load was not constant over the surface. Despite these limitations, several temperature profiles were run to investigate the correlation between the set temperature on the controller and the actual temperatures within the chamber environment and on the VIG glass surface. Additionally, the reproducibility and consistency of the test stand were examined. The results obtained from these temperature profiles are presented in Section 2.1.
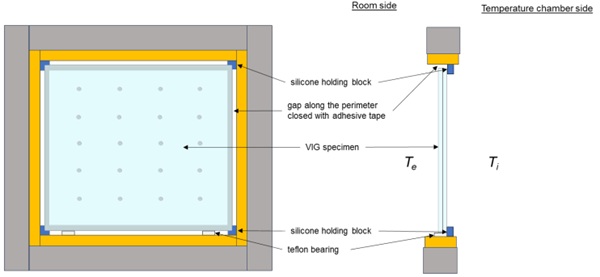
The VIG specimens are installed in the door of the temperature chamber. Specimens with edge lengths up to 350 mm × 350 mm can be accommodated in the test stand, which corresponds to the size of the VIG specimens (composed of two 4 mm glass panes) investigated in this study. This size is in accordance with the minimum edge length requirement of 300 mm × 300 mm as specified in ISO 19916-3 (ISO, 2021).
The stress in the VIG is influenced not only by the environmental boundary conditions and the structure of the VIG itself but also by its support configuration. Therefore, it is essential to determine the specific boundary conditions to be considered. Since the analytical model by Collins et al. (Collins, R.E.; Fischer-Cripps, A.C and Tang, J.-Z., 1992) and the ISO 19916-3 (ISO, 2021) offer the most detailed description of the thermomechanical behaviour of VIG, it was decided to begin with the "free edge" boundary condition. This condition allows the VIG to expand in the plane of the glass and deflect perpendicular to the glass plane.
To implement this, a small gap (approximately 2 mm) was established around the perimeter of the VIG and the chamber door frame. The VIG specimen is supported vertically on two Teflon bearings located at the bottom corners. Additionally, small silicone bearings are installed at all four corners on the chamber side to prevent the specimen from falling into the chamber. On the room side, the specimen is secured along its perimeter with standard adhesive tape to prevent air flowing past the edges. This setup enables the VIG to deform freely toward the warmer environment of the chamber, while still being held vertically within the chamber door frame.
2.2. Measurement techniques
The temperature load arises from the environmental boundary conditions, which lead to a specific temperature distribution within the VIG and induce deformations and stresses in the glass panes. Therefore, during the tests, the temperature is measured at several locations on the specimen, and deflections are also recorded.
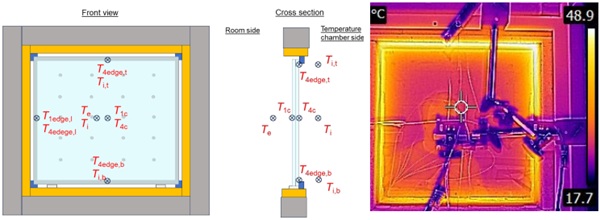
Since the temperature distribution within the chamber near to the glass surface is crucial for determining the temperature load applied to the VIG, a total of 10 temperature sensors were employed. K-type thermocouples were primarily used for temperature measurements. To ensure the accuracy of the K-type sensors (for both surface and air temperatures), reference measurements were conducted using a Pt100 sensor. The average relative deviation between the measurements from the K-type thermocouples and the Pt100 sensor was found to be 0.9%.
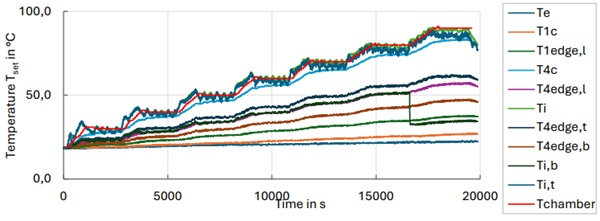
A representative temperature program and its corresponding temperature curve are shown in Figure 5. The temperature sensor Ti,b detached during the measurement and lied on the bottom of the temperature which can be seen of the drop of this curve at Tset of 90 °C. During this program, seven different temperature levels were set, ranging from Tset = 30 °C to 90 °C (set temperature of the chamber), with each temperature step maintained for 30 minutes, as detailed in Table 1. As illustrated in Figure 5, particularly the measured air temperatures (denoted without numbers) can overshoot the target temperature level. Additionally, the glass surface temperatures (measured at surface 1 and surface 4) require some time to stabilize and converge to a constant temperature plateau.
The criterion for determining when a constant temperature is reached was defined as the point at which the measured temperature at the centre of the VIG specimen, facing the temperature chamber, deviated by no more than 1% over a 5-minute period. The mean value from the following 10 minutes was then used for further analysis and comparison with model results.
The graph in Figure 5 highlights the issue arising from the lack of ventilation in the temperature chamber. Warm air tends to accumulate at the top of the chamber, leading to a significant temperature gradient. The maximum temperature difference across all runs measured between the air at the top and bottom of the chamber (denoted as Ti,t - Ti,b) was observed to be 55.3 °C when the chamber temperature was set to 90 °C. This temperature discrepancy could result in a highly non-uniform temperature load, potentially causing stress variations in the VIG that differ from a uniform temperature load, as discussed in Section 2.3. Non-uniform temperature loads, such as those caused by shading on the VIG, have not yet been published but are planned for future investigations.
Table 1: Measured temperature differences between the temperature chamber side and the room side
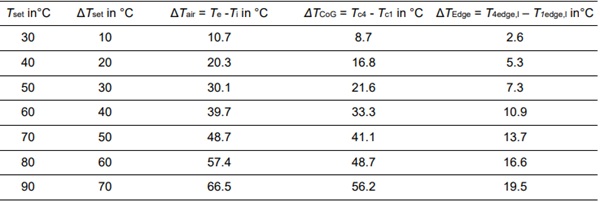
From Table 1, it is evident that the air temperature difference, ΔTair, is up to approx. 10 °C higher than the temperature difference at the centre of glass surfaces 1 and 4 (ΔTCoG). Using ΔTair as the temperature load in conjunction with the analytical formula (Collins, R.E.; Fischer-Cripps, A.C and Tang, J.-Z., 1992); (ISO, 2021) or a simplified numerical model, where two glass panes are bonded together with each pane having a uniform temperature, may lead to an overestimation of the stresses compared to the actual conditions. Conversely, using ΔTcentre could underestimate the stress, resulting in an unsafe calculation and design.
Therefore, ΔTa, which represents the temperature load, is defined as the temperature difference between the mean temperature of each glass pane. This value can be calculated through numerical simulation, as demonstrated in the comparison presented in Section 2.3.
In addition to temperature measurements, the deflection of the VIG specimens was also monitored during the temperature programs. Two laser displacement sensors were installed on the frame of the temperature chamber to measure displacement. The deflections were recorded at the centre of the unit and along the right edge during the initial investigations.
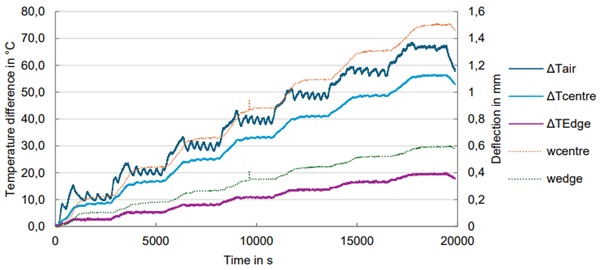
As shown in Figure 6, the duration of the constant temperature periods was also suitable for deflection measurements, as the deflections stabilized at each temperature level. By considering the measured temperature differences ΔTair, the centre of glass ΔTCoG, and the edge of the VIG ΔTedge, the corresponding deflections can be observed in Figure 6. The deflection at the centre of the VIG is higher than at the edge, which aligns with the predictions from both the analytical and numerical models.
2.3. Analytical and Numerical Modelling
The measured data from Section 2.2, combined with numerical and analytical models, can be used to validate the test setup and the measurement process, and vice versa. Furthermore, these models help to bridge the measurement gap (e.g. strain gauge data), providing an estimation of the resulting stresses in the VIG specimens during the test. Figure 7 presents a numerical parameter study where the maximum principal stress at the edge on surface 4 σΔTa,surf.4,edge and the deflection at the centre of glass wCoG are calculated for different temperature differences (ΔTair, ΔTCoG and ΔTa). For this study, a full quarter (Büttner, et al., 2023) of a VIG unit measuring 350 mm x 350 mm was modelled, including the pillars and the edge seal. The external and internal heat transfer coefficients, he and hi, were set to 6 W/(m²K), and the internal temperature Ti was maintained at 20 °C, with the external temperature Te increasing. By comparing the numerical data, it is possible to identify which numerically calculated temperature differences (ΔTair and ΔTCoG from Figure 7), most accurately reflects the actual temperature load ΔTa on the VIG. This can be used to calculate the resulting stress in the glass from the measured temperature (e.g. ΔTair, ΔTCoG ΔTEdge from Table 1) with analytical approaches (Collins, R.E. and Robinson, S.J., 1991) (Aronen, A. and Kocer, C., 2024).
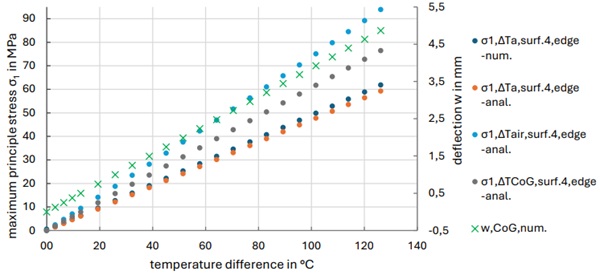
The actual temperature load, defined in the analytical model as ΔTa (ISO, 2021), can be most accurately calculated using a detailed numerical model rather than through analytical approaches as the temperature distribution in the structure is calculated precisely at each node of the model. To measure ΔTa exactly during the test, it is necessary to determine the temperature distribution across surfaces 1 and 4. Therefore, the temperature differences between the average temperatures of glass surfaces 1 and 4 (ΔTa), the air-to-air temperature difference (ΔTair), and the temperature difference at the centre of glass (ΔTCoG) were calculated numerically. The data for the curve σΔTa,surf.4,edge, num. in Figure 7 was obtained by calculating inhomogeneous temperature distribution of the numerical model and applying it on a mechanical model. The other three curves in Figure 7 were obtained by calculating the temperature differences (ΔTair, ΔTCoG and ΔTa) numerically and use them to calculate the stress with the analytical model. σΔTa,surf.4,edge, anal. was calculated with the difference between the average temperature of surface 1 and surface 4 (cf. section 1.1). σΔTair,surf.4,edge, anal. and σΔTCoG,surf.4,edge, anal. were calculated with the difference of the applied environmental temperatures Ti – Te and the difference between the maximum temperature on surface 4 and the minimum temperature on surface 1 respectively The maximum principal stresses on surface 4 were also computed numerically and showed good agreement with the results from the analytical model (see orange and dark blue curves in Figure 7).
The numerically calculated temperature differences (ΔTa, ΔTair, and ΔTCoG) were then used to estimate the resulting stresses using the analytical model, see Figure 7. While ΔTair and ΔTCoG could be easily derived from the measurements described in Section 2.2, the comparison of data shown in Figure 6 reveals that using ΔTCoG as the temperature load would overestimate the resulting stress by 29%, while using ΔTair would lead to an overestimation of 56%, compared to the actual temperature load, ΔTa.
3. Results and Discussion
The results from the initial tests in the temperature test stand clearly indicate that ventilation within the temperature chamber is essential to develop a uniform temperature field across the VIG specimen. It is important to note that the measured air temperatures are highly dependent on the location of the sensors, particularly when placed near edges and corners. Despite this, the significant temperature differences observed still result in a non-uniform temperature load across the VIG surface.
Moreover, maintaining a constant chamber temperature for each load step for 30 minutes is sufficient to obtain converged measurement data (temperature and deflection). The measured temperature differences, ΔTair and ΔTCoG, shown in Table 1, exhibit a mean deviation of 18.1% from each other, which aligns well with the numerically calculated temperature differences, which have a mean deviation of 16.5% between ΔTair and ΔTCoG. This suggests that the general test setup and the assumptions used in the numerical model are in good agreement.
However, as shown inTable 2, the measured deflections and the numerically calculated deflections deviate by more than 10%. Several factors contribute to this discrepancy. One factor is the deviation in the measured ΔTair compared to the values used in the numerical calculation. Additionally, the actual heat transfer coefficients in the experiment were not precisely known and were assumed to be he = hi = 6 W/(m²K), which may contribute to the variation in the results.
Table 2: Comparison of the measured and numerical calculated temperatures and deflections.
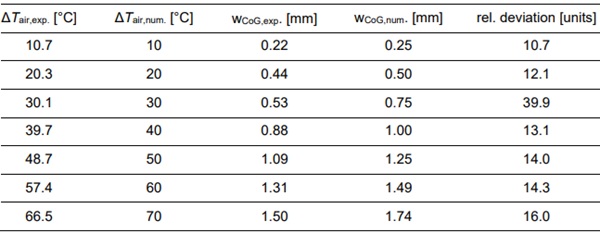
The factor with the greatest influence on the temperature load and consequently on the deflection and stresses is the inhomogeneity of the temperature distribution in the experimental setup, particularly in the absence of ventilation in the chamber. Since the set temperature in the chamber is not uniformly reached across the entire height, with the temperature at the bottom (Ti,b) being much lower, the overall temperature load on the VIG is reduced, which in turn leads to lower deflection and stress, as shown in Table 2. This assumption is based on the premise that bending-induced stress predominantly exceeds in-plane stress. Consequently, further investigations are required to examine the effects of non-uniform temperature loads.
Figure 5 clearly illustrates the importance of using the correct temperature difference to obtain realistic results from the analytical model. Also, for simplified numerical models it is necessary to calculate ΔTa correctly to receive realistic results. If an incorrect temperature load is used, the stresses are significantly overestimated. For the VIG specimen size of 350 mm x 350 mm investigated in this study, the stresses and deflection behave in a linear fashion within the range of the temperature loads tested. However, for larger VIG units, geometrically nonlinear deformations will occur, and the analytical model will no longer be applicable. This is particularly relevant for VIGs made from fully tempered float glass, where higher temperature loads are assumed to be tolerated, as the nonlinear behaviour becomes more pronounced.
4. Conclusion and Outlook
The investigations presented in this paper highlight the challenges associated with setting up a temperature test stand for VIG. One of the primary challenges identified is the non-uniform temperature distribution across the VIG specimen, which results in deviations between experimental test results and model predictions. However, it is important to consider that in real-world scenarios, the temperature load may not be perfectly constant either. Therefore, further numerical studies are needed to investigate the effects of non-uniform temperature loads and their impact on VIG performance.
The measured deflections observed in the experimental tests were in the range predicted by the numerical model, although they were smaller due to the reduced average temperature load. To improve the accuracy of future temperature tests, a ventilation system will be incorporated into the test setup, along with a wind sheet, to ensure a more uniform temperature distribution across the VIG specimens. An alternative approach involves rotating the temperature chamber so that the VIG specimen is positioned horizontally within the door frame, allowing for a more uniform temperature load distribution. This setup would require a more comprehensive investigation of the point bearings at all four corners and the influence of dead load. Once a uniform temperature load is achieved, verified through the established temperature measurement chain, further studies will focus on determining the maximum tolerable temperature load and conducting a detailed failure analysis. Additionally, strain gauges will be applied to the VIG specimens to evaluate the symmetry of the stress field and further validate the consistency of the temperature distribution.
By measuring temperature, deflection, and strain simultaneously, a more comprehensive understanding of the VIG's behaviour under temperature loading can be achieved. This approach will also serve to validate the test setup, enabling the determination of the maximum temperature load a VIG can withstand. Ultimately, knowing the stress levels at the point of VIG failure during temperature load tests will help confirm the accuracy of existing models and providing a reliable design criterion for VIGs. This will contribute to the development of more efficient verification calculations for VIG design and performance.
References
Aronen, A., & & Kocer, C. (2017). Vacuum insulated glazing under the influence of a thermal load. All Eyes on Glass, Glass Processing Days, vol. GPD2017, pp. 273-279. Finland.
Aronen, A., & Kocer, C. (2024). An Enhanced model of thermo-mechanical loading on a Vaccum Insulated Glazing.
Büttner, B., Paschke, F., Seel, M., Stark, C., Wolfrath, E., & Weinläder, H. (2023). Hybrides Vakuumisolierglas – Thermische und thermomechanische Charakterisierung. Glasbau 2023. doi: https://doi.org/10.1002/9783433611739.ch14
Collins, R.E.; Fischer-Cripps, A.C.; Tang, J.-Z. (1992). Transparent evacuated insulation. Solar Energy, Pages 333-350. Retrieved from https://doi.org/10.1016/0038-092X(92)90106-K
Collins, R.E.; Robinson, S.J. (1991). Evacuated glazing. Solar Energy, Pages 27-38. doi: https://doi.org/10.1016/0038-092X(91)90060-A
Ensslen, F., Schwind, G., Beinert, A., Schneider, J., Mahfoudi, A., Lorenz, E., . . . Erban, C. (2023). Normentwurf zur Ermittlung der thermischen Beanspruchung von Glas und Glas-PV-Modulen (BIPV) im Bauwesen (Thermobruch). Schlussbericht zum WIPANO-Projekt, Laufzeit: 01.10.2020 bis 30.09.2022. doi: https://doi.org/10.2314/KXP:1870984862
European Comission. (2019). The European Green Deal. Publications Office of the European Union.
Fang, Y., Hyde, T. J., Eames, P., & Hewitt, N. (2009). Theoretical and experimental analysis of the vacuum pressure in a vacuum glazing after extreme thermal cycling. Solar Energy, Pages 1723-1730. doi: https://doi.org/10.1016/j.solener.2009.03.017
ISO. (2021). ISO 19916-3:2021 Glass in building — Vacuum insulating glassPart 3: Test methods for evaluation of performance under temperature differences.
Liu, X., & Bao, Y. (2013). Theoretical and Experimental Studies on Stresses in Vacuum Glazing. Engineering Materials, pp 311-315. doi: http://dx.doi.org/10.4028/www.scientific.net/KEM.591.311
Peng, J., Tan, Y., Fang, Y., Yang, H., Song, A., Curcija, C., & Selkowitz, S. (2024). Excellent Insulation Vacuum Glazing for Low-Carbon Buildings: Fabrication, Modeling, and Evaluation. Engineering. Retrieved from https://doi.org/10.1016/j.eng.2024.11.027
Schwind, G., Paschke, F., & Schneider, J. (2022). Case Studies on the Thermally Induced Stresses in Insulating Glass Units via Numerical Calculation. Challenging Glass Conference Proceedings – Volume 8. doi: https://doi.org/10.47982/cgc.8.388
Simko, T. M.; Fischer-Cripps A. C.; & Collins, R. E. (1998). Temperature-induced stresses in vacuum glazing: Modelling and experimental validation. Solar energy, 1-21.
Simko, T., Fischer-Cripps, A., & Collins, R. (1998). Temperature-induced stresses in vacuum glazing: Modelling and experimental validation. Solar Energy, Pages 1-21. Retrieved from https://doi.org/10.1016/S0038-092X(98)00052-8
Wullschleger, L.; Manz, H.; Wakili, K. Ghazi. (2009). Finite element analysis of temperature-induced deflection of vacuum glazing. Construction and Building Materials, 1378-1388. doi: https://doi.org/10.1016/j.conbuildmat.2008.07.010









Comments
Cool reminder that “insulated” glass still lives in a very dynamic stress world. The real challenge here isn’t just keeping heat out, it’s making sure the glass doesn’t argue with physics while doing it.
subfloor ventilation system