This paper was first presented at GPD 2019 by P. D’Haene and W.M. Stevels from Eastman Chemical Company.
The process for generating a mastercurve can only be executed in a meaningful way for isotropic materials. The generation of mastercurves for multilayer interlayers, such as acoustic skin-core-skin tri-layers, is therefore problematic.
In this paper, the behavior of a glass laminate containing a trilayer interlayer is determined by modelling the glass laminate in bending mode as a five-layer system (glass – trilayer (skin-core-skin) interlayer – glass) using the constituent material properties of the individual layers.
The interlayer modulus, for which a three-layer system (glass-interlayerglass) would behave the same way as the five-layer system for a given temperature and duration, is referred to as the effective modulus of the interlayer. This effective modulus is determined and can be used in conventional FEM software or analytical evaluation to model the behavior of the laminated glass, for a load scenario similar to the conditions for which the equivalent modulus has been calculated.
The effective modulus obtained by modelling in this way should be comparable to a modulus determined through experimentation on actual glass laminates, initial results will be provided.
Introduction
Over the last 15 years several chemical companies have developed a PVB based interlayer with enhanced acoustical properties. In most cases the interlayer consists of a multilayer structure with a relatively softcore layer accounting for the acoustical performance. Both skin layers have rather standard mechanical properties contributing to the excellent product handling and processing and establishing the impact performance of the finale laminate.
However, the presence of the soft-core layer has a significant effect on the mechanical properties of the laminated glass. When applying a load (wind load or other) the deformation will be strongly influenced by the mechanical properties and the relative thicknesses of the constituent layers. The method to be used for considering the effect of the interlayer on the mechanical performance strongly depends on the country specific standard to be applied [1].
However, in most cases a direct measurement of the dynamic properties of the interlayer is preferred. Preferably the latter is achieved using dynamic mechanical thermal analysis (DMTA), which is to be performed either in tensile mode or in shear mode ([2],[3]).
In general, due to the viscoelastic properties of the interlayer, moduli data are measured as a function of temperature and time (or frequency) and transferred to a mastercurve using the timetemperature superposition (TTS) principle. The latter can be applied on rheologically simple materials showing no change in physical or chemical properties in the temperature range considered. For a PVB based interlayer this approach is valid between the glass transition temperature and a temperature close to 90°C.
This maximum temperature limit is mainly determined by the presence of hydroxyl groups in its chemical composition, allowing for the formation of hydrogen bonds and giving to PVB the character of a physically crosslinked structure. As the hydrogen bonds tend to breakdown at elevated temperatures, the assumption of a rheologically simple material can only be maintained till the initial breakdown of this physically crosslinked network.
However, with the presence of a multilayered interlayer, a second problem arises. Both the core and the skin material have different mechanical properties with different glass transition values and a different time/ temperature dependence of the properties of the individual layers. It is currently not clear how this layered structure can influence the applicability of the time temperature superposition principle, when carrying out frequency sweeps at different temperatures on the layered structure directly.
Moreover, DMTA experiments can be conducted in both tensile and in shear mode. For monolithic systems, the properties determined in both modes are linked through the Poisson coefficient. In case of a sandwich structure the simple relationship can no longer be applied. The induced stresses in the interlayer when subjected to a small strain deformation will be completely different in case the sandwich structure is deformed in shear or in tensile mode.
For the latter all layers will be experiencing the same strain value and the stress levels will be strongly influenced by the properties and the thickness of the skin layers. In case of a shear deformation the applied strain will not be identical in skin and core layer and the exact strain levels will be determined by the relative thicknesses of the individual layers and the corresponding mechanical properties.
The purpose of this paper is to investigate the issues mentioned above and to verify in which way DMTA measurements of the mechanical properties of the complete interlayer can be used to predict the deformation of laminated glass under load.
Approach
From first principles it is not obvious whether the time-temperature superposition (TTS), hence the construction of mastercurves, can be applied directly on a layered material structure. To investigate this, mastercurves were generated from dynamic experiments both on the complete sandwich layer as well as on the layers of the product individually.
As the interlayer gets deformed in shear mode (mode II) during bending of a laminated glass panel, the DMTA experiments were also carried out in the same mode. This is of particular importance for the characterization of the complete sandwich structure in which the absolute strain values will be different in the skin and the core. By measuring uniquely in shear mode, it is assumed that the way the strain divides over skin and core will be identical in both the testing mode and the real application.
Rheological mastercurves, expressed under the form of a relaxation spectrum or Prony series, were used in a finite element analysis model for 4 point bending to determine the absolute deformation of the laminate at different temperatures and load scenarios. The results of the deformation, obtained using either the individual layer or the total interlayer assembly approach in combination with the appropriate constituent material function, were compared to verify the validity of the TTS principle applied to the multilayer structure directly. The FE model for 4-point bending was also validated using experimental data.
Experimental work
Dynamic experiments
Dynamic experiments were carried out on two Saflex® Acoustic (QS) interlayers. Two product types, QS31 and QS41, have been used to investigate the effect of the relative thickness of the core vs. skin layer on the generated relaxation spectra. In addition, material functions were also generated for the skin and core layer individually.
Experimentally, frequency sweeps were carried out in a frequency interval ranging from 0.1 rad/s to 100 rad/s. The temperature of the experiment was increased from -30°C to 90°C, starting far below the glass transition temperature of the core layer. The geometry used was a parallel plate set-up, having a diameter of 8 mm. Using a larger plate diameter in combination with low temperature experiments and higher frequencies generally results in an overload of the transducer which is not recommended. For each temperature it was verified that the applied strain was maintained within the linear viscoelastic region. For the dynamic experiments, the shape of the measured sine wave was monitored to assure that no slippage at the interface of the sample occurred.
To verify the potential dependence of the relaxation spectrum on the measuring device experiments were carried out on two different analyzers, i.e. a strain controlled (Ares-G2 from TA Instruments) and a stress-controlled device (DHR3 from TA Instruments). In both cases an adequate temperature control was assured using a convective oven system.
FE modelling
The FE model for the 4-point bending experiment was created in Ansys® Mechanical, according to the geometry used in the experimental set-up (Standard ASTM, C158-2). The size of the glass panel for this set-up was 250 mm long by 38 mm wide (figure 1).

Over the thickness of both the interlayer and the glass the geometry mesh was composed of at least 3 elements. For the cases where the PVB interlayer was modelled using individual material models for core and skin, each layer was modelled over its exact thickness with at least 3 elements as well. For the global material model approach, this configuration and mesh density were maintained but with each layer having identical viscoelastic properties as described by the Prony series derived from the experiments on the global multilayer system. In the latter case the effect of the mesh density on the final deformation was verified to ensure that the result was independent of the mesh size.
Note that the contact between the glass surface and the support roll was defined as being frictionless allowing for the free movement of the edges of the laminate. Sliding of the laminate along the length of the axis of the support roll was prohibited.
In the initial experiment the load was increased from 0 to 50 N on each central roll, in a time frame of 1 sec, and kept constant for the remaining 1800 seconds forcing the interlayer to creep under constant load conditions. The displacement of both the central rolls and the middle of the laminate were monitored as a function of time and compared to the simulated data.
In another set of simulations, the force was applied over a series of time intervals, typical for different load scenarios, and the deformation was determined at the point the load reached it’s maximum value.
Results
Rheological experiments
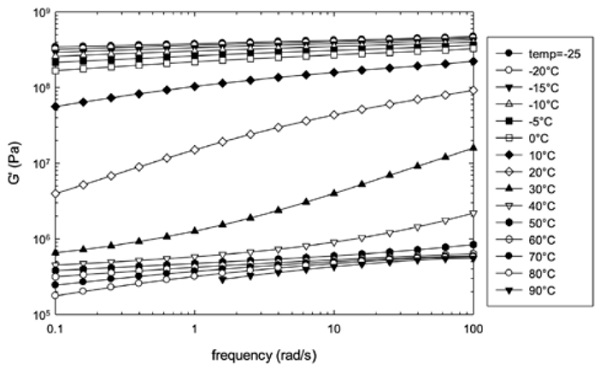
Figure 2 and 3 illustrate the results of the individual frequency sweeps for the individual skin layer and multilayer sample, respectively, in a temperature range between -25°C and 90°C. For the sake of clarity only the storage modulus is shown. For the individual skin layer the curves can be globally grouped into 3 zones: (1) a first zone corresponding to the glassy state in which the modulus hardly changes with the frequency, (2) a second zone, in the temperature range from 10°C to 40°C, where the modulus strongly depends on both frequency and temperature, characteristic for the glass transition zone and (3) a third zone corresponding to the rubbery region with globally the same characteristics as the first zone but positioned at a lower modulus level.
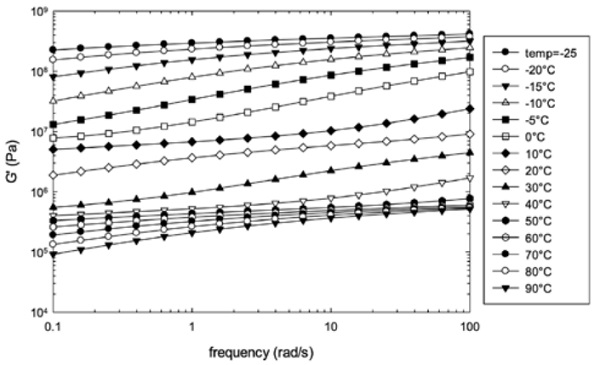
The data for the multilayer (QS41) shows a similar trend except that the extent of the glassy zone is much less pronounced and the transition from the glassy zone to the rubbery zone occurs over a much broader temperature range extending from -15°C to 40°C: this is due to the presence of two glass transitions of the skin and the core layer.
By applying the principle of the time temperature superposition, the measuring range at room temperature can be extended over a much larger time scale. The principle assumes that an increased temperature accelerates the same molecular motions that otherwise would occur more slowly at lower temperature. As the nature of the polymer in both skin and core are identical, similar molecular motions can be expected. Only the kinetics of the motions are to be different due to the difference in free volume between both layers accounted for by a difference in plasticizer content.
The mastercurves, at a reference temperature of 20°C, obtained as a result of the shifting process, for both the skin layer and the multilayer product are illustrated in figures 4 and 5.
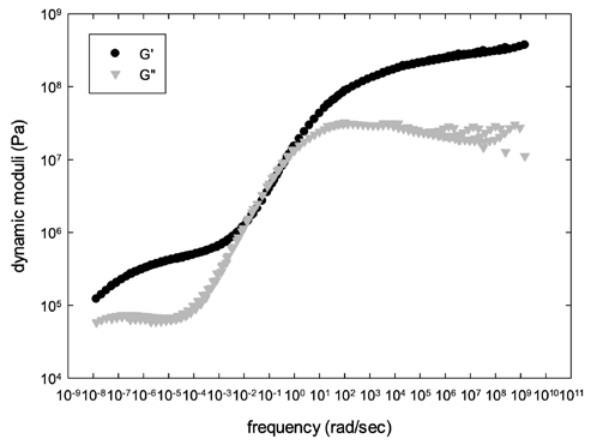
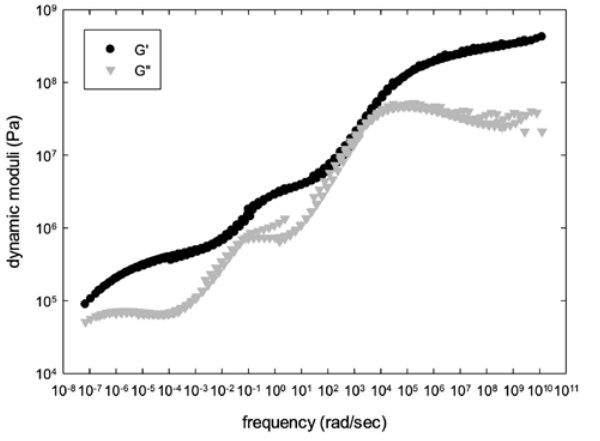
A clear distinction in the shape of the curve can be noticed. In case of the skin layer, or of a single layer in general, a single transition between the glassy and the rubbery state exists. For the multilayer system, on the other hand, an intermediate plateau is present, identifying the presence of two main relaxation mechanisms shifted over the time or frequency range. These can again be related to the presence of two clearly separated glass transitions.
As observed in figure 5, the generation of the mastercurves does not always lead to a smooth curve of the loss modulus. Parts of the curve, especially at the higher frequencies, do not perfectly correlate. This mainly occurs at the highest frequencies in combination with the lower temperature and can potentially be attributed to the compliance of the equipment erratically overestimating the plastic part of the deformation. Fortunately, this lack of correlation will not affect the calculated deformation of the laminate as the mechanical response of the system will be completely determined by the value of the storage modulus which, in this frequency range, strongly overwhelms the loss modulus.
For the multilayer data another weakness in the mastercurve generation process can be observed in the “distortion” of the loss modulus curve near the intermediate plateau. This is an indication that the time temperature superposition principle has a limitation in those cases where the different layers are characterized simultaneously. Again, the effect of this lack of correlation on the Prony series generation will be negligible.
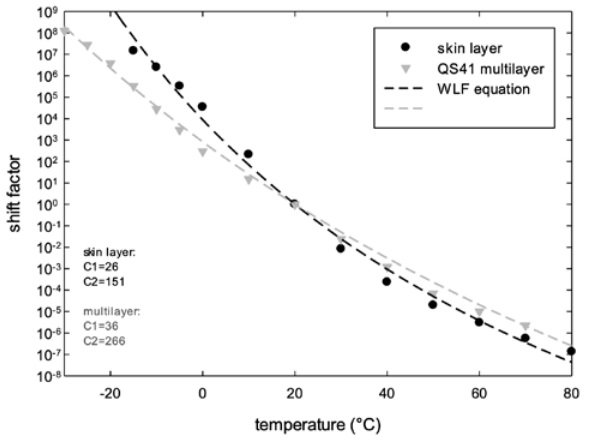
The effect of temperature on the kinetics of the molecular motion is illustrated by the dependence of the shift factor on the temperature. For both the single layer (skin) and the multilayer product these curves are plotted in figure 6. The experimental data are fitted with the WLF equation offering values for the parameter C1 and C2. For the multilayer system the curve is stretched over a larger frequency range as expressed by the larger values of C2. It is expected that the stretching becomes more pronounced in case the difference in Tg values of the different layers increases.
From the mastercurve of the moduli the relaxation spectrum and/or the Prony series can be calculated. Both functions are a mathematical representation of the molecular motion taking place in the polymer which can be described mechanically as a series of Maxwell models [4]:
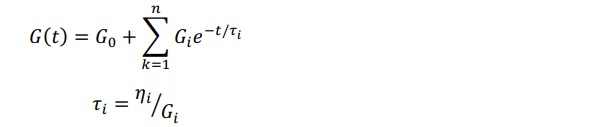
in which the modulus Gi reflects the relative magnitude of each process while the relaxation time τi indicates its timescale.
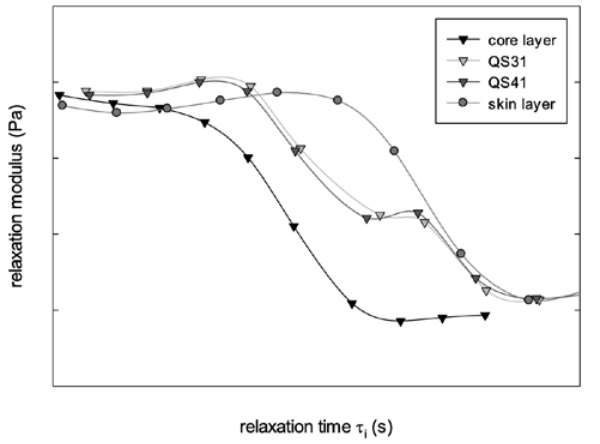
The relaxation spectra as calculated from the experimental data are illustrated in figure 7. The graph shows the spectra for the individual layers of the core and the skin as well as for both multilayer systems QS31 and QS41. From the data it is obvious that the relaxation behavior for the core and the skin layer are occurring at completely different time scales in the sense that the softer core layer relaxes much faster at room temperature.
The relaxation spectra of both acoustical products are identical and not influenced by the difference in relative thickness of the individual layers, at least not in the narrow range considered here. The spectrum of the multilayer is situated between the spectra of the individual layers. The time scale of the slowest polymer motion is closely in line with the mobility of the skin layer. However, the relaxation of the polymer of the core layer, as measured on the multilayer directly, seems to be more restricted leading to a shift of the fastest transition towards longer time scales.
FE modelling
The relaxation spectra as illustrated in figure 7 were used in the FE model to predict the deformation of the laminate in a 4-point bending experiment. The model was validated by means of an experimental 4-point bending test, using a 33.2 configuration, at a temperature of 27°C.
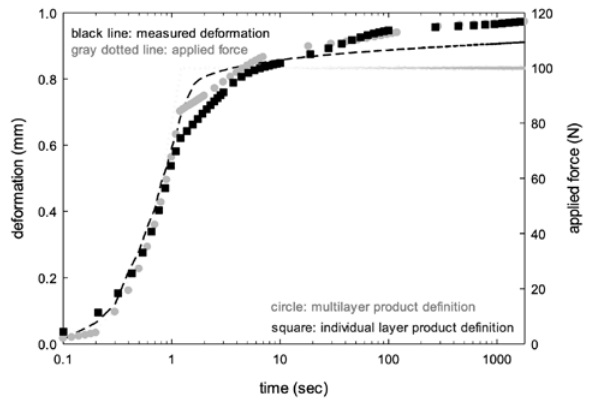
Figure 8 shows a comparison between the experimental data and the calculated results from the FE model. The curve of the load illustrates the increase in force on the laminate, from 0 N to 50 N, occurring in a timescale of 1 sec and kept constant for the remaining 1800 sec. The experimental deformation data, as measured in the middle of the laminate, follow the increase in force closely followed by a zone of continuous creep characterized by a deformation increasing linearly in time.
Although the predicted data from the model are in close agreement with the experimental values some minor deviations are observed. The model slightly underpredicts the instantaneous deformation of the laminate and tends to overpredict the creep performance. The final predicted deformation is nearly 10% higher than the measured value for this configuration and experimental conditions. Note also that the predictions based on the individual material model and the multilayer model are in good agreement. While the values of the final deformation are identical, a small discrepancy is present in the elastic response with the individual layer-based approach showing a stiffer dynamic behavior.
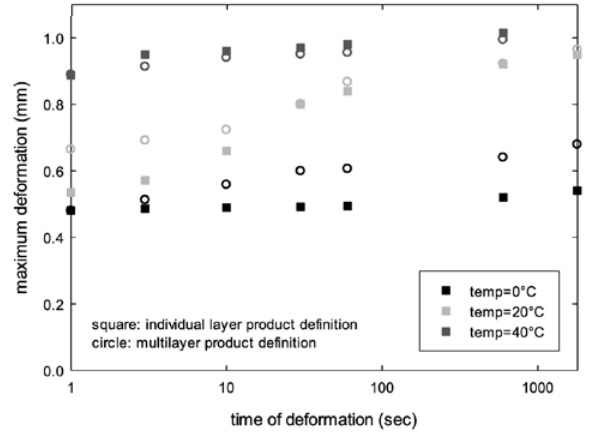
These discrepancies are also shown in figure 9. The data represent the calculated deformation of the laminate when applying a force at different time scales, either using the individual layer product definition or the relaxation spectrum from the multilayer experiment. Depending on the load scenarios and the temperature different observations can be made. At high temperatures or larger time scales both sets of data are in good agreement. This corresponds to the situation in which both glass panels are mechanically decoupled and almost no stress is transferred across the interlayer. Hence, potential differences in the mechanical properties resulting from the different approaches have hardly any influence on the stiffness of the structure.
At lower temperatures and/or shorter time scales the individual layer approach predicts a smaller deformation, in line with the stiffer character of the laminate. In the worst case the difference in predicted stiffness is close to 20%. At the time of writing, no 4-point bending experimental data are currently available at lower temperature to verify the predicted data. However, from the curve in figure 8, it can be concluded that the highest value of the direct deformation prior to creep is in closest agreement with the experimental observations. This would mean that the calculation of the relaxation spectrum based on the dynamic characterization of the multilayer, in shear mode, is a valuable approach and applicable for engineering calculation of laminated glass strength.
Conclusions
Currently, there is a lack of information on the mechanical properties of a PVB-based acoustical interlayer having a multilayer structure. Theoretically the most accurate way to predict the stiffness of a laminated glass panel is to model each individual layer separately and attribute to each layer the appropriate material function. However, this approach is not feasible with each FE calculation package. Moreover, no mechanical properties of the core layer in isolation have been published, as this is confidential information.
An alternative approach is proposed here in which the interlayer is characterized as one entity in a DMTA measurement, using a mode II deformation, and from which the relaxation spectrum of the assembly is derived. It was demonstrated, using a combination of both experimental data and FE modelling, that this approach leads to a reliable prediction of the stiffness of a laminated glass panel and that the results are in line with the theoretically sounder approach of individual layer definitions.
References.
[1] Stevels, W.M.: PVB interlayer modulus properties in contemporary European standards. In: Proceedings Glass Performance Days (Tampere Finland), 2019.
[2] International Organization for Standardization: ISO 6721-1 Plastics – Determination of Dynamic Mechanical properties, Part 1-12 (2011).
[3] European Committee for Standardization: prEN 16613 Glass in Building – Determination of interlayer mechanical properties (2013).
[4] Ferry, J.D.: Viscoelastic properties of polymers. 3rd Ed. Wiley, New York, 1980.