First presented at GPD 2017
Interlayer modulus influences the stress laminated glass experiences under load. The determination of interlayer modulus data is complex, and the design engineer would rely in most cases on interlayer modulus properties as determined on the foil, as published by the interlayer producers.
For a structural PVB type interlayer, the modulus values of the interlayer as expressed in laminated glass, have now been determined using torsional glass laminate testing on specimens of 360 * 1100 mm. Load cases at 0 °C, 23 °C and 40 °C have been studied for durations up to one month, covering many conventional load scenarios as experienced by buildings. In addition, allowable modulus values for design for this PVB type have become available through a recent German national approval for fixed load scenarios, and more flexibly for other load scenarios, through a Prony-series approach.
This paper aims to present the different type of modulus data that have recently become available in terms of conventional load scenarios, and analyze the effect of different modulus data sources on effective thickness. This allows the design engineer to make an informed choice around modulus data used for modelling, and choose values as appropriate for specific project design.
Introduction
Interlayer modulus properties are typically determined through measurements on the interlayer film directly using some form of dynamic mechanical analysis. Data are collected at various temperatures, over a range of frequencies e.g. typically in a 0.1 to 100 Hz range, see e.g. ISO 6721 (Plastics - Determination of dynamic mechanical properties) [1], or specifically for interlayers in prEN 16613 (Determination of interlayer mechanical properties) [2].
Some specific recommendations have been made based on a comparison of different methodologies for interlayer materials [3, 4, 5], and references cited therein. As interlayers are viscoelastic materials, the modulus of the material is a function of time (load duration) and temperature. The combined results of the measurements are translated to a so-called mastercurve of the material at a specific temperature using time-temperature superposition.
This allows the determination of interlayer modulus values under load durations that far exceed the frequency domain over which the measurements took place. For this approach to be valid, it is important that the materials are rheologically simple, and no combination of physical processes, such as moving through both a glass-transition and melting temperature, should take place during the measurement or in the timetemperature range to which the properties are transposed [6]. Schneider et al. [7] concluded that poly(vinylbutyral) (PVB) materials are rheologically simple in contrast to some other interlayer materials e.g. poly(ethylene-covinylacetate) or poly(ethylene-co-methacrylic acid).
Structural or stiff PVB interlayers have only recently found wider use in structural and other glass applications [8]. Thus far, no data are available that compare the modulus properties as determined on the interlayer to values determined directly in laminated glass for this class of materials. Torsion tests are one test procedure that can be used for the determination of interlayer modulus values as a function of time and temperature.
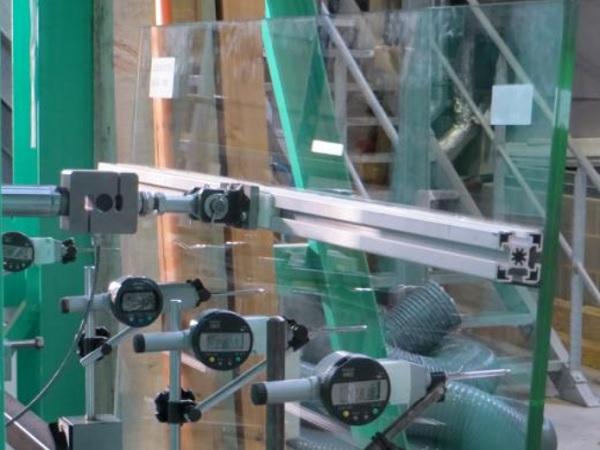
Other forms of testing are available, such as 3- or 4-point bending studies, or deformations in a circular geometry (ring clamping), but torsion testing has the advantage that it leads to very uniform deformation of the specimens, and clamping effects can be minimized. After installing, aligning and fixing a 3600 * 1100 mm laminated glass pane, a specimen is torsion twisted using displacement-controlled loading up to a twist angle of 2°. A schematic representation is given in Figure 1.
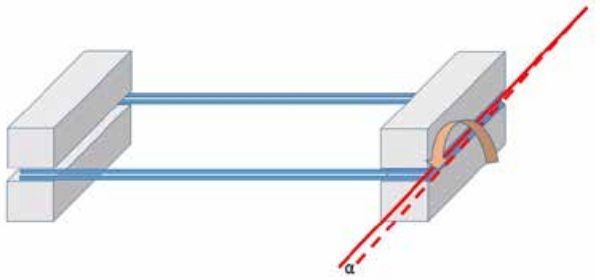
The twist angle α is maintained for the duration of the experiment and at the same time, the corresponding reduction of the applied force necessary to maintain the angle is measured digitally. This methodology was developed by Kasper [9], and improvements were proposed later [10]. Experiments of this nature were executed for a structural PVB interlayer at 0 °C, 23 °C (up to one month) and 40 °C (one hour). This comprises a wide range of potential load scenarios for buildings.
With modulus data available from different sources, such as different DMA methods, methods using glass laminates and data provided in standards in standards and national approvals, it becomes important to develop an understanding of the relevance of different modulus values for glass design. Therefore, this paper will examine the effect of different interlayer modulus data sources on effective thickness.
Experimental
To prepare the experimental glass laminates for torsion testing, two nominally 6 mm glass panes of 3600 * 1100 mm were laminated with two layers of 0.76 mm Saflex® DG41 structural interlayer to a total thickness of 1.52 mm interlayer in a nip-roll process.
Two different test set-ups for the execution of the torsion measurements were used at two different independent research institutes, one with the glass laminates mounted horizontally (set-up 1, experiments at 23 and 40 °C, annealed glass (EN 572)) and one with laminates mounted vertically (setup 2, 0 and 23 °C, strengthened glass (EN 1863)). In both cases, experimentation was executed in a temperature controlled, isolated chamber.
Temperature control to within 1.5 °C was achieved, and multiple temperature monitoring points were set-up for use during experimentation. At least 3 samples were tested under each measurement condition. In both set-ups, monolithic glass specimens of 12 mm thickness were used as control species, specifically for slip during experimentation. A detailed description of the experimental testups, data treatment and individual experiments is beyond the scope of this article. In general, the approach taken in [9] was taken. The results of the two test-ups at 23 °C were very similar. The data of set-up 2 were used for this article for the experiments at 23 °C.
Dynamic mechanical analysis (DMA) was used to measure modulus values directly on the film using a Discovery HR-2 hybrid rheometer using an 8 mm plate/plate characterization. An extensive overview of measurement details and data transformation was published [4].
Results and discussion
1. Τorsion test data
An overview of the modulus data generated using the torsion set-up on laminates, and the data generated using DMA is given in Figure 2. Data for torsion relaxation under one minute are not readily accessible using torsion testing, as during the time required to apply the angle, relaxation also occurs. Therefore, data are presented for durations of one minute and longer.
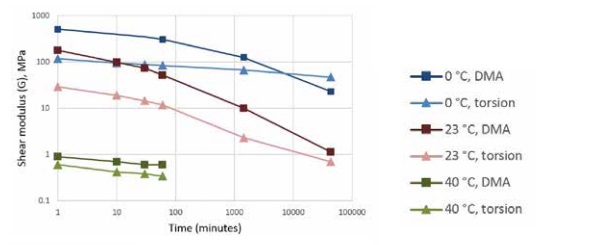
A viscoelastic reaction of the interlayer can be seen in all torsion tests. Τhe generic shape of the curves at 23 and 40 °C is very similar in nature to the shape of the curves from the DMA measurements, whereas the torsion curve at 0 °C is relatively flat. It is unclear at this point why this would be the case, but the high rigidity of the assembly under the measurement conditions may play a role. From a glass design perspective, the interlayer in glass at 0 °C still behaves very rigid in a glass laminate, and essentially full shear transfer is a realistic assumption for durations up to at least 1 month, whichever measurement method is used.
In general, the modulus values determined in torsion testing of laminates are lower than those determined using DMA directly on the film. Given the very different nature of these experiments in terms of sample size, type of deformation applied, time scale of the experiment and data treatment, it is not surprising that differences would occur. Rather than trying to consolidate the data, we wanted to explore the effect of different modulus data sources on glass design and different load scenarios will be assumed, each at their specific duration and temperature.
The required modulus data are not always available from the torsion test data as they are non-continuous in nature. Generating curves over a wide range of temperatures is very cumbersome and requires lengthy experimentation. Even if this effort made, the short term modulus values are not accessible because of the experimental constraints. Therefore, we decided to use the data from a German nation approval as a conservative proxy for the torsion test data. This is illustrated in Figure 3.
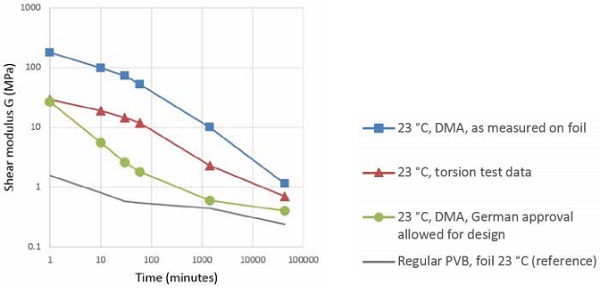
The data from the German national approval were always more conservative than the torsion test data, and since a Prony series is provided, modulus values can be calculated with any load scenario, as long as the boundary conditions for time and temperature are respected. Over the entire duration range, the data of structural PVB are significantly higher than of a regular PVB type, even if the conservative German data are taken.
As compared to the data measured in a glass laminate, the difference is close to a decade in modulus values over the entire duration, even more for the data obtained in the same way, directly measured on the foil. This is a clear indication of the design possibilities of structural PVB’s.
2. Modulus and effective thickness
Before exploring the effect of different sources of modulus data on the design, it is helpful to develop an understanding of the effect of interlayer modulus on glass behavior. This can be done using FEM modelling, or analytically in an effective thickness approach. In the effective thickness approach, the thickness of a monolithic glass is calculated that would behave as the laminate for stress or deflection.
Details of this well-known approach are e.g. provided in their basic form in standards such as ASΤM 1300 Annex X9 [12] and prEN 16612 [13]. More refined approaches are available [14, 15]. In contrast to FEM methods, the results are readily reworked by others. In Figure 4, the effective thickness for stress and deflection is plotted as function of interlayer modulus for a 66.2 configuration with a short side of 2 m as calculated per ASΤM 1300 Annex X9.
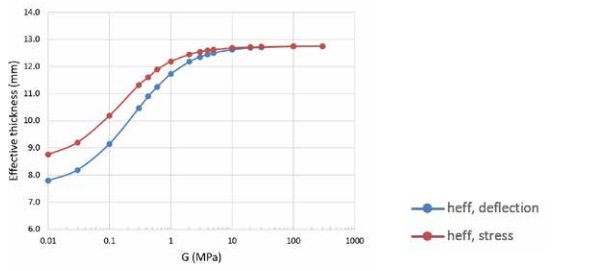
It can be calculated that 70 % of the potential increase of effective thickness for stress is achieved at a modulus of around 0.4 MPa, and 90 % of the potential increase of effective thickness at 2 MPa. For a configuration with short side of 1 m, these values would be 1.5 and 5 MPa respectively, and for a relatively unfavorable scenario of 1212.4 configuration with a short side of 1 m, these values would be 5 and 20 MPa respectively. Although the values of 70 and 90 % have been chosen arbitrarily, high absolute interlayer modulus values are not required to drive significant increases in effective thickness, and ultimately glass design.
3. Selecting modulus data for design
To assess the effect of using different sources of modulus data for structural PVB, load scenarios had to be assumed. Although these tend to vary by applicable standard and code, use class, and other building related aspects, common load scenarios include wind loads, live loads, snow loads and climate loads. As a reference, the load scenarios provided in prEN 16612 were used as general guidance [13]. An overview is provided in Table 1. As structural PVB can be classified as an interlayer from the highest stiffness family, the associated default shear transfer coefficient is listed for each load scenario for this stiffness family.
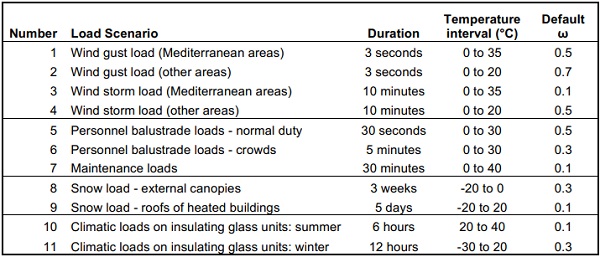
* load scenarios taken from the latest draft version available to the author, subject to change
Table 2 lists the different values of the modulus associated with each of these load scenarios as available from 1) DMA data as provided by the producer, 2) calculated allowable for design values from a German national approval, 3) minimum values for G required for classification in stiffness family 3. In the latter case, the relation between Young’s modulus E and shear modulus G was taken as G= E/3, assuming a Poisson ratio of 0.5 for the interlayer.
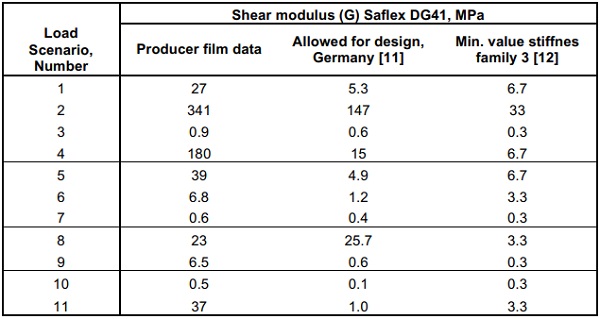
The absolute values can differ substantially, with the absolute values almost always the highest for the directly measured material properties, as expected. The allowed values for design in Germany and the minimum required in European standard are relatively close in most cases. Since the absolute modulus values do not drive glass design, but rather the extent to which the modulus values are high enough to drive shear transfer between the glass design, these modulus values were translated to effective thickness increases.
The load scenarios of Table 1 were used to calculate the effective thickness increase of a 1212.4 configuration with a 1 m short side using the modulus values in Table 2, except in the case of prEN 16612, where the default ω values were used. The configuration used is one where the conditions for shear transfer are relatively unfavorable (thick glass, thick interlayer, smaller pane), as a conservative approach.
These results were expressed as a fraction of the maximum effective thickness increase as calculated for hypothetical modulus values of G = 0.001 MPa for the lower limit and G = 1000 MPa as the upper limit. These values correspond to an effective thickness for stress of 17 and 25.5 mm, respectively. The results are expressed in Figure 5.
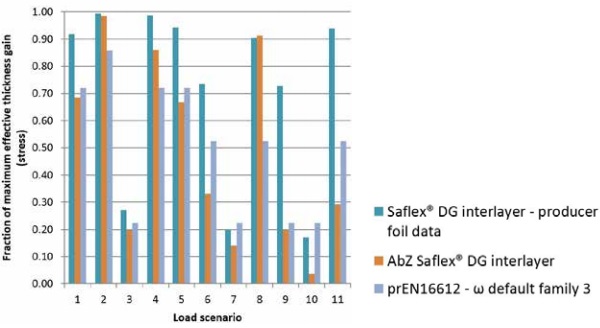
Although the effective thickness gains vary as a function of the data source, the variation is far smaller than the variation in the modulus values themselves, because of the non-linear relation between modulus and effective thickness. In most cases, any of the three data sources could have been used, without major impact on the glass design. The one exception is likely the load case of snow loads of heated buildings, where the film data are above the threshold for significant shear transfer, and the more conservative values are below (load scenario 9).
In case like this, some additional design space may be created by reviewing the actual glass temperature of the glass pane under load, or a further review of load scenario in terms of the duration or value of the snow load. Significant effective thickness increases are observed for most of the load scenarios, as an effective thickness increase of 25 %, in this case corresponding to 2 mm glass, bridging the gap to the thickness of the next available thinner glass grade (12 to 10 mm).
Of course, the benefits are relatively smaller for longer duration and/or higher temperature load scenarios. In these cases, it is important to review if these load scenarios are also the design limiting load scenarios and/or review the calculations for the actual glass configuration and dimensions, as Figure 5 was generated as a conservative example.
Conclusions
The rigidity of structural PVB interlayers as characterized by their shear modulus could be confirmed in laminated glass specimens through torsion testing. The torsion test values are in between the data measured directly on the foil, and the modulus data in the German national approval or the minimum values in prEN 16612 for a structural interlayer. Torsion testing is less suitable to generate modulus values for a broad range of load scenarios because of limitations in duration (short term loads) and lengthy experimentation at each temperature of interest.
For most design situations, there is limited impact of the choice of source for modulus data for structural PVB, and data are available from independent resources. This should help design engineers and others involved with glass design to explore the benefits of this class of relatively new materials with confidence.
References
[1] International Organization for Standardization: ISO 6721-1 Plastics – Determination of Dynamic Mechanical Properties_Part 1-12 (2011).
[2] European Committee for Standardization: prEN 16613 Glass in Building – Determination of interlayer mechanical properties (2013).
[3] Kuntsche, J.; Schuster, M.; Schneider, J.; Langer, S.: Viscoelastic properties of laminated glass interlayers – theory and experiments. In: Proceedings Glass Performance Days (Tampere Finland), 2015, pp. 143-147
[4] Zhang, P., Stevels, W., Haldeman, S., Schimmelpenningh, J.: Shear modulus measurements of structural PVB interlayer and prEN 16613. In: Proceedings Glass Performance Days (Tampere Finland), 2015, pp. 148-152.
[5] Stevels, W.; D’Haene, P.; Zhang, P.; Haldeman, S.: A comparison of different methodologies for PVB interlayer modulus characterization. In Proceedings Challenging Glas 5, Bos, F.; Louter, C.; Belis, J. (eds), Gent, 2016.
[6] Ferry, J.D.: Viscoelastic properties of polymers. 3rd Ed. Wiley, New York, 1980
[7] Schneider, J.; Kuntsche, J.; Schuster, M.: Mechanical behavior of polymeric interlayers. In: Proceedings Glas im konstruktiven Ingenieurbau 14 (Munich Germany), 2016, Chapter 16.
[8] Stevels, W., Haller, M.: Glasdesign mit steifen PVB-folien für den konstruktiven Glasbau: Eine aktuelle Perspective. In Glasbau 2017 (Dresden, Germany) 2017
[9] Kasper, R.: Tragverhalten von Glasträgern. Dissertation RWTH Aachen, Aachen Germany 2003
[10] Callewaert, D., Belis, J., Van Impe, R., Lagae, G., Vanlaere, W.: refined set-up for pure torsion of laminated glass. In: Proceedings Glass Performance Days (Tampere Finland), 2007, pp. 118-121
[11] German building institute: VerbundSicherheitsglas aus der Produktfamilie Saflex DG mit Schubverbund. Generic building approval Z-70.3-230, Berlin 2016
[12] ASTM International: ASTM E1300 -12a: Standard Practice for determining the load resistance of glass in buildings (2012).
[13] European Committee for Standardization: prEN 16612 Glass in Building – Determination of the load resistance of glass panes by calculation and testing (2013).
[14] Galuppi, L., Royer-Carfagni, G.: The effective thickness of laminated glass plates. Journal of Mechanics of Materials and Structures, 7: 375-400, 2012
[15] Galuppi, L., Manara, G., Royer-Carfagni, G.: Practical expression for the design of laminated glass. Composites, part B: engineering, 45: 1677-1688, 2013