This paper was first presented at GPD 2019 by Michael Härth, Stephen J Bennison and Steven R Sauerbrunn.
Essential to the proper simulation of laminated glass behavior is the development of accurate constitutive models for the polymer interlayer. Such models should reflect polymer behavior as a function of temperature and load duration so calculations may be made that reflect the design load case of interest. In this contribution we present several approaches to the determination of interlayer shear relaxation modulus behavior.
Results from test methods based on dynamic mechanical analysis (shear, parallel plate geometry) are compared and contrasted. Two key finding are reviewed: 1) proper sample conditioning and preparation, 2) minimization of sample deformation during testing. We show that self-consistent results may be obtained from different test geometries provided these two issue are carefully managed. A key element of any evaluation program is independent validation of the results. Here we examine the use of four-point bend testing of laminated glass beams for such validation checks.
Introduction
Many computational tools and approaches are now available to model the deformation of laminated glass [1-7]. Indeed the development of such tools has played a key role in the expanded use of laminated glass beyond its traditional function as a safety glazing to applications as structural elements in a façade or building. Although these tools vary in approaches, from simple analytical approximations to detailed, complex finite element methods all require accurate materials properties. Polymers used in laminated glass demonstrate complex viscoelastic behavior where the stiffness behavior is influenced by temperature and the time-scale of the load action.
It is 20 years since the first publications of research into the viscoelastic properties of PVB polymers and associated behavior of laminated glass made with such polymers [6, 7]. This work used tensile-mode dynamic mechanical analysis (DMA) to extract the underlying shear relaxation modulus, G(t), of PVB. Incorporation of these properties in a finite element model proved to be capable of predicting the deformation of laminated glass in various geometries and loading scenarios. These studies have been repeated by other groups and essentially validated [8].
Since this early work we have seen the introduction of other polymer interlayers beyond the standard PVB developed for traditional impact glazing applications. Such interlayers span a range of mechanical behavior from the stiffest, structural polymers such as ionomers to the most compliant, damping polymers, such as acoustically enhanced multilayer PVBs. This complexity in material behavior has resulted in additional challenges to the accurate determination of the shear relaxation modulus behavior needed for design calculations.
We have seen some reported variability in test results that has raised questions about the best method for characterizing polymer interlayers [9]. In addition to this complexity we have seen a trend that promotes using the polymer storage shear modulus, G’, in structural calculations of laminated glass. This is incorrect. The storage shear modulus, G’, shows higher values than the relaxation shear modulus, G(t). Therefore, structural calculations of laminated glass behavior using G’ will predict better performance than reality since this approach does not take into account polymer relaxation during loading.
In this paper we present our approach to the determination of the shear relaxation modulus, G(t), for polymer interlayers. We focus on several key issues: 1) proper sample conditioning and preparation, 2) minimization of sample deformation during testing, 3) methods for TTS analysis and accurate extraction of G(t), 4) validation of results using beam bending experiments. We show that self-consistent results for a specific class of interlayer may be obtained from different test geometries provided these issues are carefully managed. In addition we include examples of the differences between G’ and G(t) for a series of PVB-based polymers.
Experimental section
Materials
In order to cover a wide range of various interlayer product stiffness, three commercial PVB interlayers, Trosifol® SC Monolayer, Trosifol® UltraClear and Trosifol® Extra Stiff, were investigated in this study. The main difference between these interlayers is the overall plasticizer content, ranging from high for SC Monolayer, through medium for UltraClear, to low for Extra Stiff. Glass transition temperatures (1 Hz, 3 K·min-1, linear range of deformation) were determined as 20 °C for SC Monolayer, 32 °C for UltraClear, and 47 °C for Extra Stiff, respectively.
Sample Preparation
The key issue with sample preparation is to ensure that the polymer film undergoes the same thermal history experienced during laminated glass fabrication. This results in the polymer attaining its correct equilibrium state prior to testing. For example, some polymers exhibit finite shrinkage during heating to the autoclave temperature. If this happens during testing, the associated change in signal (force) is interpreted as a change in mechanical behavior. We have taken two approaches to this requirement.
Free-Standing Polymer Films
Film samples with nominal thickness of 0.76 mm were laid-up with PET separation sheets between the PVB and glass and exposed to the standard lamination process to remove shrinkage and surface structure of the PVB. Processed PVB film was subsequently peeled from the PET release sheets and specimens (diameter 8 mm) were cut from this freestanding film and then dried in a desiccator at 23 °C for at least 48 hours prior to testing. This results in moisture levels below 0.2 wt.%, which improves measurement repeatability and avoids bubble formation at high DMA test temperatures.
Thin-Glass Laminates
glass plates and exposed to the standard lamination process. Laminated glass test samples (8 mm disks) were subsequently cut from the thin-glass laminate using water-jet cutting.Sample PVB films with nominal thickness of 0.76 mm were laid-up between 0.7 mm “thin” glass plates and exposed to the standard lamination process. Laminated glass test samples (8 mm disks) were subsequently cut from the thin-glass laminate using water-jet cutting.
Test Methods
A series of test methods have been employed to characterize the shear relaxation properties of several PVB-based interlayer materials.
Dynamic Mechanical Analysis (DMA)
Testing has been carried out at two different laboratories using two different test geometries and two different sample types.
Kuraray Troisdorf Germany: Free-Standing Polymer Film Samples
Dynamic-Mechanical-Analysis were conducted with an Anton Paar MCR 302 rheometer in plate/plate mode. Specimen loading was performed at 70 °C in such a way that the metal mounting plate was moved towards the specimen with constant velocity (1 µm·s-1) until a normal force of 10 N had been attained. After that the normal force was set to 0.4 N and the rheometer was heated up to 120 °C and then cooled to the lowest test temperature of -20 °C. This procedure enabled the required adhesion between metal mounting plate and PVB specimen. Frequency sweeps were conducted within the linear range of deformation (maximum 0.1% strain) and with a normal force of 0 N to avoid specimen deformation during measurement. Temperature was varied between -20 °C and 105 °C with 5 °C steps.
University of Delaware (UoD), USA: Thin-Glass Laminate Samples
Dynamic-Mechanical-Analysis was conducted with a TA Instruments rheometer in plate/ plate mode. Note that a thin-glass laminate sample was glued to the mounting plates using a high-temperature epoxy. Specimen loading was performed at room temperature and the normal force maintained at 0 N throughout the test. Samples were cooled to the lowest test temperature of -20 °C and temperature frequency sweep started. Frequency sweeps were conducted within the linear range of deformation (< 0.1% strain) and with a normal force of 0 N to avoid specimen deformation during measurement. Temperature was varied between -20 °C and 105 °C in 5 °C steps.
Dynamic-Mechanical-Analysis was also conducted with a Mettler Instruments DMA in shear mode. Note that the thin-glass laminate (8 mm disk) sample was glued to the mounting plates using a high-temperature epoxy. Specimen loading into the sample holder was performed at the lowest test temperature of -20 °C. Minimum clamping force was applied to the samples during mounting in order to minimize polymer deformation during testing. Frequency sweeps were conducted within the linear range of deformation (< 0.1% strain) and temperature was varied between -20 °C and 105 °C in 5 °C steps.
Four-Point Bend Test
Four-point bend tests were carried out as a check of the shear modulus evaluation results from DMA testing. These tests were carried out at two independent test labs: 1) Bundeswehr University Munich and 2) Friedman and Kirchner test labs. The tests consist of measuring the deflection of laminated glass beams and relating the loaddeflection behavior to the shear modulus using finite element modeling. A discussion of the applicability of this inverse method is given elsewhere [10].
Extraction of Master Curve and Shear Relaxation Modulus
Methods for Time-Temperature-Superposition (TTS) analysis have been well-reviewed [6- 9]. Two key points to note: 1) only horizontal shifting was used to establish the master curve, and 2) evaluation of G(t) and associated linear viscoelastic spectra was achieved following Baumgärtel and Winter [11].
Results and Discussion
Comparison of Different Methods and Laboratories
Figure 1 gives an example of measurement comparisons for Trosifol® Extra Stiff from two different DMA geometries, shear and parallel plate, and two different laboratories, Kuraray Troisdorf and the University of Delaware.
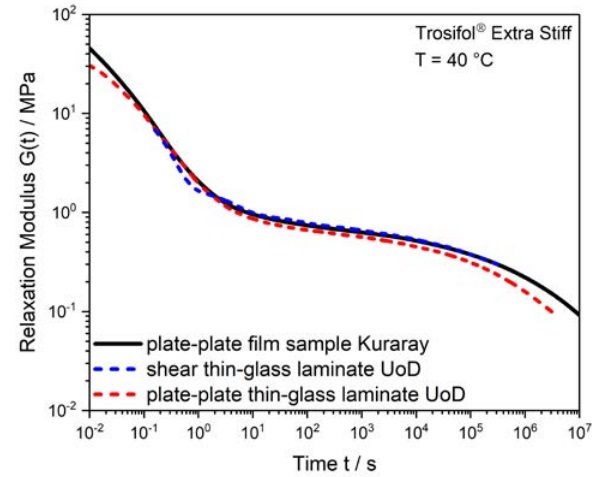
As can be seen from the results, both DMA methods agree well and there is good consistency between the two laboratories.
Shear Relaxation Modulus G(t) and Shear Storage Modulus G’ Comparisons
Figure 2 gives an example of comparisons for Trosifol® Extra Stiff of G(t) and G’ derived from parallel plate DMA measurements.
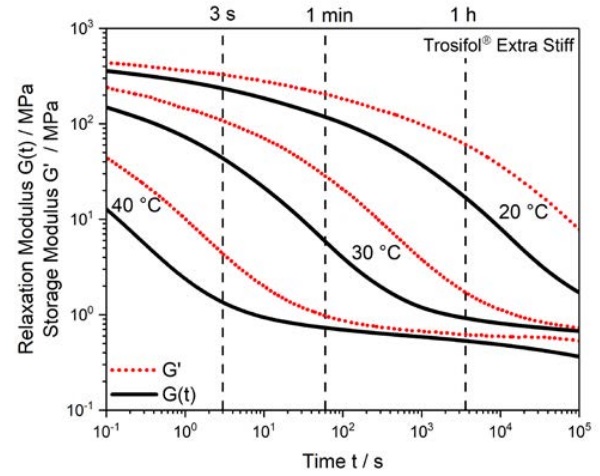
As can be seen, G’ is always greater than G(t). The deviation of G’ from G(t) is an indication of the amount of polymer relaxation occurring at a specific relaxation time (load duration) and temperature. Table 1 gives some numerical values of G(t) and G’ for Trosifol® ES that further demonstrate this point.
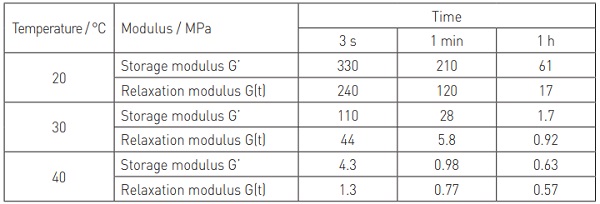
Figure 2 and Table 1 demonstrate that the difference between G(t) and G’ can be considerable (up to a factor of 5 in some instances). The deformation of laminated glass plates is dependent on the shear relaxation modulus, G(t), of the interlayer. If the interlayer shear storage modulus, G’, is used for calculation purposes then the prediction will be inaccurate. Indeed the calculation could be seriously non-conservative depending on the load duration, temperature and deviation between G(t) and G’.
Validation Using 4-Point Bend Tests
Ultimately, the shear properties derived from the measurements described need to be useful for the simulation of laminated glass deformation. Accordingly, we have compared our DMA results to estimates of the shear modulus extracted from 4-point bend tests carried out at the Bundeswehr University Munich.
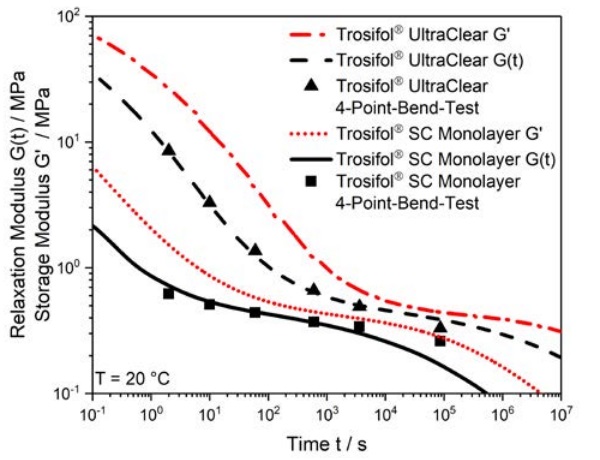
As can be seen from Figure 3, there is good agreement between results from 4-point bend tests and results from DMA measurements. The comparison further support the use of G(t) in the computation of laminated glass deformation behavior.
Conclusion
We have shown that reliable, self-consistent shear relaxation modulus, G(t), properties of polymers for laminated glass may be measured providing several important guidelines are followed. The results have also been validated against evaluation from 4-point bend tests. Furthermore, we have demonstrated the importance of using G(t) in the computation of laminated glass deformation behavior.
Acknowledgements
The authors thank Dr. Michael Kraus (Bundeswehr University Munich) for performing the 4-point bend tests and for fruitful discussions.
References
1. J. A. Hooper, “On the bending of architectural laminated glass,” Int. J. Mech. Sci., vol.15, pp.309–23, (1973).
2. I. Calderone, P. S. Davies, S. J. Bennison, H. Xiaokun and L. Gang “Effective Laminate Thickness for the Design of Laminated Glass,” presented at Glass Performance Days, Tampere, Finland, (2009).
3. L. Galuppi and G. Royer-Carfagni, “Effective Thickness of Laminated Glass Beams. New expression via a Variational Approach,” Eng. Struct., vol.38, pp.53-67, (2011).
4. L. Galuppi and G. Royer-Carfagni, “The effective thickness of laminated glass plates,” J. Mech. Mat. Struct, vol.7, pp.375-400, (2012).
5. L. Galuppi and G. Royer-Carfagni, “Practical expressions for the design of laminated glass,” Compos. Part B - Eng., vol.45, pp.1677-1688, (2013).
6. Bennison, S.J., Jagota, A. & Smith, C.A., (1999) “Fracture of Glass/Polyvinyl Butyral (Butacite®) Laminates in Biaxial Failure,” J. Am. Ceram. Soc., 82[7] 1761-70.
7. Van Duser, A., Jagota, A., Bennison, S.J. (1999) “Analysis of Glass/Polyvinyl Butyral (Butacite®) Laminates Subjected to Uniform Pressure” Journal of Engineering Mechanics, ASCE, 125[4] 435-42.
8. Kuntsche J., Schuster M., Schneider J., and Langer S., “Viscoelastic Properties of Laminated Glass Interlayers – Theory and Experiments,” Glass Performance Days 2015, pp 143-147.
9. Zhang P., Stevels W., Haldeman S.V., Schimmelpenningh J.C., “Shear Modulus Measurements of Structural PVB Interlayer and prEN 16613,” Glass Performance Days 2015, pp 148-52.
10. Shitanoki Y., Bennison S.J. and Koike Y., “A practical, nondestructive method to determine the shear relaxation modulus behavior of polymeric interlayers for laminated glass,” Polymer Testing 37 (2014) 59–67.
11. Baumgärtel M, Winter HH (1989). “Determination of the discrete relaxation and retardation time spectra from dynamic mechanical data.” Rheol Acta 28:511519.