
Authors: Karoline Osnes, Odd Sture Hopperstad & Tore Børvik
Source: Engineering Structures, Volume 212, 1 June 2020 | https://doi.org/10.1016/j.engstruct.2020.110516
Highlights
- A strength prediction model for glass has been extended to include rate dependency.
- The model has been validated against experimental tests.
- The tests include quasi-static and dynamic tests on monolithic and laminated glass.
- The fracture strength and point of fracture initiation varies in the tests.
- The model manages to successfully capture many trends observed in the tests.
Abstract
Glass is a brittle material known to possess large scatter in its fracture strength, which is caused by the existence of microscopic surface flaws. Fracture in glass generally originates from stress concentrations around these flaws, which cause the fracture strength to be dependent on the flaw properties and the stress state on the glass surface. The fracture strength is also reported to increase with the loading rate. The current study aims to determine the probabilistic fracture strength of glass plates exposed to arbitrary loading and loading rates by a proposed rate-dependent strength prediction model (SPM).
The SPM is based on the existence of microscopic surface flaws, and performs virtual experiments on glass plates through Monte Carlo simulations. To validate the SPM in some measure, we performed quasi-static punch tests and low-velocity impact tests on monolithic and laminated glass. The experimental work clearly demonstrated the stochastic fracture strength of glass, in addition to the load-rate dependency. The SPM managed to capture many of the trends observed in the experiments, such as the increase in fracture strength with the loading rate and the positions of fracture initiation in the glass.
1. Introduction
The use of glass in buildings has increased significantly over the past few decades. Traditionally, glass has only been used as a window component inside a load-carrying frame, but in modern designs, glass is frequently being used for load-carrying elements, such as roofs, beams, columns and floors [1], [2]. This development has introduced new challenges to the structural design process, and calls for a better understanding of glass’ load-carrying capacity. In addition, if the structure is required to withstand extreme loading, such as blast or impact, the rate dependent nature of glass fracture will further complicate the design process. Laminated glass is often used as opposed to monolithic glass when additional capacity and safety are required. Laminated glass consists of two or more glass plates bonded together by a polymeric interlayer, and is able to maintain some structural integrity even after glass fracture [3], [4], [5].
Glass is a brittle material known to possess a highly stochastic fracture behaviour caused by the presence of microscopic surface flaws [6]. Fracture generally initiates in these flaws under tensile loading, and the fracture strength of glass is therefore dependent on the flaw properties and the applied stresses. As a result, the probability of fracture in glass is dependent on the geometry, the boundary conditions and the loading history. Fracture in glass originates from an amplification of stresses around the surface flaws, causing the flaws to grow in an unstable manner [7].
However, studies have also shown that the surface flaws may grow slowly and steadily under tensile loads before sudden failure occurs. This phenomenon is known as stress corrosion cracking, or static fatigue, and is caused by a chemical reaction between the glass (at the flaw tip) and water vapour in the environment [8]. Stress corrosion cracking is also known to cause a loading-rate dependency of the fracture strength of glass, and can reduce the fracture strength significantly under long-term loading.
Charles [9] proposed a phenomenological model that relates the fracture stress and the fracture time for soda-lime-silica glass rods under quasi-static tensile loading, and showed later that the model could also be applied for dynamic loads [10]. In these tests, Charles used loading rates up to 13 mm/min. Ritter [11] later showed that Charles’ model correctly predicted the rate dependency of the fracture strength for similar tests performed with loading rates up to 50 mm/min. Chandan et al. [12] found that the relationship derived by Charles could describe the rate enhancement of the fracture stress in bending tests with stress rates ranging from 10⁻¹ MPa/s to 10⁷ MPa/s. More recent studies have also demonstrated the loading-rate dependency of the fracture strength of glass.
Among them, Nie et al. [13] investigated the fracture strength of borosilicate glass at four different loading rates between 0.7 MPa/s and 4 ×10⁶ MPa/s. It was found that the fracture strength increased with the loading rate, and that the rate dependency was larger for loading rates between 0.7 MPa/s and 2500 MPa/s than above 2500 MPa/s. The increased tensile strength of glass with the loading rate was also observed by Peroni et al. [14] and Zhang et al. [15]. Zhang et al. [15] performed both quasi-static and dynamic splitting tensile tests, and observed that the dynamic amplification of the fracture strength increased significantly for strain rates above 350 s⁻¹.
Although glass plates are less prone to fail in compression [6], it is worth noting that the compressive strength of glass is also reported to increase with the loading rate [15], [16], [17]. To accurately determine the loading-rate dependency of glass and other brittle materials can be challenging [18], and might lead to inconsistent findings across various experimental studies. More dynamic material tests, which are performed in a precise manner, are therefore necessary to better understand the effects of loading rate on the fracture behaviour of glass.
There are several reports on component tests of glass exposed to extreme loading in the open literature. Among them, we find studies on impact-loaded laminated windshields [19], [20], [21], automobile side glazing [22], laminated window glass [23], [24], [4], monolithic window glass with safety film [25] and regular monolithic window glass [26], [16]. A number of researchers have also studied the response of monolithic and laminated window glass exposed to blast loading generated by an explosive detonation [3], [27], [4], [28] or pressure loading produced in a shock tube [29], [30], [5], [31], [32]. Blast experiments in combination with fragment impact are also available [33].
In order to design glass solutions capable of withstanding extreme loading, we need models and numerical tools that can predict the fracture strength of glass under dynamic conditions. In this study, we seek to predict the initiation of unstable fracture in glass plates exposed to arbitrary loading and loading rates. Recently, we presented a strength prediction model (SPM), which is based on the existence of microscopic surface flaws and uses Monte Carlo simulations to predetermine fracture initiation in glass [31].
The SPM is based on a model proposed by Yankelevsky [34], but includes additional features and adjustments. Results obtained with the model were in good agreement with quasi-static tests on glass, and the model managed to reproduce trends from dynamic tests reasonably well. However, in order to obtain more accurate predictions for dynamic loading, it was deemed necessary to include strain-rate dependency in the model. Thus, in this work we present an extension of the SPM where the rate dependency of glass fracture is taken into account.
In an effort to validate the rate-dependent SPM, we have performed experiments on both monolithic and laminated glass under various loading conditions and loading rates. The experimental work includes quasi-static punch tests of monolithic glass at three different loading rates from 3 mm/min to 300 mm/min, and low-velocity impact tests on monolithic and laminated glass using velocities ranging from 2 m/s to 14 m/s. The experimental results clearly demonstrate the stochastic fracture behaviour and the loading-rate dependency of the fracture strength. The rate-dependent SPM provided results that were in good agreement with the experimental results, both in terms of the fracture strength and the position of fracture initiation.
2. Material
2.1. Float glass
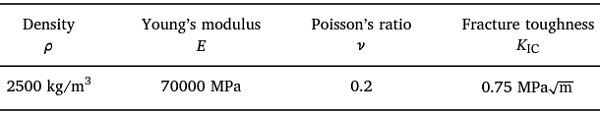
The glass specimens used in this study are made up by clear annealed soda-lime-silica float glass. Glass is a brittle material and it behaves in a linear elastic manner until it fails suddenly into sharp fragments. Furthermore, glass has a highly stochastic fracture behaviour, which normally results from crack propagation of pre-existing microscopic surface flaws under mode I loading (i.e., opening of a flaw) [6]. Consequently, glass plates primarily fail in tension, and the fracture strength is dependent on the applied stresses and the properties of the surface flaws [31]. The fracture strength has also been reported in many studies to be dependent on the loading rate [9], [10], [11], [12], [13], [14], [15], while the stiffness in terms of the Young’s modulus is found to be rate independent [15]. Table 1 presents commonly used material parameters for soda-lime-silica float glass [35].
The fracture toughness KIC is the critical stress intensity factor for the onset of sudden, or unstable, crack growth under mode I loading. The stated value is typically denoted the static fracture toughness, and is reported by e.g., Wiederhorn [36] for quasi-static tests at room temperature. In this study, we used glass specimens provided by two different glass suppliers. The glass from supplier 1 is generally used in automobile windshields, while the glass from supplier 2 is used in both safety and regular window solutions.
Table 1. Nominal material parameters for soda-lime-silica glass.
2.2. Polyvinyl butyral (PVB)
The laminated glass specimens used in this study include a polymeric interlayer consisting of polyvinyl butyral (PVB) of the type Saflex RB-41. PVB is widely used as a component in both laminated window glass and automobile windshields; however, depending on the application, other polymeric materials (e.g., ionoplast and polycarbonate) can also be used. PVB is a flexible material and exhibits a nonlinear behaviour that is highly dependent on the loading rate and the temperature [37], [38], [39]. The material behaviour is distinctly different at low and high strain rates, in which high strain rates generate a nonlinear time-dependent behaviour that includes an initial region with an increased stiffness. This initial region is not observed at lower loading rates [37], [38], [39]. PVB is also considered to be nearly incompressible and displays close to no permanent deformation after loading [38].
2.3. Laminated glass
Laminated glass is made by sandwiching layers of PVB or other polymeric materials in between two or more plates of glass. The layers are bonded together mechanically and chemically through a process including heat and pressure in an autoclave. The main intention of the interlayer is to increase the loading resistance and to retain broken glass fragments on the interlayer if the glass fractures. In addition, if a flexible polymer is used, such as PVB, the deformation of the interlayer can absorb energy and in turn reduce the loading transmitted to the rest of the structure.
A deformable interlayer also ensures that the glass breaks into small pieces instead of large and hazardous fragments [32]. The post-fracture behaviour of laminated glass is largely controlled by the adhesion between the polymer and the glass layers. A weak adhesion level may lead to an excessive amount of detached glass fragments, while if the adhesion is too strong, the interlayer can rupture due to stretching over a small area [5]. The adhesion level is dependent on the autoclave process and the polymer type applied, which will affect the delamination process [40]. Delamination is also dependent on the loading rate [41] and the ambient temperature [42].
3. Experimental study
3.1. Quasi-static punch tests
An Instron universal testing machine was used to perform quasi-static punch tests with a massive wooden (oak) impactor nose on monolithic glass specimens in three different test series at different loading rates. The crosshead velocity of the test machine was set to 3 mm/min, 100 mm/min and 300 mm/min, and 30 tests were performed for each loading rate. The in-plane dimensions of the glass specimens were 400 mm × 400 mm, while the thickness was approximately 1.75 mm. All 90 glass specimens were delivered by the same glass supplier (supplier 1).
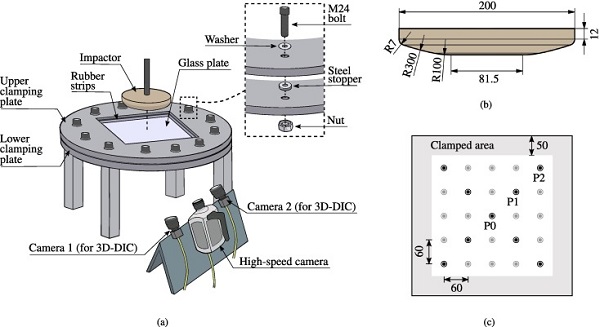
Neophrene rubber strips (with thickness 4 mm and width 50 mm) were glued onto two 25 mm thick aluminium clamping plates and positioned on each side of the glass specimen. Prior to testing, we ensured that the glass specimens did not have any visible flaws or defects, and that all glass fragments from the previous test were removed from the clamping frame. We also made sure that the impactor nose was properly fastened to the testing machine and positioned parallel to the glass, since the results appeared to be sensitive to these factors. Twelve equidistant M24 bolts were used to fasten the clamping plates together using a torque of 75 Nm.
In order to properly tighten the bolts, while limiting the clamping pressure on the glass specimens, we placed steel stoppers on the bolts between the clamping plates. The experimental setup is illustrated in Fig. 1(a), while an illustration of the impactor nose is shown in Fig. 1(b). Note that the bottom part of the impactor nose contains a flat area. Two synchronised Basler acA2440-75um cameras and a Phantom v2511 high-speed camera were placed below the glass specimen to film the tests. The frame rate of the synchronised cameras was set to 1 Hz for the 3 mm/min tests and 20 Hz for the 100 mm/min and 300 mm/min tests. For the high-speed camera, we used a frame rate of 100 kHz.
The high-speed camera images were used to capture the fracture initiation and crack propagation in the glass, while the synchronised camera images were used to obtain the out-of-plane displacement of the specimens in discrete points (denoted optical targets) by means of a point-tracking procedure. This procedure is available in the in-house three dimensional digital image correlation (3D-DIC) code, eCorr [43]. The optical targets consisted of a white circle with a central black dot, and were spray-painted on the glass 60 mm relative to each other, see Fig. 1(c). Note that the grey region in the figure indicates the clamped area of the glass, i.e., the position of the rubber strips. Later in the article, we will refer to the diagonal optical targets as shown in the figure. The central optical target is referred to as P0, while the four optical targets positioned 60 mm from the centre are referred to as P1, and P2 refers to the four points positioned at the corners. A validation of the point-tracking procedure can be found in Osnes et al. [31].
As a reference to the low-velocity impact tests (see Section 3.2), we performed nine quasi-static punch tests at 3 mm/min with the same impactor nose and monolithic glass plates as in the low-velocity impact tests. The reference tests were otherwise performed with the same experimental setup as in the quasi-static punch tests. The only difference between the reference tests and the low-velocity impact tests on monolithic glass was therefore the velocity-time history of the impactor. Thus, by comparing these tests, the influence of loading rate on the strength of the monolithic glass plate could be estimated. When compared to the quasi-static punch tests at 3 mm/min, the reference tests could also indicate how the impactor nose shape affects the probability distribution of the fracture strength of the glass.
3.2. Low-velocity impact tests
Eleven low-velocity impact tests were performed in an Instron CEAST 9350 drop tower impact system [44] on monolithic (two tests) and laminated (nine tests) glass specimens. The impact velocities ranged from approximately 2 m/s to 14 m/s. The glass specimens were delivered by glass supplier 2. The in-plane dimensions of the glass specimens were the same as for the quasi-static punch tests, i.e., 400 mm × 400 mm, while the thickness of the glass plate was approximately 3.8 mm. The laminated glass consisted of two 3.8 mm thick glass plates and a 1.52 mm thick PVB layer, resulting in a total thickness of 9.12 mm. We used the same fastening system as in the quasi-static punch tests; however, the thickness of the steel stoppers was adjusted to obtain approximately the same clamping pressure as for the thinner specimens.
The drop tower can impart kinetic energies up to 1800 J, using impact velocities up to 24 m/s and masses up to approximately 70 kg. The experimental setup is illustrated in Fig. 2(a). In the current tests, we applied the standard instrumented striker and striker-holder with a mass of 1.435 kg and 4.300 kg, respectively. By including an aluminium impactor nose with a mass of 0.816 kg (see Fig. 2(b)), we achieved a total impacting mass mp of 6.551 kg. The striker was instrumented with a load cell (using a recording rate of 500 kHz) positioned approximately 225 mm above the impactor nose tip. A stopping mechanism was activated to avoid damaging the striker if the displacement exceeded a certain limit. The contact force F between the striker and the glass specimen was calculated based on dynamic equilibrium as [45]
![]()
where m₁ and m₂ are the mass above and below the load cell, respectively, and P is the force measured in the load cell. The sum of the masses m₁=5.243 kg and m₂=1.308 kg equals the impacting mass mp. To obtain the velocities and displacements in the tests, we employed the following numerical integration scheme [46]
![]()
Here, v is the velocity and d is the displacement of the striker, F is the contact force, mp is the impacting mass, g=9.81 m/s² is the gravitational acceleration, and Δt is the time between recordings of the load cell. The subscripts n+1 and n refer to the current and previous recordings, respectively. Two synchronised Phantom v1610 high-speed cameras (with a recording rate of 25 kHz) were placed below the glass specimen to film the impact tests. The high-speed camera images were used to obtain the out-of plane displacement of the specimens through the point-tracking procedure described in Section 3.1, and to reveal the fracture initiation and crack propagation in the glass.
![Fig. 2. Low-velocity impact tests: illustration of (a) the drop tower impact system [47], and (b) the impactor nose (units: mm).](/sites/default/files/inline-images/Fig2_240.jpg)
4. Experimental results
4.1. Quasi-static punch tests
The force–displacement histories of the three quasi-static punch test series, including their fracture points, are shown in Fig. 3(a). It is seen that the slope of the curves is similar for all tests and independent of the loading rate. Additionally, the results clearly illustrate the probabilistic fracture strength of glass as the fracture forces vary between approximately 590 N (in test series 2) and 6200 N (in test series 3). Further, Fig. 3(b) presents box plots of the fracture force for each of the three loading rates. The outer edges of the box refer to the 25th and 75th percentile, the inner line indicates the median and the dashed lines represent the rest of the data. The results in Fig. 3(b) suggest that the median fracture force increases with the loading rate.
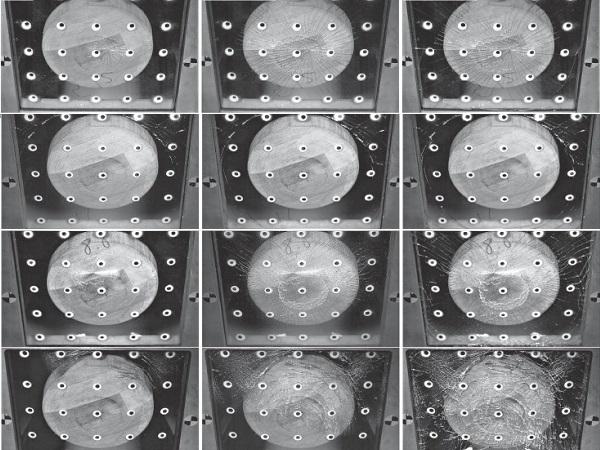
The variance of the fracture force is also larger for series 2 and 3 compared to series 1. Furthermore, the tests display a distinct variation in the position of fracture initiation. Fig. 4 illustrates the fracture positions and the corresponding fracture force for each test. The dashed lines in the figure refer to the edges of the clamped area, and the black line on the colour bars denotes the median fracture force. It is seen that fracture initiated in either the face or the boundary (i.e., inside the clamped area) of the specimens, and that the fracture force is generally above the median value for boundary failures. Fig. 5 presents high-speed camera images that represent the different failure responses that occurred in the quasi-static punch tests, i.e., face and boundary failures at both low and high fracture forces.
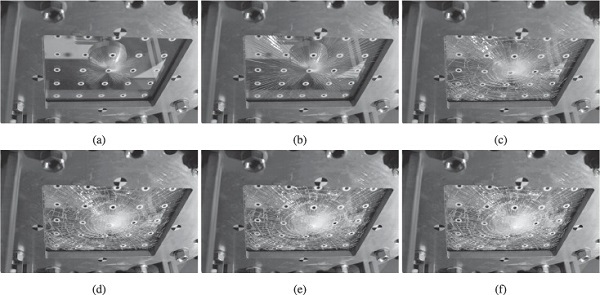
The time t₀ refers to the time in which fracture was first visible. Fig. 5(a) is taken from test series 1, while Figs. 5(b)–(d) are taken from test series 2. The images illustrate that a larger fracture force generates smaller fragments, due to a higher level of stored elastic energy at the point of fracture. Moreover, fracture initiation at the face resulted in radial cracks from the initiation point and cracks along the edges of the flat area of the impactor nose (see Fig. 5, Fig. 5(c)). For the tests with fracture initiation at the boundary, circumferential cracks formed at the boundary with subsequent fracture propagation towards the face of the plate (see Fig. 5, Fig. 5(d)).
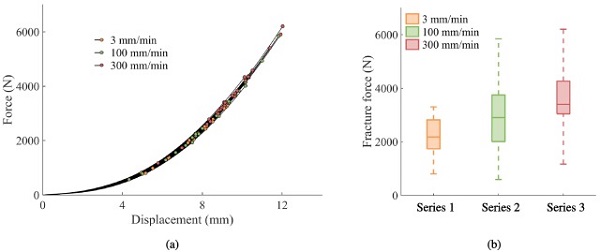
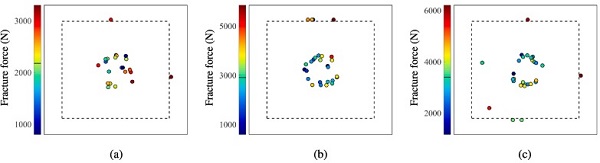
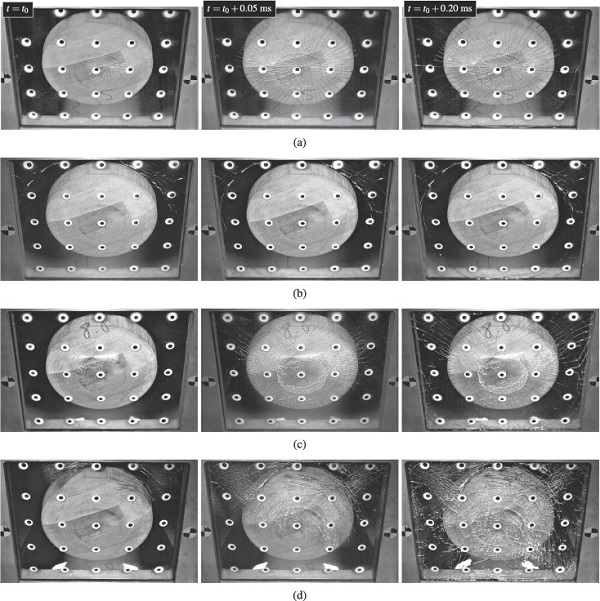
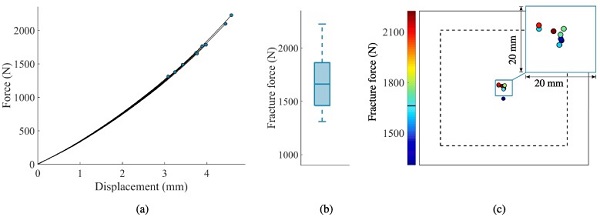
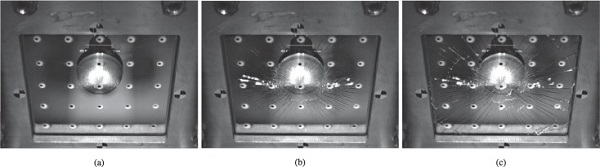
Fig. 6 presents results from the nine reference tests (see Section 3.1), and includes force-displacement histories, a box plot of the fracture force, and fracture positions with colours denoting fracture forces. The fracture forces vary between approximately 1310 N and 2225 N, with the lowest force occurring closest to the centre of the specimen. Compared to the quasi-static punch tests, fracture initiation occurred closer to the midpoint without any boundary failures, which owes to a more localised load distribution due to the sharper nose shape of the impactor. The failure response was similar in all of the reference tests, and is demonstrated by the high-speed camera images presented in Fig. 7. Dense cracks were formed from the fracture initiation point, with subsequent radial crack propagation towards the edges of the plate. Eventually, circumferential cracks were formed close to the boundary and the contact point.
4.2. Low-velocity impact tests
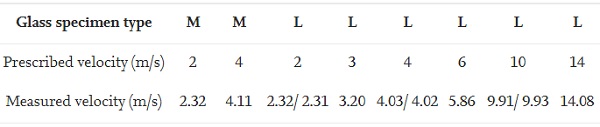
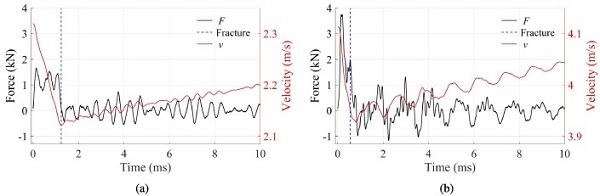
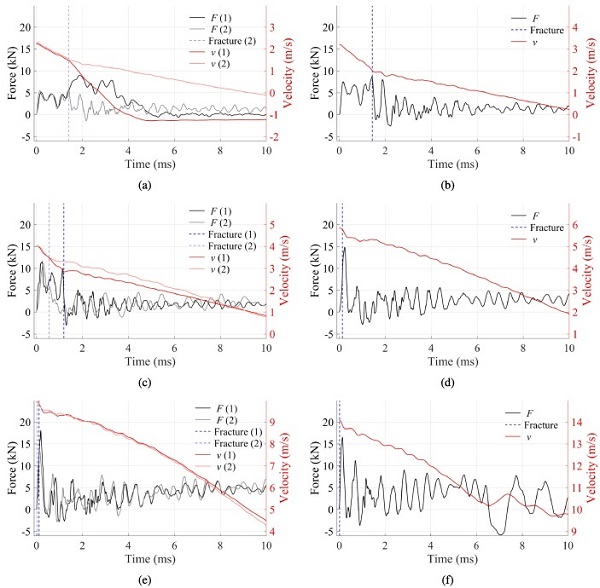
Table 2 presents the prescribed and the measured impact velocities at contact in the low-velocity impact tests, whereas Fig. 8, ;Fig. 9 display the force-time and velocity-time histories, separated into specimen type and prescribed velocity. The force and velocity histories are presented by grey and red lines, respectively, while the fracture initiation points are shown as dashed blue vertical lines. Harmonic oscillations are present in all of the tests, which are caused by dynamic coupling between the impactor, the specimen and the supports [48]. Note that the presented experimental data have not been filtered. Both of the monolithic glass plates fractured at the appointed impact velocity, which is seen as a distinct decrease in the force level, see Fig. 8.
In addition, we observe a steady decrease in the velocity from contact and up to fracture initiation and a subsequent increase afterwards. This increase is caused by limited resistance in the monolithic glass after fracture initiation, and the impactor enters into free falling before being stopped by the stopping mechanism of the drop tower. Since the PVB offers additional resistance, we did not observe an increase in velocity after fracture of the laminated glass specimens, see Fig. 9. The specimen in the first test on laminated glass did not fracture at the prescribed impact velocity. Consequently, at a time approximately equal to 2 ms, the velocity becomes negative, see Fig. 9(a).
This means that the impactor bounces back and travels in the opposite direction. At approximately 5 ms, there is no longer contact between the impactor and the specimen, and the force becomes zero. For the rest of the tests, contact is maintained during the presented histories. Moreover, in the test with a prescribed impact velocity of 14 m/s, the PVB ruptures after around 6.5 ms, as evidenced by a jump in the velocity–time curve and a large drop in force after this point, see Fig. 9(f). After the test was finished, a half-spherical tear with a radius of approximately 35 mm was visible in the PVB around the midpoint of the specimen.
Table 2. Impact velocities in the low-velocity impact tests on monolithic (M) and laminated (L) glass.
The calculations by Eqs. (1), (2) were validated by comparing the calculated displacement to the measured displacement of the striker. The measurements were performed by installing an additional camera to film the striker and using point tracking to trace its movement. It was found that the displacements were close to identical throughout the presented histories.In all of the low-velocity impact tests, fracture initiated close to the midpoint, as illustrated in Fig. 10. The dashed lines in the figure indicate the edges of the clamped area, while the grey circles denote the position of the optical targets. It was also observed that the initiation occurred generally closer to the midpoint as the impactor velocity was increased. In addition, for the same impact velocity, fracture that initiated farthest from the midpoint resulted in a higher fracture strength.
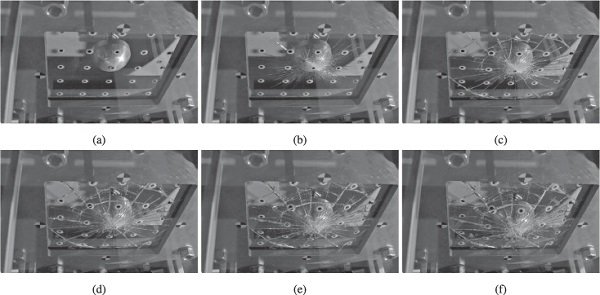
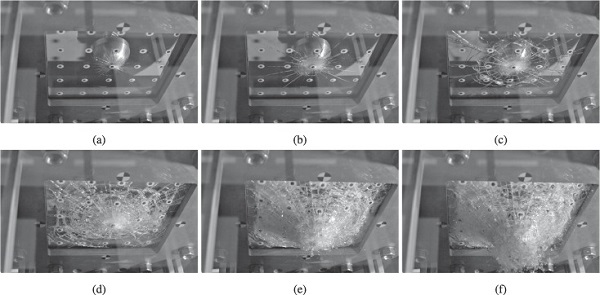
Fig. 11 presents high-speed camera images from a test on a monolithic glass specimen with an impact velocity of 4.11 m/s. Both tests on monolithic glass had a similar response, with fracture initiation a short distance from the midpoint and propagation of radial and circumferential cracks. Fig. 12, Fig. 13 provide images from two tests on laminated glass specimens with impact velocities of 4.02 m/s and 14.08 m/s, respectively. The response of all of the laminated glass specimens that fractured exhibited fracture initiation close to the midpoint, radial cracks propagating towards the edges, circumferential cracks forming in both glass plates, and detachment of glass fragments from the PVB interlayer. Based on the high-speed images, fracture in the laminated glass specimens appeared to initiate in the upper glass plate (i.e., the plate in direct contact with the impactor) except for the test with an impact velocity of 4.03 m/s.
This behaviour might be caused by local deformation of the soft PVB interlayer around the impact point. In this way, larger tensile stresses occur in the upper glass plate (on the surface in direct contact with the PVB layer) compared to the lower glass plate (on the outer surface). Consequently, the probability of fracture initiation in the upper plate is deemed larger than for the lower plate for this test setup and velocity range. As expected, an increased impact velocity resulted in more severe damage, i.e., a larger out-of-plane displacement and more detachment of glass fragments. Additionally, by increasing the impact velocity, fracture seemed to occur earlier in the lower glass plate, resulting in a less refined fracture pattern.

5. Numerical modelling
5.1. Strength prediction model
A model for predicting the fracture strength of glass was recently presented by Osnes et al. [31], and is an extension of the work by Yankelevsky [34]. The model, referred to as the strength prediction model (SPM), performs virtual experiments on glass by combining outputs from a finite element (FE) simulation and information about artificial surface flaws in a Monte Carlo simulation. First, an FE simulation of the problem at hand is conducted to obtain the stress and strain rate history on the faces of the glass specimen. The output from the FE simulation is issued from a specified number of evenly spaced time intervals, referred to as frames. It should be noted that the number of frames k must be large enough to capture the stress history in a sufficient manner.
Then the model calculates the onset of unstable fracture, and can thus estimate the probability distribution of the fracture stress, the fracture force and the displacement at fracture, in addition to the position of fracture initiation. Since the chance of crack arrest in glass is small, initiation of unstable fracture is often associated with failure in the entire plate. A detailed description of the SPM, including a comparison with experimental results, can be found in Osnes et al. [31], but a short description is given herein for completeness. Due to the nature of fracture in glass, we can apply linear elastic fracture mechanics [7] to calculate the fracture strength of glass (i.e., the initiation of unstable crack growth) by
![]()
where Ki is the stress intensity factor for mode I loading, Kic is the corresponding fracture toughness, Y is a geometrical factor depending on the flaw shape, σ is the remote tensile stress normal to a flaw, and a is the depth of a surface flaw. Thus, for Ki=Kic,σ is equal to the fracture stress σc. In the model, all surface flaws are assumed to have a semi-circular shape, and the geometrical factor Y is calculated from an empirical expression proposed by Newman and Raju [49]. The required input to the SPM is given in the list below.
- Stress history from an FE simulation (over k frames)
- Fracture toughness Kic (MPa√m)
- Maximum flaw depth amax (mm)
- Flaw density ρflaw (flaws/mm²)
- Size of the jumbo plate Ajumbo (mm²)
- Number of iterations (i.e., virtual experiments).
The parameter Ajumbo refers to the area of a larger (jumbo) plate from which the analysed specimens are cut, and are typically about 14.5–19.3 m2 [50]. In the model, each surface of a hypothetical jumbo plate is first assigned a number of artificial flaws with varying sizes, which follows Mott’s distribution function dependent on ρflaw and amax. Each flaw is also given a random in-plane orientation at an angle between 0 and π. It is assumed that each surface of the jumbo plate contains one flaw of size amax. The jumbo plate is then cut into the sizes of the analysed plate and each element, or cluster of elements [31], is assigned one flaw at random.
In each iteration, the stress history and the information about the flaws are combined, and the fracture criterion (Eq. (3)) is checked for every flaw in each frame. When (or if) failure is reached, the necessary information is saved and another iteration begins. According to Yankelevsky [34], 5000 iterations are required to obtain a converged failure probability distribution. The SPM is implemented as a stand-alone code in the programming language Python, and the total computational time is typically from a few minutes to roughly one hour.
5.2. Rate dependency
The fracture strength of glass is reported to increase with the loading rate [9], [10], [11], [12], [13], [14], [15]. Consequently, to obtain more realistic failure predictions for dynamic loading, we have introduced a strain-rate dependent dynamic fracture toughness KID. Exactly how the loading rate affects the fracture strength of glass is still an open topic of research [18], and the following procedure is a first attempt to add rate dependency to the SPM. The proposed dynamic fracture toughness KID is given as

where ε̇¯ is a time-averaged strain rate, Ns is an exponent that controls the strain-rate enhancement, and ε̇₀ is a reference strain rate below which the static value of the fracture toughness Kic applies. The relationship is based on the works by Charles [9], [10] on stress corrosion in glass, and by assuming a constant loading rate. A similar approach was used by Cormie et al. [51] to account for the strain-rate enhancement of the fracture strength of glass under blast loading. It should be noted that a decrease in fracture strength caused by stress corrosion is not considered in the rate-dependent SPM at this point, and the minimum value of KID is set to Kic. Further, the time-averaged strain rate ε̇¯ is calculated as [32]
![]()
where tc is a decay parameter and ε̇ is the strain rate. A time-averaged strain rate is used to avoid spurious stress peaks in calculations of dynamic problems. Furthermore, by performing the integration from τ=0 to τ=tn+Δtn+₁, Eq. (5) can be written in a discretised manner as

where ε̇n+₁ is the strain rate calculated as
![]()
Note that for Δtn+₁≫tc, the time-averaged strain rate becomes equal to the strain rate. In addition, the strain ε has the same direction as the normal stress σ, i.e., in the normal direction to a surface flaw. The subscripts n and n+₁ refer to the previous time tn and the current time tn+₁.
6. Numerical study
In the numerical study, we investigate whether the rate-dependent SPM is able to recreate the fracture strength observed in the experimental tests. Therefore, each test series was first recreated by an FE simulation to retrieve the stress history in the glass to be used as input to the SPM. Note that no fracture criterion is used for the glass in the FE models. All FE simulations were performed using the explicit solver of Abaqus (version 2017).
6.1. Finite element simulations
6.1.1. Quasi-static punch tests
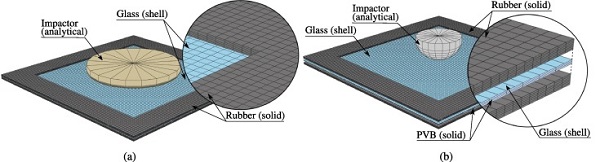
The FE model of the quasi-static punch tests consisted of the impactor nose (see Fig. 1(b)), a glass plate, and two rubber parts positioned on each side of the glass. The impactor nose was modelled as an analytical rigid surface, while the glass was made up by 5 mm × 5 mm shell elements using the Simpson’s integration rule with five integration points over the thickness of 1.75 mm. The rubber consisted of 5 mm × 5 mm × 0.7 mm fully integrated solid elements. The movement of the outer surfaces of the rubber was restricted in all directions as a way of indirectly including the rest of the fastening system. From a preliminary numerical study, we found that the tightening of the bolts resulted in relatively small prestresses in the glass, and was therefore omitted in the simulations. Both the glass and the rubber were modelled with a linear elastic material model.
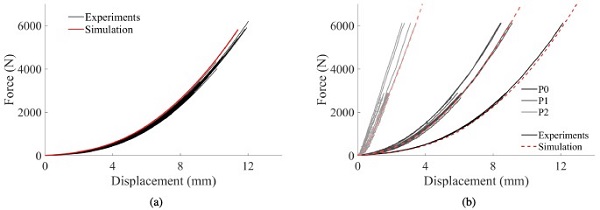
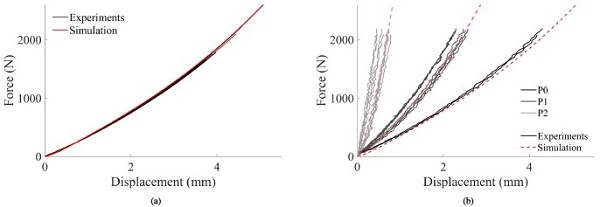
Table 1 presents the parameters employed for the glass, while for the rubber, we used a Young’s modulus of 2 MPa and a Poisson’s ratio of 0.46 [31]. Although a linear-elastic material model represents a simplified description of the rubber behaviour, it was deemed sufficient in this study due to limited deformation of the rubber. The impactor was prescribed a gradually increasing velocity over a short time period before reaching a constant value. Furthermore, the FE model of the reference tests was identical to the quasi-static punch test model, except for the shape of the impactor nose (as shown in Fig. 2(b)). The FE model of the quasi-static punch tests is illustrated in Fig. 14a. Fig. 15(a) compares the force versus displacement of the impactor in the quasi-static punch tests and the corresponding simulations.
Fig. 15(b) further presents the force versus displacement of the optical targets P0, P1 and P2 (see Fig. 1(c)) in the FE simulations and three selected experiments, one for each loading rate. Note that the experimental data is not visible after fracture, and that the three tests fractured at different time points. In addition, the displacements in P1 and P2 are not perfectly symmetric in the tests, as in the simulations. Nevertheless, the agreement between the simulations and the experiments is in general good, which suggests that the applied FE model is able to recreate the experiments before fracture. The stress histories could therefore be used as input to the SPM. The same comparison is also made for the reference tests, see Fig. 16. Again, the results indicate that the FE model provides the correct behaviour and the stress history could be utilised further.
6.1.2. Low-velocity impact tests
The FE model of the low-velocity impact tests was similar to the quasi-static punch test model presented in Section 6.1.1. Differences include a different impactor nose shape with a prescribed initial velocity, and, naturally, the additional glass and PVB layer for the laminated glass specimens. In order to avoid that stress singularities would arise at the midpoint of the glass specimen, a small part of the impactor tip was made flat in the FE model. The PVB comprised of 10 mm × 10 mm × 0.5 mm solid elements, and the glass and the PVB layers were merged together by a tied constraint at the inner surfaces of the glass. The nodes of the shell elements used to model the glass were positioned in direct contact with the PVB and the contact thickness was placed between the PVB and the rubber strips.
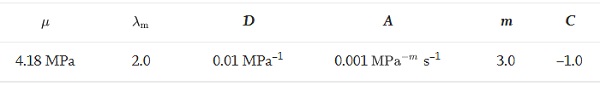
The FE model of the low-velocity impact tests is illustrated in Fig. 14b. The PVB layer was modelled using a non-linear viscoelastic material model, consisting of a hyperelastic part described by the Arruda-Boyce model, and a viscoelastic part defined by the Bergström-Boyce creep model. The complete model is described in the work by Bergström and Boyce [52], while details on the implementation in Abaqus can be found in Refs. [53], [54]. Table 3 presents the input parameters used for the non-linear viscoelastic material model, where μ is the shear modulus, λm is the locking stretch, D describes the compressibility, A is the creep parameter, m is the effective stress exponent, and C is the creep strain exponent. The input parameters were obtained by a combination of curve fitting and inverse modelling of tensile tests conducted by Hooper et al. [37] and Del Linz et al. [39] on the same PVB as used in this study.
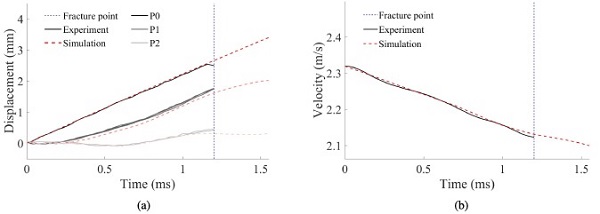
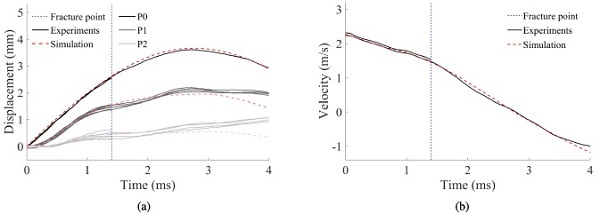
Fig. 17 shows comparisons between experiments and FE simulations of three of the tensile tests on PVB in terms of true stress versus logarithmic strain. The results indicate reasonable agreement between the simulations and the experiments.Fig. 18, Fig. 19 compare the displacements of the optical targets P0, P1 and P2, and the velocity of the impactor in the FE simulations and the experiments on monolithic and laminated glass specimens with a prescribed impact velocity of 2 m/s. The experimental data is removed after the fracture point (illustrated by a blue dashed line); hence, only one test could be compared throughout the entire course of the displacement.
For the monolithic glass test, it is seen that the curves are fairly coincident, and we could therefore assume that the FE simulation manages to describe the stress state in the glass before fracture. The FE simulation of the laminated glass tests also fits well with the experiments. However, there is some disagreement after maximum displacement in points P1 and P2, which may be due to the simplified modelling of the rubber material. If the glass fractures, it will most likely occur before this point, and the FE model was considered sufficiently accurate. The stress history could therefore be used as input to the SPM. A similar comparison was made for the rest of the low-velocity impact tests, showing comparable accuracy, but is not presented here for brevity.
Table 3. Input parameters for the PVB material model.
![Fig. 17. True stress versus logarithmic strain curves from experimental tensile tests [39] and corresponding simulations with nominal strain rates: (a) 2 s−1, (b) 60 s−1 and (c) 400 s−1.](/sites/default/files/inline-images/Fig17_32.jpg)
6.2. Rate-dependent strength prediction
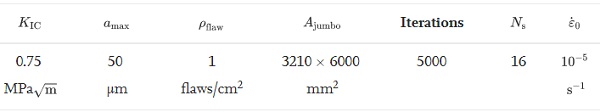
Table 4 presents the input parameters to the rate-dependent SPM, and the same input data was used for the glass from both suppliers. The parameters that describe the surface condition of the glass specimens, i.e., amax and ρflaw, were chosen through inverse modelling of the quasi-static punch tests at 3 mm/min. To have more confidence in the input parameters, measurements of the flaw sizes and flaw densities should be performed.
Such measurements are not straightforward and will therefore be a topic of further investigation. A method for performing such measurements was presented in the work by Wereszczak et al. [55]. Furthermore, the value of the exponent Ns was set to 16, which is consistent with the work of Charles [9], [10], while the reference strain rate ε̇₀ was chosen as 10⁻⁵ s⁻¹ since the value is typically defined as the beginning of the quasi-static loading domain [56].
Table 4. Input parameters for the rate-dependent SPM.
6.2.1. Quasi-static punch tests
Fig. 20 presents results from SPM simulations of the quasi-static punch tests, and includes three plots for each of the three loading rates. Fig. 20(a) compares box plots of the fracture force from the experiments and the strength predictions. In the box plot representing the SPM results, the box and the dashed lines deNote 99% of the data, making the dots outside the remaining 1%. The box edges refer to the 25th and 75th percentile and the inner line indicates the median. The SPM results of the 3 mm/min test series proved to be independent of the loading rate, as it obtained the same results with and without the strain-rate enhancement of the fracture toughness defined in Eq. (4). The predictions of the 100 mm/min and 300 mm/min test series obtained a 42% and 57% increase in the median fracture force compared to the 3 mm/min test series, respectively.
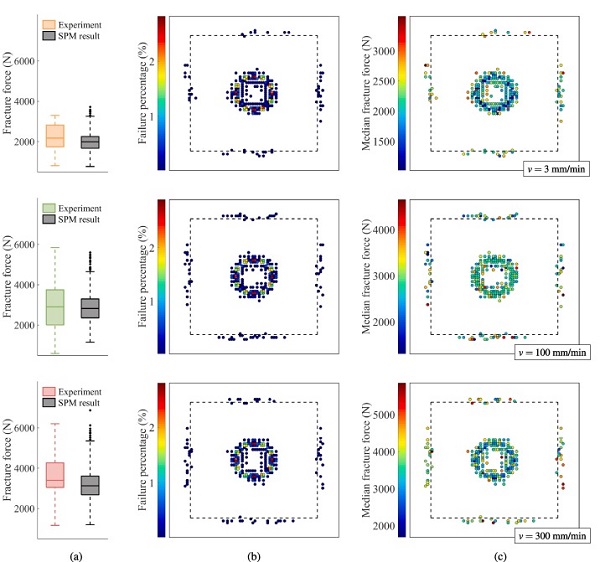
From the box plots, we observe that the SPM manages to recreate the increase in the fracture force and its variance with the loading rate, and that most experimental values are captured by the model. However, for the 100 mm/min test series, the minimum fracture force in the experiment is not predicted by the model, possibly due to a larger surface flaw than described by the appointed amax. Note that the predictions of the 100 mm/min and 300 mm/min series without the rate dependency would be identical to the 3 mm/min prediction, demonstrating the importance of including rate enhancement for high loading rates.
Fig. 20(b) presents the predicted points of fracture initiation, in which the colours denote the percentage of failure occurrence at the given point. Fracture initiates primarily around the flat area of the impactor nose, but also at the boundary, which is in accordance with the experimental tests, see Fig. 4. Fracture initiation takes place in tension, which corresponds to the lower side of the glass for face fractures, and the upper side of the glass for boundary fractures. Fig. 20(c) shows the predicted points of fracture initiation with colours indicating the median fracture force for each point.
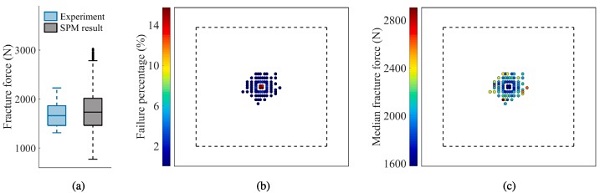
The model predicts that fracture can occur at both high and low forces at the face and the boundary of the glass plate, but the lowest fracture forces are primarily caused by fracture initiation at the face. This is also in agreement with the experiments. Furthermore, the predictions suggest that the position of fracture initiation is independent of the employed loading rates, and that the number of face failures versus boundary failures is relatively constant. Whether or not this also holds for the experiments is unclear due to the limited number of tests. Results from the SPM simulation of the reference tests are shown in Fig. 21, and presents box plots of the fracture force from the experiments and the strength prediction.
The figure also includes illustrations of the predicted points of fracture initiation with denoted failure percentage and median fracture force for each point. Note that each fracture point in these figures may represent several virtual experiments. From the box plots, we observe that the overall median obtained by the SPM coincides well with the experiments, and that all experimental values are captured by the model. The SPM simulation predicts that fracture initiates most frequently at the midpoint, but can also occur a distance of approximately 45 mm away from the centre.
Consequently, the fracture initiation in the experiment appears within the predicted ones. Additionally, the simulation predicts that the lowest fracture forces are mainly obtained at the midpoint, and the largest fracture forces are generally obtained some distance away. These trends also seem to apply for the experiments. By comparing the SPM results of the reference tests to the quasi-static punch tests, we can clearly see how the shape of the impactor nose influences the results. Compared to the quasi-static punch tests, the fracture initiates closer to the midpoint without boundary failures, and the scatter of the obtained fracture forces is lower.
6.2.2. Low-velocity impact tests
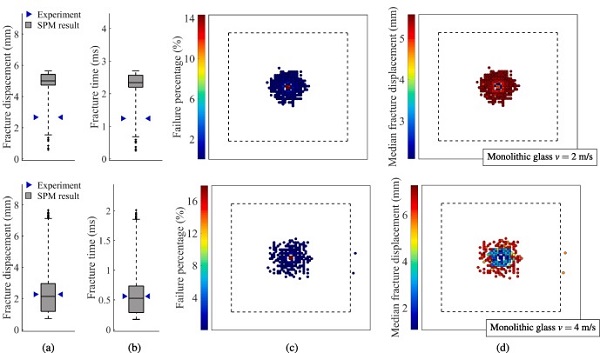
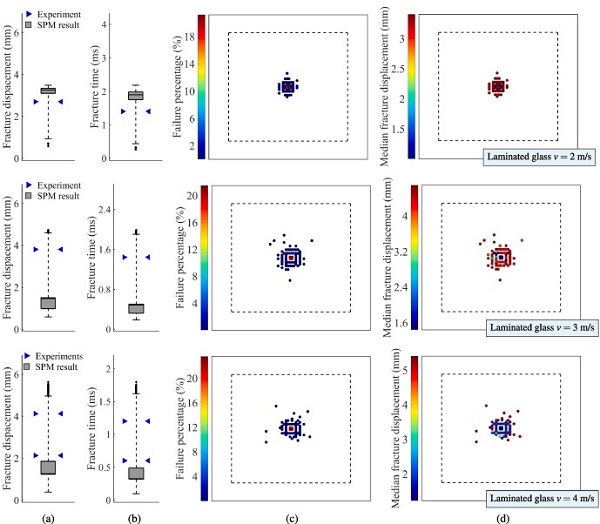
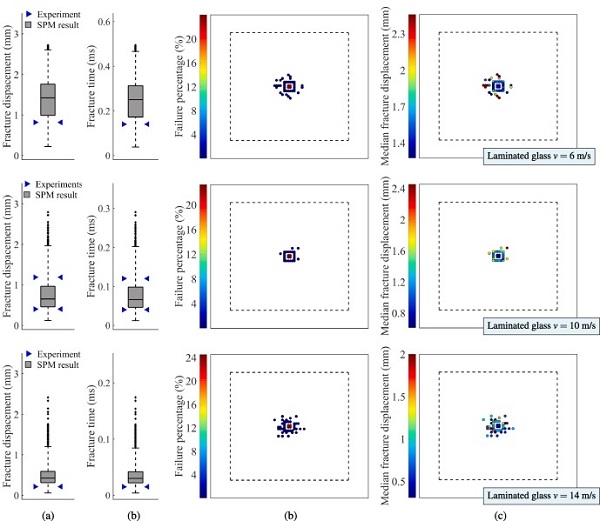
In the SPM simulations of the low-velocity impact tests, we made use of the time-averaged strain rate ε̇¯, see Eq. (5) in Section 5.2. For these simulations, it was therefore necessary to define the decay parameter tc, and the value was set to 10⁻⁴ s. By using the time-averaged strain rate with the appointed tc instead of the actual strain rate, we obtained fracture slightly earlier without significantly altering the fracture strength distribution. Results from the SPM simulations of the low-velocity impact tests are presented in Fig. 22, Fig. 23, Fig. 24, and include box plots of the fracture strength, and illustrations of the fracture initiation points with colours denoting the failure percentage and median fracture strength for each point. The fracture strength is given here in terms of both the (impactor) fracture displacement and time at fracture.
For comparison, the box plots include the fracture strength from the experiments, denoted by blue arrows. Note that the median in the box plots for the SPM predictions of the 3 m/s and 4 m/s tests on laminated glass nearly coincide with the 75th and 25th percentile, respectively. From the box plots, we observe that the model predictions are generally in good agreement with the experimental results since most of the experiments occur within the predictions. However, most of the experimental results fall outside the box representing the 25th and 75th percentile.
In addition, the SPM simulations predicted that fracture would occur in all the virtual experiments. Since fracture did not occur in one of the laminated specimens tested at 2 m/s, this is a conservative result. Nevertheless, the SPM model appears to correctly predict many of the trends observed in the experiments. This includes a more localised failure occurrence when increasing the impactor velocity and overall obtaining higher fracture strengths for fracture initiation far from the midpoint. Additionally, the fracture initiation points in the experiments are all found to lie within the corresponding predicted positions, see Fig. 10. Most of the laminated glass specimens experienced fracture initiation in the upper glass plate, which is also in accordance with the experiments.
Although the SPM results appear to deviate from some of the low-velocity impact tests and fit very well with others, it is important to bear in mind that we have a limited amount of experimental data. Therefore, to draw any definite conclusions, a much larger experimental study should be carried out. However, the disagreement with some of the experiments and the SPM results could be explained by a number of possible reasons. The applied flaw parameters might not reflect the actual surface condition of the tested glass specimens. Additionally, the SPM is a relatively simple model, and it might not be able to capture all effects arising in the physical tests. That being said, the study demonstrates that to obtain realistic strength predictions, a rate enhancement must be included in one way or another.
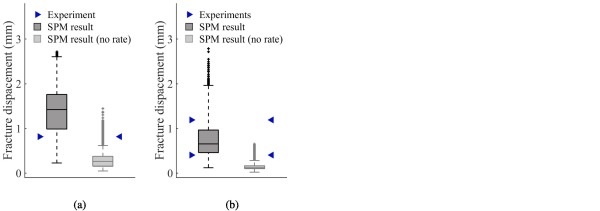
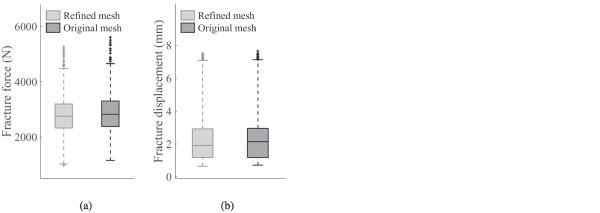
Fig. 25 presents results from SPM simulations with and without strain-rate enhancement for two selected low-velocity impact tests, and illustrates that if rate dependency is not included, the experiments appear above the 99th percentile. Furthermore, the effect of mesh size on the SPM results was checked for two of the presented cases, i.e., the quasi-static punch tests at 100 mm/min, and the low-velocity impact test at 4.11 m/s on monolithic glass. We performed two new simulations using a refined mesh consisting of elements with half the area compared to the original mesh. Fig. 26 presents the results, and demonstrates that the predictions are close-to mesh independent for the investigated mesh densities, since the width of the dashed lines, the 25th and 75th percentile and the median were approximately the same.
Finally, it should be pointed out that the SPM will be somewhat sensitive to the chosen flaw properties, such as amax and ρflaw. In this study, the problem was partly circumvented by inverse modelling of one of the experimental test series, and the values given in Table 4 were used in all of the simulations. Based on previous sensitivity studies, it has been found that the predicted fracture force will drop for an increase in the maximum flaw depth or the flaw density, and more so for the former. Here, the same flaw properties were used on the glass from both suppliers, even though only glass from supplier 1 was used in the inverse modelling. Nevertheless, most of the experimental results occurred within the predictions, both in terms of the fracture force and the position of fracture initiation. This gives confidence to the estimated flaw properties, but it remains to validate these values against measurements.
7. Concluding remarks
In this study, we have included rate dependency in a strength prediction model (SPM) for monolithic and laminated glass [31]. The SPM aims to predict fracture initiation in glass exposed to arbitrary loading, and is based on the existence of microscopic surface flaws. These surface flaws are known to govern fracture initiation in glass and cause a highly stochastic fracture behaviour. By combining stress histories from an FE simulation with artificial surface flaws, the SPM can output the probabilistic fracture strength of glass through numerous virtual experiments. To account for rate dependency in the SPM, we proposed an approach that is based on previous works on stress corrosion in glass.
In an effort to validate the rate-dependent SPM, we performed experiments on both monolithic and laminated glass specimens under various loading conditions and loading rates. In total, 90 quasi-static punch tests were conducted on monolithic glass at loading rates of 3 mm/min, 100 mm/min and 300 mm/min. As a comparison, nine additional tests were performed at 3 mm/min using a different impactor nose. We also performed 11 low-velocity impact tests on monolithic glass with impact velocities of 2 m/s and 4 m/s, and on laminated glass with impact velocities ranging from 2 m/s to 14 m/s. The quasi-static punch tests demonstrated the stochastic fracture strength of glass by a large variation in both the fracture force and the position of fracture initiation.
Additionally, the median and the variance of the fracture force appeared to increase with the loading rate. The stochastic fracture behaviour of glass was also demonstrated by the low-velocity impact tests, since the same loading conditions resulted in different fracture strengths. The position of fracture initiation also varied. As expected, an increased impact velocity resulted in more severe damage in the laminated glass specimens, with a larger out-of-plane displacement and more glass fragments detaching from the polymeric interlayer. For the highest impact velocity, we also obtained tearing of the PVB interlayer.
The rate-dependent SPM was able to successfully capture many of the trends observed in the experimental tests. For the quasi-static punch tests, the SPM managed to recreate the increase in the fracture force and its variance with the loading rate, and most of the experiments occurred within the predictions, both in terms of the fracture force and the position of fracture initiation. For the low-velocity impact tests, the predicted fracture strengths were generally in good agreement with the experiments, and the fracture initiation positions from the experiments were all found to lie within the predicted positions. In addition, higher fracture strengths were obtained for fracture initiation some distance from the midpoint of the specimen, which was also in accordance with the experimental observations.
However, we observed that some of the experiments deviated from the SPM results, which might be explained by an insufficient description of the surface flaws in the model. Consequently, it may be necessary to perform measurements of the surface condition of glass plates to obtain more realistic input parameters. In addition, to better validate the SPM, a more extensive experimental study should be performed, including experiments with higher loading rates than presented in this study. It is also worth mentioning that the proposed rate-dependent SPM is a relatively simple model, and might not be able to capture all effects arising in physical tests. But it is apparent from the numerical study that some form of rate dependency must be included in order to obtain reasonable results. All things considered, the SPM appears to have great potential as it manages to correctly display a number of trends in the experiments. The model can therefore contribute to more predictive modelling of the probabilistic fracture strength of glass under both quasi-static and dynamic loading conditions.
CRediT authorship contribution statement
Karoline Osnes: Formal analysis, Investigation, Writing - original draft, Writing - review & editing, Visualization. Odd Sture Hopperstad: Conceptualization, Writing - review & editing, Supervision. Tore Børvik: Conceptualization, Writing - review & editing, Supervision.
Declaration of Competing Interest
The authors declare that they have no known competing financial interests or personal relationships that could have appeared to influence the work reported in this paper.
Acknowledgements
The present work has been carried out with financial support from the Centre of Advanced Structural Analysis (CASA), Centre for Research-based Innovation, at the Norwegian University of Science and Technology (NTNU) and the Research Council of Norway through project No. 237885 (CASA). The authors would like to thank Mr. Trond Auestad and master students Tormod Grue, Simen Kjernlie, Jonas Rudshaug, Eyvind Hustvedt Evensen and Ruben Løland Sælen for assisting with the various experimental programmes. Acknowledgement are also expressed to Modum Glassindustri and Dr. Octavian Knoll at the BMW Group Research and Innovation Center for providing glass specimens for use in the experimental programme.


