First presented at GPD 2017
Manuel Santarsiero1 , PhD, Ing., MEng, BEng. Eckersley O’Callaghan
Abstract
The structural assessment of laminated components over the entire design life is rather complex, especially if compared to mainstream construction materials. This is because the structural performance of laminated components strongly depends on several parameters, such as temperature. However, limited guidance is provided by code and standards on the relevant boundary conditions to be considered for each relevant scenario.
This work presents a study on a probabilistic approach for the structural assessment of laminated components. More in detail, the interaction between maximum wind and glass temperature is analysed by means of probabilistic methods. The results shows that historical data exhibits a stochastic behaviour characterized by a variable variance as a function of multiple dimensions. It is also shown that probabilistic models need to be used to perform realistic safety assessment over the design life of the components.
Introduction and motivations
The last decades of architecture have been characterized by a large demand for transparency. This trend has led to a significant advancement in glass technology and to a large use of structural components made of glass. Columns, fins, beams, and large loadbearing panels made of laminated glass are no longer exceptions, with dimensions that can nowadays reach 18m.
However, the mechanical response of laminated components is rather complex, especially if compared to standard construction materials. It indeed exhibits a non-linear behaviour that depends on several parameters, such as time2 , surface area, edge length, edge type, toughening process, residual stress and temperature.
The latter plays a major role on the mechanical performance of laminated components subject to bending stresses. This is because laminated components are composed by several glass layers, which are bonded together with laminated interlayer polymers to transfer shear stresses between panels. The structural behaviour of laminated components therefore depends on the structural response of these interlayers. Due to their polymeric-viscoelastic nature, their behaviour is characterized by complex non-linear response, which is a function of several parameters. Moreover, the stiffness values of the interlayer, i.e. storage modulus, loss modulus and phase angle, are some of the main parameters affected by temperature variations.
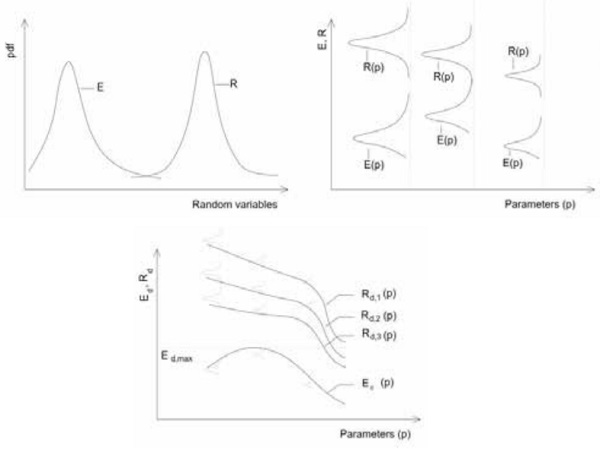
Generally speaking, the structural assessment of structural components is performed by means of a probabilistic comparison of action and their effects (E) to the performance capacity of the components (R). In particular, the assessment is performed ensuring that the objective function3 is larger than zero over the design life. To do so, adequate scenarios and boundary conditions needs to be defined for each relevant action (e.g. wind load, snow load, dead load, etc..). In that regards, when performing structural assessment of laminated components, load duration and temperature values should be defined for each relevant loading scenario. It is therefore essential to establish appropriate and realistic boundary conditions to be considered for each loading scenario, given the non-linear response of laminated components described above.
Limited studies are available in literature on the subject [1]–[6]. Limited indications are also provided by current design standards on the appropriate temperatures and others boundary conditions to be considered for each different scenario. The available approaches tend to be either conservative or not accounting for the actual project specific boundary conditions. In addition, they usually make use of deterministic or empirical assumption on the interaction between different stochastic variables. Based on the above considerations, it is instead essential to establish sensible and realistic temperature values to be considered when performing the performance assessment against, for example, design wind loads (or other scenarios like condensation or thermal shock risk assessment).
Based on the above, structural engineers are therefore called either to make empirical assumptions based on their engineering judgment or to perform structural assessments based on extremely conservative assumptions. This, often, has a large impact on the design, construction and costs of glass components. In addition, it does not allow to perform a realistic and correct assessment of the actual reliability level of structural systems.
It is therefore suggested a methodology to establish the appropriate design scenarios is used in the structural assessment of laminated components. It requires a systematic method to evaluate the actual boundary conditions to be considered for different relevant scenarios when performing structural performance assessments. This should be based on probabilistic approaches and models that (i) account for the stochastic nature of the actions and (ii) allow to perform realistic assessment of structure reliability over the entire design life. This work therefore aims to provide a first initial contribution to this topic. More in detail, an overview of the method is first presented in the following section. Then, an simple application example is presented, the results of which are analysed and discussed. Finally, conclusions and future consideration are given.
Methodology
This section presents a short overview of the proposed probabilistic methodology. Firstly historical data from weather station is collected. Data set should contain the stochastic variable of interest such as air temperature, wind 3-second gust speed, radiation, relative humidity, snow depth, etc. measured over certain time frame. Data is post-processed, filtered and low quality measurements are excluded. Historical data should be collected for a relatively large period. However, the time period does not necessary need to be equal or larger than the target return period. Shorter time frame could be considered, as long as statistical tests show a satisfactory representativeness of the population.
Data is then post processed and analysed. Frequency and distribution analyses are performed to evaluate the stochastic behaviour of the random variables under consideration over time. The correlation between variables, such as maximum wind speed and air temperature, is also analysed using probabilistic approach. Radiation data is then analysed and continuous analytical function are to be derived to compute the temperature in the glass component.
Finally, the full set of post-processed data is used to derive a full probabilistic non-linear model. The model is (i) defined over several dimensions (e.g. time, temperature, etc..) (ii) capable of account for variable variance over the dimensions and (iii) capable to take into account different values of exceeding probability and confidence interval. The structural assessment can then be performed either by means of interaction curves at selected exceedance probability or by full probabilistic approach. Given the analytical complexity of the probabilistic models and the scale of the data sets to be analysed (usually in the order of several millions values), the algorithms and method described above are implemented in Python scripts.
Analysis and discussion
In this section, the analysis and results of the proposed method are briefly discussed by means of a simple example. As the objective of this study is to give a brief overview of the method rather than specific values (which are dependent on the location), the data presented in this section are normalized with respect to the maximum values.
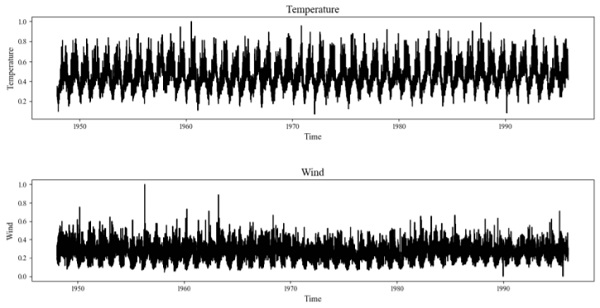
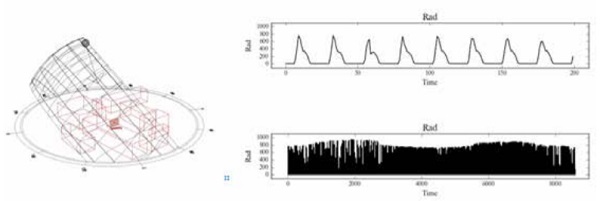
Figure 2 shows the behaviour of the temperature and the 3-seconds gust wind speed (here simply indicated as wind speed for the sake of brevity) measurement over time. More specifically, the graphs show data for San Francisco (US) between 1st of December 1948 to the 30th March 2017 (approx. 68 years of data, above 10milions data points). From the graphs it can be observed that the behaviour of maximum wind speed and temperature data shows a typical stochastic nature over time. Moderate values are indeed occurring with high frequency, while extreme values are observed with low frequency. Statistical extreme value analysis is therefore needed to be provide a more quantitative evaluation of these data.
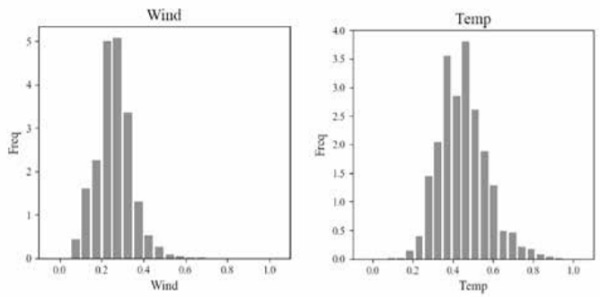
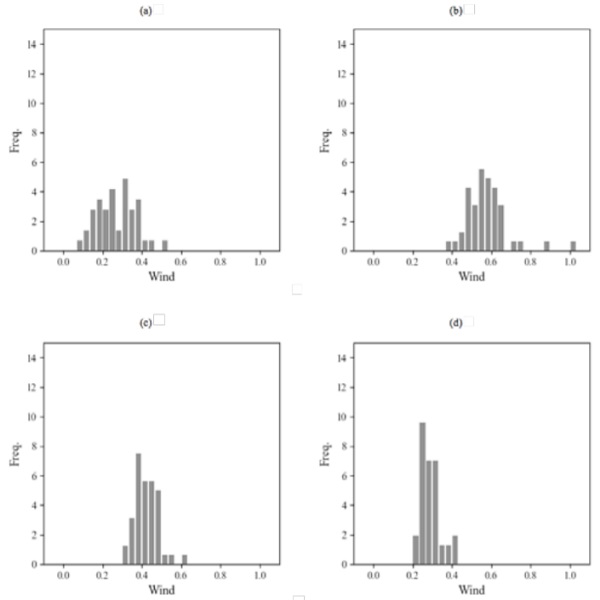
Figure 3 shows then frequency histograms of the maximum 3-second wind speed and maximum temperature data. As expected, maximum wind speed and maximum temperature values show typical behaviour of non-linear extreme distributions. In particular, the right-hand tails of the populations appear to be statistically more spread than the lefthand side. The population seems to follow a non-symmetric probability density function, with mode and medial on the left-side of the mean.
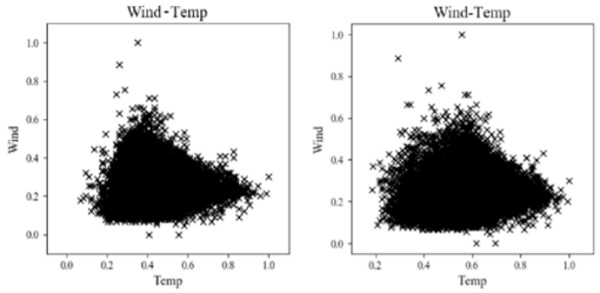
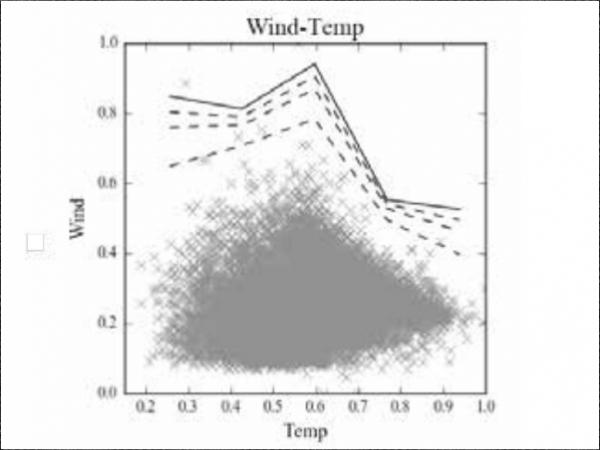
The graph of Figure 4 collects the maximum wind values plotted against the corresponding temperature measured over time. Several observations can be made from this graph. Firstly, it is observed that the maximum wind speed is not occurring at temperature value equal to the maximum temperature measured of over the entire time-frame of the historical data. Large wind speeds are indeed generally occurring at temperature values lower than maximum one. If compared to the extreme maximum value, the wind speed generally decreases at high and low temperature. It can also be seen that the frequency of low wind speed is considerably lower than then maximum one occurring across the full range of temperature.
Therefore, it is apparent the hypothesis of maximum values of temperature and wind occurring at the same time is not theoretically correct, it is very conservative and above all, it does not allow for a uniform level of exceedance probability. In addition, it can also be observed that an ‘envelope approach, (which would consider for instance a maximum envelope of the data set) would not be appropriate or correct. This is because (i) the results would be dependent on the time-frame used to collect historical data (ii) it is deterministic (iii) it is extremely sensitive to outliers and (iv) does not provide an homogeneous level of reliability. Instead, data should be used to determine the probabilistic behaviour of the stochastic variables and the structural assessment should be performed at homogeneous exceedance probabilities over the multi-dimensional domain.
From these graphs it can also be observed that to describe correctly the stochastic nature of these variables, a probabilistic non-linear model, that is able to account for a variable variance over the multi-dimensional space of the problem (e.g. wind-temperature-radiation in this example) is needed. From Figure 4, indeed, it can be seen that the stochastic nature of the random variables varies at different location of the considered space. In order to evaluate more in detail how the variance of the stochastic variables behaves data is now further post-processed and plotted in Figure 5 focusing on the effect of temperature.
The graphs of Figure 5 show that the stochastic behaviour of the maximum wind speed changes as a function of the temperature4. It can be observed that, for this example, the average of values decreases at high temperature, with maximum values occurring between 10°C and 20°C. As for the average, maximum and minimum values also vary with the temperature.
Figure 5 also shows that (in addition to mean, maximum and mean values) the statistical nature of the population distribution, and how it is spread over the domain, changes at different temperatures. The derivation of a probabilistic interaction between these stochastic variable, should therefore implement a non-linear variable variance over the multi-dimensional space. Consequently, both position, shape and scale parameters of the probability density function exhibit non-linear variably behaviour. For this type of problem extreme distributions usually are used (however any type probability density function can be implemented). The more appropriate type of probability density function (e.g. Log-Normal, Gumbel, three-parameters-Weibull and many others) is then selected as the one that provide best performance in term of statistical tests and residuals analysis.
The following step is to account the effects of other relevant boundary conditions (for example the solar radiation), which also changes with time. This step allows to convert the air temperature, and the correspondent radiation over time, into the temperature of the laminated components. First, an analytical equation that describes the radiation over time of a specific component is derived5 . Then, given the appropriate boundary conditions, the temperature in the glass component is computed over time (see Figure 6).
This can be done by means of (i) simplified indications provided by standards and guide lines (ii) simplified method that allows to compute the components temperature considering an equivalent monolithic components as performed in [4] and (iii) by more advanced analytical and/or numerical approach. The probabilistic model can then be derived over the different dimensions, e.g. time, temperature, wind speed, radiation, etc. This allows then to compute the interaction curves that can then be used to perform the structural assessment of the laminated components. More specifically, the actions (e.g. wind) and their effects can be estimated as a function of the different considered scenario ensuring an homogeneous exceeding probability6 .
This is done computing objective curves of the event under consideration as function of temperature at given exceeding probability7. Note that this computation depends the stochastic nature and distribution of the models, which varies from point to point in the multi-dimensional space, as shown in the one-dimensional example above shown in Figure 5. Given the target exceeding probability, the correspondent average recurrence interval (sometimes also indicated as return period) can also be computed.
The curves should be computed taking into account, not only the exceeding probability of the event, but also the target confidence interval. More specifically, a one-side asymmetric confidence intervals estimate should be implemented. It is important to note that confidence interval can be often estimated by means of closed form equation when the population can be described by normal distribution or other simple distributions. However, when extreme-distributions are used, or when the distribution is a-priori un-know, the complexity of the computation increases significantly8 .
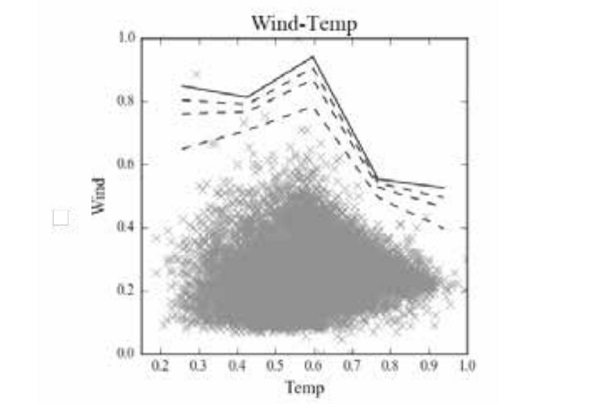
Figure 7 shows an example of probabilistic interaction curves computed at different exceedance probabilities as a function of temperature. This allows a realistic evaluation of the actions and related effects on laminated components for each relevant scenario to be performed. The process described above should then be repeated for each9 panel or components to ensure the entire structural system satisfy the performance required for the entire design life.
Finally, it is worth mentioning that an alternative approach would be the full probabilistic method. This would represent the most accurate approach for the structural assessment as it allows computation of the total probability of failure over the entire design life of the system. The assessment is performed making use of the analytical probabilistic expressions of both action and resistance. The total probability of failure is then computed as function of time and the assessment is performed ensuring that the computed probability is lower than acceptable limits10 over the entire design life. This approach can be sometimes computationally expensive and as such tends not to be widely adopted in structural engineering.
Conclusion
This work presents a first study on a probabilistic approach for the structural assessment of laminated panels. In details, the interaction between maximum wind and glass temperature is analysed by means of probabilistic approach. The study shows that data exhibits a stochastic behaviour characterized by a variable variance over multiple dimensions such temperature and time. It is also shown that probabilistic models need to be used to perform realistic safety assessment over the design life of the components.
The preliminary results presented in this study should only be considered as an example, with the aim to provide a brief overview of the methodology. More detailed analysis is to be performed with certified data to complete an extensive scientific study. It should be noted that the proposed probabilistic approach is applied to wind and temperature stochastic variables. However, given its general validity, it can be applied to different type of variables, problems or performance assessment objective functions (e.g. probabilistic assessment of thermal shock, condensation and performance optimization of envelope with passive and adaptive systems).
1 manuel@eocengineers.com
2 More specifically on the stress time-history, due to the static fatigue phenomenon
3 In this work, the objective function involve the mechanical performances of laminated glass panel and loadings. However the method here proposed can be more generally used also for non-structural objective function, e.g. probabilistic assessment of thermal shock, condensation and performance optimization of envelop with passive and adaptive systems).
4 As well as for other parameters, study not here reported for the sake of brevity.
5 This can be done either by simplified equations (which takes into account simply the panel orientation) or by advanced simulation technique (which simulate for both reflection and shadow effect due to surrounding surfaces).
6 This is often defined by national code and standards, and depends on may parameter as type of building, importance of the construction, class of consequences, etc..
7 Following the algorithm developed in [5] and adopted in [7].
8 In such cases closed solutions are usually more complex to derive analytically. This can be done by means of different methods can be used, such as the one used in [5]
9 Indeed, each panel is potentially subjected to different radiation values at any point in time (thus to different temperature). This can be due to different location, inclination, adjacent surfaces etc.
10 This is often defined by national code and standards, and depends on many parameters as type of building, importance of the construction, class of consequences, etc.
References
[1] F. Wellershoff, “Bemessungsschubmodulwerte für Verbundglasscheiben,” Stahlbau, vol. 76, pp 177–188, 2007.
[2] N. Grammou and J. Schneider, “Investigation of correlation between snow, wind and temperature during periods of snow .pdf,” in Challenging Glass 4 & COST Action TU0905 Final Conference, 2014.
[3] P. Lenk, V. Marinov, and L. Rammig, “Structural glass envelops - Implementation of enviromental studies into viscoelastic analysis,” J. Facade Des. Eng., 2014.
[4] A. Baldini, L. Rammig, and M. Santarsiero, “A systematic methodology for temperature assessment in laminated glass components,” in Engineered Transparency, 2016.
[5] M. Santarsiero, “Laminated connections for structural glass applications,” Thesis Dissertation, École Polytechnique Fédérale De Lausanne - EPFL, 2015.
[6] G. Sedlacek, K. Blank, W. Laufs, and J. Güsgen, Glas im Konstruktiven Ingenieurbau. Berlin: Verlag Ernst & Sohn, 1999.
[7] M. Santarsiero, C. Louter, and A. Nussbaumer, “Laminated connections for structural glass applications under shear loading at different temperatures and strain rates,” Constr. Build. Mater., vol. 128, pp. 214–237, 2016.