Article Information
- Digital Object Identifier (DOI): 10.47982/cgc.8.444
- This article is part of the Challenging Glass Conference Proceedings, Volume 8, 2022, Belis, Bos & Louter (Eds.)
- Published by Challenging Glass, on behalf of the author(s), at Stichting OpenAccess Platforms
- This article is licensed under a Creative Commons Attribution 4.0 International License (CC BY 4.0)
- Copyright © 2022 with the author(s)
Authors:
- Maximilian Möckel - Institute of Building Construction, TU Dresden
- Katharina Lohr - Institute of Building Construction, TU Dresden
- Christian Louter - Institute of Building Construction, TU Dresden / Structural Design & Building Engineering, TU Delft

Abstract
All-glass structures have become increasingly popular with architects and builders in recent years. Glass surfaces are becoming larger and more impressive, while connections are being decreased to obtain maximum transparency. The supporting structure of glass facades, glass roofs or walk-on glazing is mostly made of metal. One of the reasons for this are the fire protection requirements. To increase the overall transparency load-bearing glass structures have recently been given more attention.
However, their use is currently still limited due to the concerns about glass performance in case of fire. Within a research study at TU Dresden load-bearing tests in a furnace were carried out to examine the load-bearing behaviour of glass beams exposed to fire. Different glass types and interlayer materials were tested with varying loads. This study provides a closer look at fire performance of glass beams and proposes further examinations to increase the load-bearing capacity in case of fire.
1. Introduction
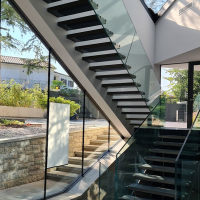
Glass is applied in structure in various manners, ranging from all glass structures, to combinations of steel and glass. Fig. 1 shows two examples of fire resistant glazing placed on a steel substructure (the 21c Museum Hotel in Nashville (Fig. 1, left) and the Arabeska in Munich (Fig. 1, right)). In case it would be desired to replace the steel substructure by load-bearing glass beams, these beams should also provide a certain degree of fire resistance. Furthermore, in case structural glass members (e.g. glass columns and beams) would be applied in a multi-storey arrangement, strict requirement would apply to their fire performance. However, little is currently known about the fire resistance of such structural glass members. Therefore, this paper examines the fire performance of structural glass beams. This is done by means of a series of exploratory fire tests on small scale structural glass beams.
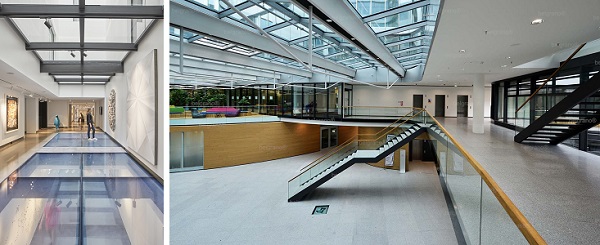
Both glass floor and glass roofs in Fig. 1 are made of fire resistant glazing, which is composed of two glass panes with a special fire protection material in the cavity. Its primary task is to separate two areas and prevent the spread of fire from one area to the other. In the example of the glass floor, it also serves as walk-on glazing. To increase the transparency the load-bearing substructure could be made of glass. However, the fire performance of load-bearing glass structures is an under-researched topic. So far, there are only a few small research studies on this topic. Due to the increasing use of glass in load-bearing structures, the fire performance is becoming more important.
This paper presents the results of a test series that was carried out as preliminary examination for upcoming research projects focusing on fire performance of structural glass beams. In this study, eight specimens were tested in two fire tests to investigate the fire performance of glass under mechanical load.
2. State of research
Several research projects have already looked at the effects of high temperatures on the load-bearing behaviour of glass. However, only some of them explicitly dealt with the load-bearing behaviour of glass beams exposed to fire. Table 1 shows a comparison between the specimen dimensions of five studies on fire behaviour of glass beams. Early studies, by Veer et al. (2001) and Bokel et al. (2003) examined the fire resistance of small glass beams with a spot load of exposed fire. In later research, Louter et al. (2016) and Louter et al. (2021) examined explicitly the load-bearing behaviour of glass beams completely exposed to fire. Very similar tests were carried out by Sturkenboom (2018).
Table 1 Comparison of different research studies.
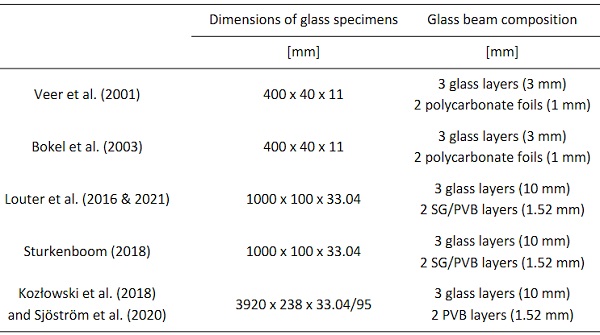
Other studies, by Kozłowski et al. (2018) and Sjöström et al. (2020) focused on the load-bearing behaviour of timber-glass composite beams under fire load. They used laminated glass beams with adhesively bonded timber flanges to examine if a 30 min fire resistance could be provided.
The aim of this study is to provide better understanding of the fire performance of structural glass beams. It is an extension of the research of Sturkenboom (2018) in which a similar set-up was used as seen in Fig. 11 left.
3. Specimen
In the research carried out at TU Dresden, eight glass beams were tested. Fig. 2 shows a cross section and the dimensions of the specimens, which are identical to the specimens tested by Louter et al. (2016 & 2021) and by Sturkenboom (2018). The specimens consisted of laminated glass specimen made of three glass panes of the same glass type with a thickness of 10 mm each. The interlayers had a thickness of 1.52 mm each. The dimensions of the specimens were 1000 mm in length and 100 mm in height.
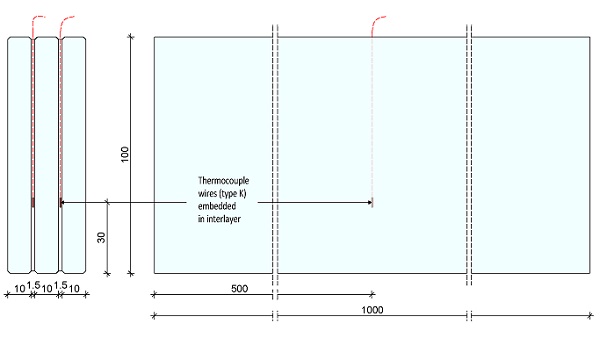
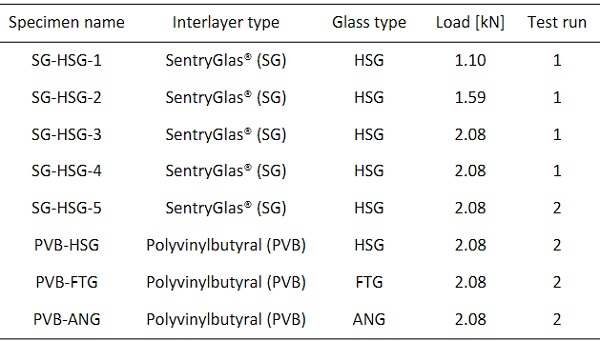
To measure the temperature during the fire tests every glass beam had two thermocouple wires embedded in every interlayer. Regular soda-lime silica glass was used in this research. Eight specimens were tested. To examine the influences of different glass types, interlayer types and load level, multiple combinations of specimens were tested in this research. Table 2 shows the overview of the specimens. The study included three different glass types, annealed (ANG), heat strengthened (HSG) and fully tempered (FTG) glass. Additionally, regular Polyvinylbutyral (PVB) and SentryGlas® interlayer was applied in the laminated glass. Due to the use of a small furnace, four specimens could be tested in one run. Therefore, the eight specimens were tested in two test runs.
Table 2 Overview of specimens.
4. Method
Test set-up
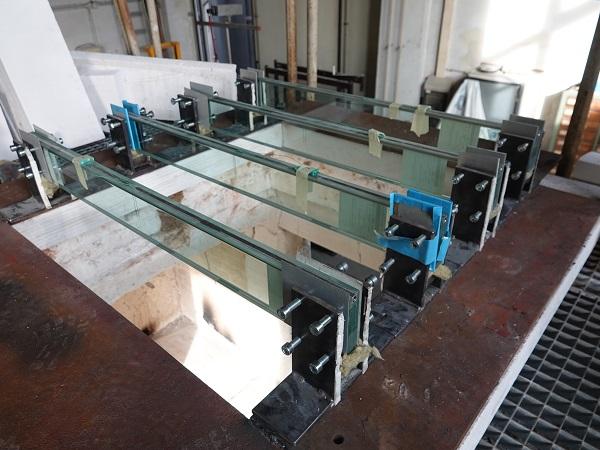
The static concept of the fire tests is based on the EN 1288-3. The set-up is built as a four-point bending test with two support points and two load introduction points on the top of the beam. The glass beams were supported vertically at both ends. Fig. 3 shows four specimens vertically standing above the fire test furnace. Eight screws at both ends of each specimen prevent the beam from buckling during the test.
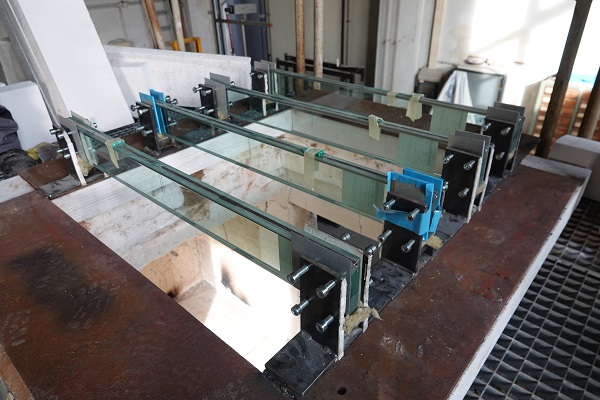
The fire test furnace that was used for this research study is a small furnace for fire resistance tests of building elements according to the EN 1363-1. The fire chamber has a size of 1 m x 1 m x 3 m with an opening at the top of 1 m x 1 m. The beams were placed above this opening, which is shown in Fig. 3. Fig. 4 shows the test set-up with the built-in specimen and a detail of the load introduction. The beam stands vertically on two hinged supporting elements. The load introduction rig was designed with movable cylinders in order to avoid constraints.
The beams were loaded in bending about the strong axis. On top of the rig stands the static load, which was chosen between 1.10 kN, 1.59 kN and 2.08 kN. The level of the load results from the dimensions of the load application rig. The plate on top of the rig had a size of 300 mm x 200 mm. Therefore, maximum four steel plates (50 kg each) could be applied. The rig itself had a weight of 13 kg. To examine the influence of different load levels on the load-bearing behaviour, the four HSG specimens of the first run were loaded with different load amounts. Table 2 shows the applied load on each specimen.
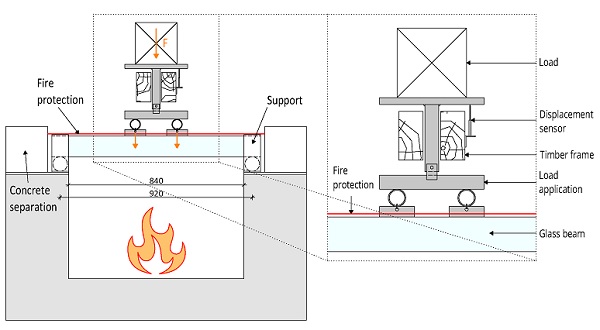
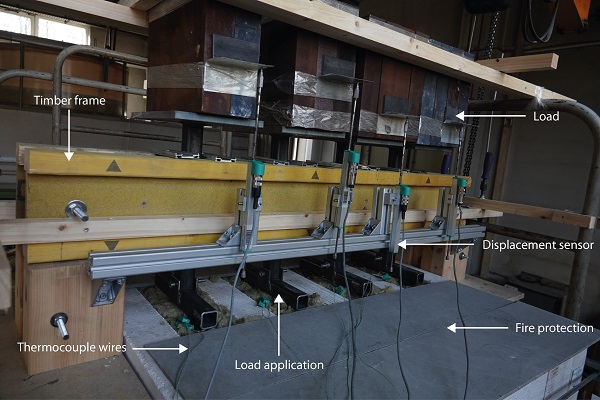
A timber frame prevents the load introduction rig from lateral movements. Additionally, it limits the maximum deflection of the glass beams. Thus, in case of failure the load could not fall through the opening of the fire furnace. In addition, the displacement sensors were applied on the timber frame to measure the deflection of the beams. Fig. 5 shows the final test set-up. The specimens were surrounded with a fire protection wall. Rock wool and fire protection plates form the top closure of the fire chamber.
By choosing annealed glass in comparison to the other glass types, the expected behaviour was that the annealed glass beams fail earlier due to high temperature differences at the start of the test. To examine the behaviour of the different interlayer types, both SG and PVB were tested. In addition, the expectation was that the beams with a higher static load fail earlier than the
Measurements
Both test series were carried out with the standard temperature-time curve, which is defined in EN 1363-1. To adhere to the curve and measure the temperature inside the fire test furnace, four thermocouple wires were placed inside. At the same time, the embedded thermocouples inside the glass beams measured the temperature in every interlayer. Thus, a correlation between the temperature in the furnace and the temperature inside the beams could be established.
Fig. 5 shows the test set-up including the thermocouple wires coming out of the furnace and additional displacement sensors on the timber frame. The EN ISO 13943 defines the fire resistance as the “ability of a test specimen to withstand fire […] for a period of time”. In addition to that, the EN 13501-2 gives the failure criteria for different types of structures. Especially for beams, the standard defines two failure criteria – the maximum deflection and the maximum deflection rate. Both values depend on the span of the beam. One displacement sensor per beam was placed under the load rig to measure the deflection during the fire tests.
5. Results
Within the evaluation of the results, the following diagrams compare the beam temperatures with the furnace temperatures, the results of the deflection and the deflection rate. In both test runs, the beam temperature does not increase proportionally with the furnace temperature. Fig. 6 shows the diagrams to compare the beam temperature with the furnace temperature. The black line defines the furnace temperature, which is the mean value of four measurement points inside the furnace. The black dashed line marks the ideal furnace temperature according to EN 1363-1. The coloured lines define the beam temperatures. The temperature inside the beams did not increase as much as the temperature in the furnace.
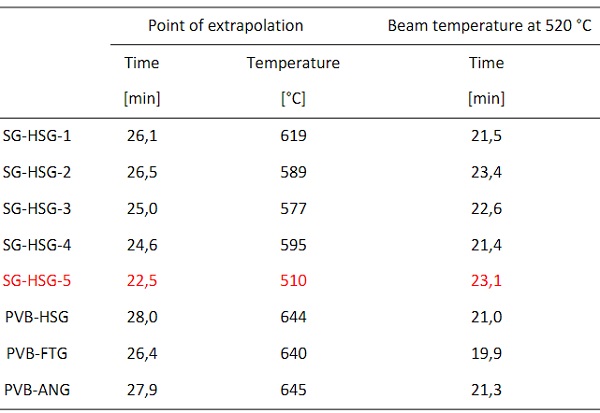
At temperatures above 510 °C, the thermocouple connectors melted. Therefore, the beam temperature could not be measured over the whole test time. In order to be able to compare the results of the specimens with each other, the temperature was extrapolated to the end of the test. The crosses in the diagrams in Fig. 6 mark the exact point when the connectors melted. These points are considered point of extrapolation. Table 3 shows the exact times and beam temperatures of the last measured data. Additionally, Table 3 also shows the time stamps when the beam temperature reached 520 °C. This is the transformation temperature of soda lime silica glass. Only the thermocouple connector of the specimen “SG-HSG-5” melted before reaching this temperature. It is marked in red. Therefore, the time of reaching 520 °C for this beam is an estimation.
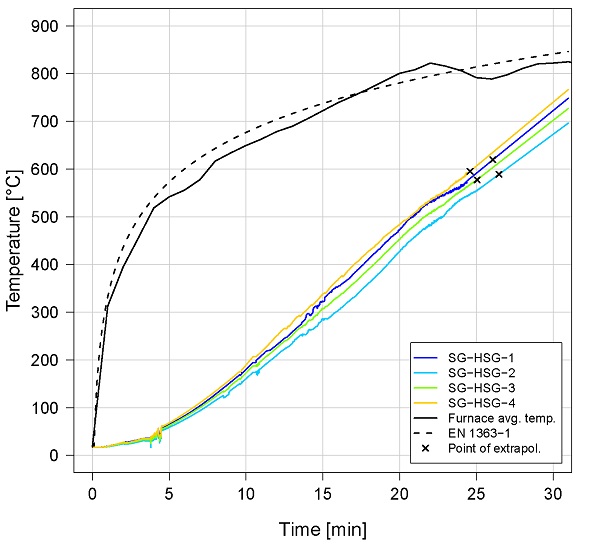
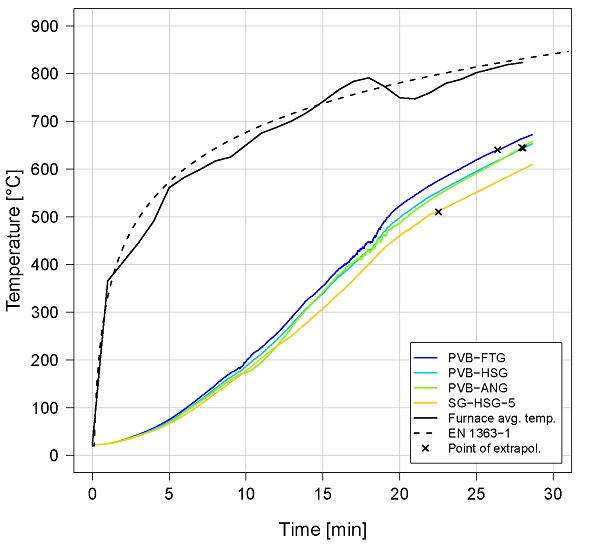
Table 3 Time and temperature of the last measured data and time at beam temperature 520 °C.
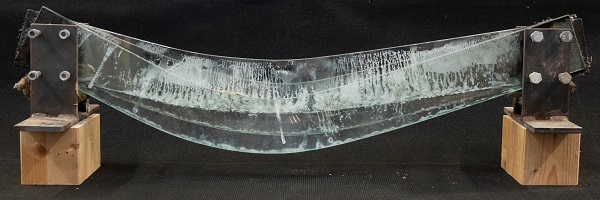
According to the measured temperatures and due to the low glass transition temperature of PVB and SG, it is assumed that the interlayer foils began to melt already at the beginning of the fire tests. Fig. 7 shows the specimen “PVB-HSG” after the fire test. The white residue is the rest of the PVB interlayer. At both ends of the beam, the PVB is burnt. The three single glass panes show a high displacement. The outer panes tilted to the side while the middle pane stayed nearly in its initial line.
The first thing that stands out is that no beam fractured due to thermal stress. In order not to exceed the maximum deflection of the sensors, the deflection of the beams was limited to about 70 mm with the timber frame. All beams melted until they reached the maximum deflection of 70 mm and the test wasstopped. To measure the deflection of the beams the displacement sensors were placed under the load, see Fig. 5. This prevented the sensors from melting.
EN 13501-2 defines two failure modes for beams:
Limit deflection:

Limit deflection rate:
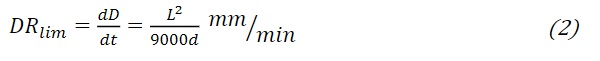
Where:
L is the support distance, in millimetres;
d is the distance from the outer edge of the compression zone to the outer edge of the tensile zone of the beam, in millimetres.
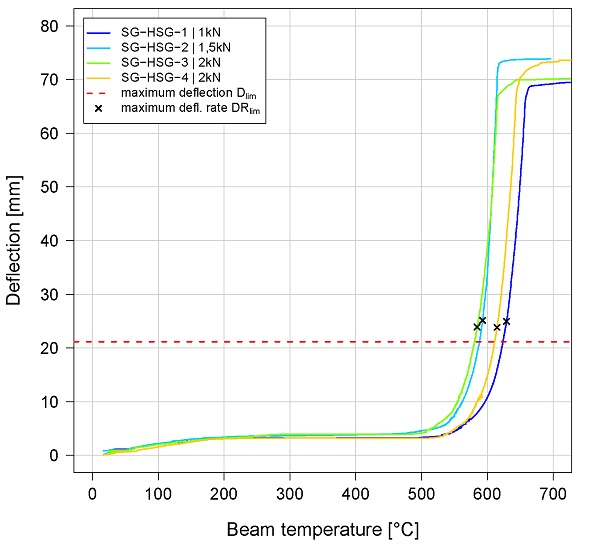
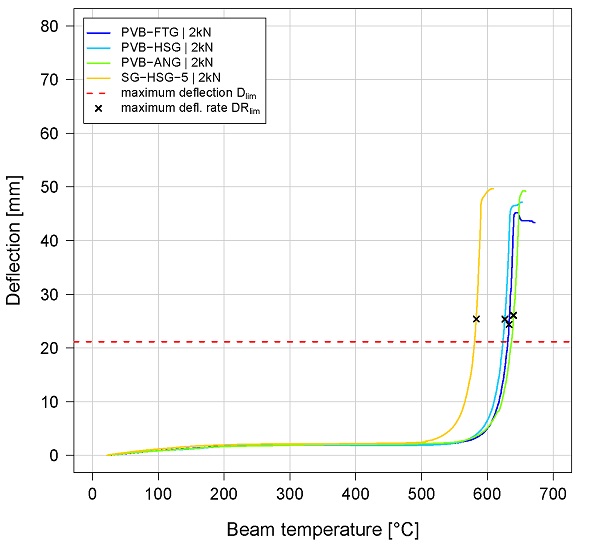
The diagrams in Fig. 8 represent the measured deflection depending on the beam temperature. The left diagram in Fig. 8 shows the deflection – beam temperature curve of the first test run. The different colours mark the four beams. The red dashed lines mark the maximum deflection Dlim according to equation (1) of 21.16 mm for the support distance L = 920 mm and the specimen height of d = 100 mm. The crosses define the point of reaching the maximum deflection rate DRlim according to equation (2) of 0.94 mm/min. Table 4 shows the exact values for the time and beam temperature when the specimens reached the maximum deflection or deflection rate. After finishing the first run, most of the single glass panes fell right into the furnace due to high deflection. Therefore, in the second run the deflection was limited to about 45 mm, see the right diagram in Fig. 8.
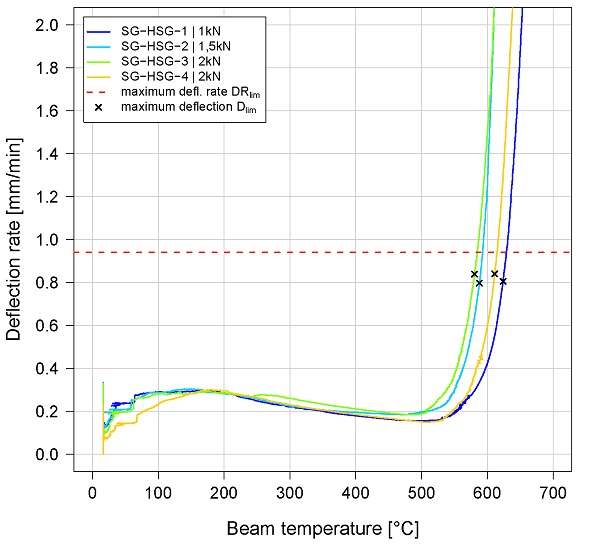
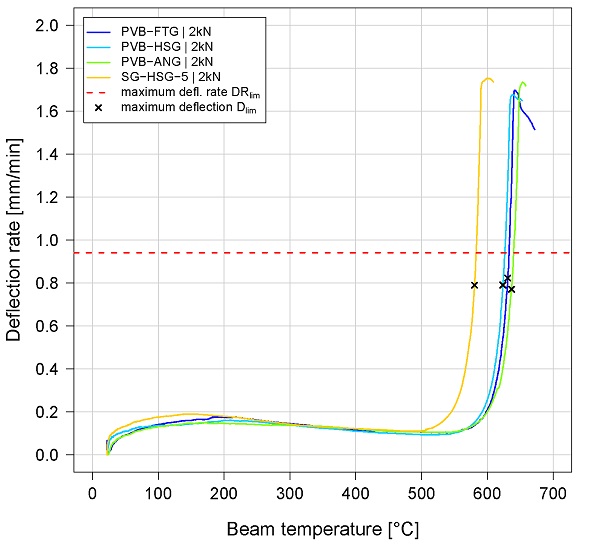
The two diagrams in Fig. 9 show the deflection rate depending on the beam temperature of the first and the second run of the fire tests. Here, the red dashed lines mark the maximum deflection rate while the crosses mark the points of reaching the maximum deflection. All specimens reached the maximum deflection between 25 – 28 min.
To compare all the results, Table 4 shows the time and beam temperature of all specimens at the limits according to EN 13501-2. Both the points of maximum deflection and maximum deflection rate are close to each other. Especially, the specimen “SG-HSG-4” reached the maximum deflection rate 8 s after reaching the maximum deflection. With the mention that the temperature is extrapolated, the temperature difference for this specimen is 4 K between both limit values. The highest time difference between reaching both limit values is 12 s for specimen “PVB-ANG” while the temperature difference is 3 K.
Table 4 Time and beam temperature at limits defined in EN 13501-2.
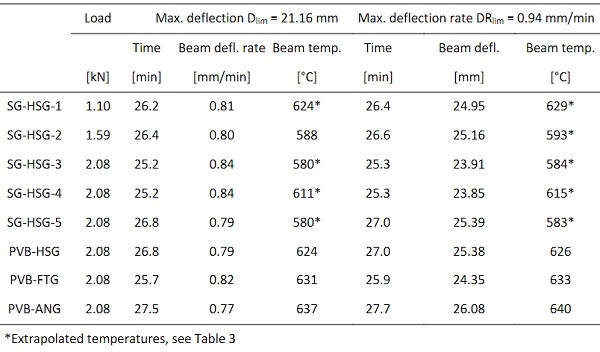
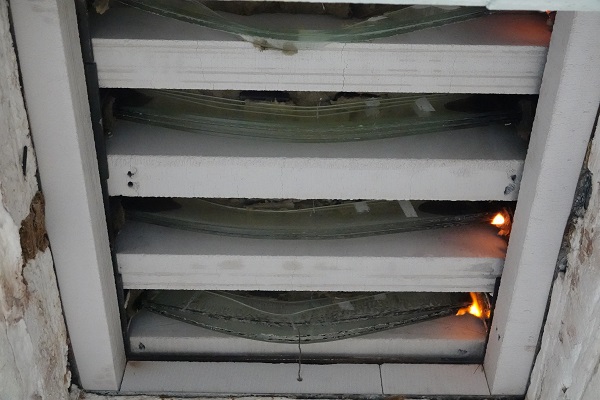
Fig. 10 shows three specimens photographed from below directly after the test. The white blocks are the concrete separation between the specimens and the fire protection to the outside of the furnace. In the last two specimens, the interlayer is still burning after the test.
6. Discussion
In comparison with the reference research studies the curves of the beam temperature in Fig. 6 did not show the expected behaviour. Instead of following the shape of the standard temperature-time curve, the temperature of all beams increased nearly linearly. Differently to the reference papers, the beams in this study were not applied directly inside the furnace. Fig. 10 shows that the beams were applied on top of the upper opening of the furnace. In combination with the concrete separation blocks and the small space between the concrete and the beams, it could be that the temperature distribution inside the furnace was at this point not exactly like in the fire chamber. However, compared to the results of Sturkenboom (2018) where no separations were used, the temperature curves of the tests are similar to the ones in these tests. The results are closer to reality when there are no separations between the beams. For further research they should be left out.
The thermocouple connectors melted too early. Especially, for the specimen “SG-HSG-5”, the measurement stopped before the beam reached the temperature of 520 °C. In further research studies all measurement devices should be better protected from the heat coming out of the upper opening of the furnace. Thus, safe results will be achieved.
All specimens of the two test series from this study began to deflect nearly at the point when they reached the beam temperature between 520 °C and 550 °C. This correlates with the transformation temperature of soda lime silicate glass.
The results of this research study can only be compared with those of Sturkenboom (2018). The reason is the difference in the test set-up in Louter et al. (2016 and 2021). The cross section in Fig. 11 (left) shows the set-up of this research study. The whole laminated glass beam was inside the fire test furnace. The Rockwool on the top closes the upper opening of the furnace. The test set-up in Sturkenboom (2018) was very similar. They used fire protection plates instead of Rockwool to close the opening. In comparison, in both Louter et al. (2016) and Louter at al. (2021), fire protection plates were used to close the furnace, too. The difference is that the fire protection plates cover the upper area of 30 mm of the beam, see Fig. 11, right.
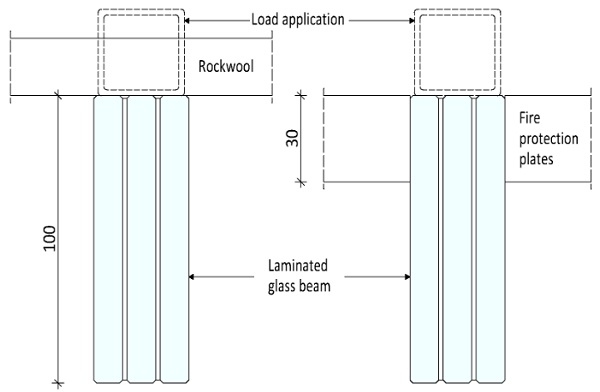
Therefore, some specimens in the studies of Louter et al. reached the maximum deflection rate at times between 33 min and 52 min and at temperatures from 700 °C. However, these fire protection plates do not represent the application case pursued by this research study. Therefore, only the results of Sturkenboom (2018) are used for the following comparisons.
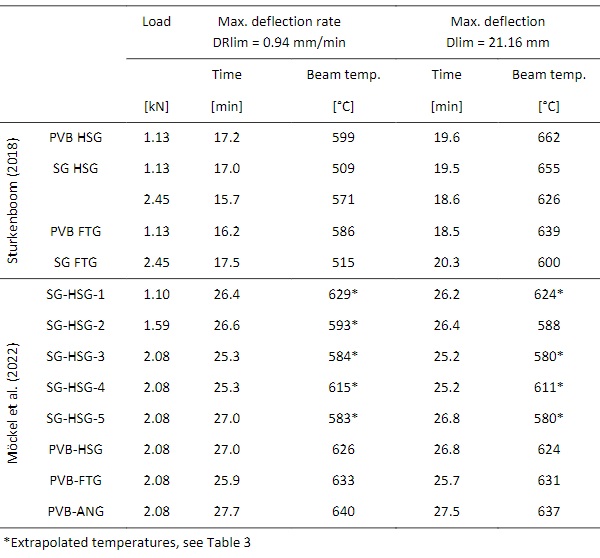
The first thing that stands out is that all beams reached the maximum deflection before the maximum deflection rate. In the reference studies mentioned in section 2, all specimens failed due to reaching the maximum deflection rate. Especially in Sturkenboom (2018), the beam specimens reached the maximum deflection up to 3 min later than the maximum deflection rate, see Table 5. In addition, the time and temperature gaps between the points of Dlim and DRlim are lower than in Sturkenboom (2018). The highest time gap is 12 s and the highest temperature gap is 5 K. In comparison, they equal 174 s and 146 K in the reference study.
Table 5 Times and beam temperatures at limits defined in EN 13501-2 (Sturkenboom 2018, up and this study, below).
A correlation between the applied load and the failure time or temperature could not be established. In comparison to the calculated strength of the annealed glass beams of maximum 6.38 MPa and due to the load of 2.08 kN, the annealed glass beam was overloaded by 130 %. In contrast, the fully tempered beam had a 14 % utilization ratio. Therefore, the expectation was that the specimens with higher load and lower strength fail at first. Comparing the values in Table 4 and Table 5 some specimens with a higher load (e.g. PVB-ANG with 2.08 kN) failed later and at a higher beam temperature than other ones at a lower load (e.g. SG-HSG-3 with 1,59 kN). This is an unexpected behaviour. Further research studies should focus on the examination of the fire behaviour under loads than 2.5 kN.
7. Conclusion
This paper presents the results of tests on laminated glass beams under static in-plane load exposed to fire. The examinations showed that the specimens resisted the fire and sustained the load for 25 – 28 min before failing due to exceeding the maximum deflection according to EN 13501-2. These results are comparable to the ones of Sturkenboom (2018) due to the similar test set-up and equal glass composition. The failure times and temperatures are marginally higher in this research than in the master thesis of Sturkenboom (2018).
Further research should use a test set-up without covering any area of the beam so that the specimens are fully exposed to the fire. Additionally, higher loads could be an option for further research to examine the influence of the load level on the failure time of the beams. For loads above 3 kN a hydraulic press could be used for the tests. The steel plates in this research and the bricks in the research of Sturkenboom and Louter et al. would become very unstable with increasing load.
The results of this research confirm the results of Sturkenboom (2018) that laminated glass beams can not resist the high temperatures of a fire long enough to meet the requirements of the standards of at least 30 min. Further research should concentrate on how the glass could be protected for a long time to postpone or prevent melting. The upcoming research project at TU Dresden will develop a method to protect the surfaces and the edges of the glass beam without limiting its transparency. Additionally, FE-simulations like in Louter et al. (2021) will be used to examine the heat flow through the glass panes of the laminated glass beam. In addition, FE simulations will be used to pre-select materials and set-ups before the tests will be carried out.
8. Acknowledgements
The tests have been performed at the laboratory of MPA Dresden GmbH. We would like to thank the company for the support in preparing and realizing the fire tests.
9. References
Bokel, R., Veer, F.A., Tuisinga, L.: Fire resistance of glass Glass processing days / educational glass conference, 362–363 (2003)
DIN Deutsches Institut für Normung e.V.: Bestimmung der Biegefestigkeit von Glas: Teil 3: Prüfung von Proben bei zweiseitiger Auflagerung (Vierschneiden-Verfahren). Beuth Verlag GmbH, Berlin 81.040.20(DIN EN 1288-3) (2000)
DIN Deutsches Institut für Normung e.V.: Brandschutz: Vokabular (ISO 13943:2017). Beuth Verlag GmbH, Berlin 01.040.13; 13.220.01(DIN EN ISO 13943) (2018)
DIN Deutsches Institut für Normung e.V.: Feuerwiderstandsprüfungen: Teil 1: Allgemeine Anforderungen. Beuth Verlag GmbH, Berlin 13.220.40; 13.220.50(DIN EN 1363-1) (2020)
DIN Deutsches Institut für Normung e.V.: Klassifizierung von Bauprodukten und Bauarten zu ihrem Brandverhalten: Teil 2: Klassifizierung mit den Ergebnissen aus den Feuerwiderstandsprüfungen, mit Ausnahme von Lüftungsanlagen. Beuth Verlag GmbH, Berlin 13.220.50(DIN EN 13501-2) (2016)
Kozłowski, M., Lenk, P., Dorn, M., Honfi, D., Sjöström, J.: Structural Considerations on Timber-Glass Composites at Fire Scenarios. 229-240 Pages / Challenging Glass Conference Proceedings, Vol. 6 (2018): Challenging Glass 6 CGC 6, 229–240 (2018). https://doi.org/10.7480/cgc.6.2150
Louter, C., Bedon, C., Kozłowski, M., Nussbaumer, A.: Structural response of fire-exposed laminated glass beams under sustained loads; exploratory experiments and FE-Simulations Fire Safety Journal 123, 103353 (2021). https://doi.org/10.1016/j.firesaf.2021.103353
Louter, C., Nussbaumer, A.: Fire Testing of Structural Glass Beams: Initial Experimental Results. In: FCA Conferences, L. (ed) 2016 GlassCon Global Proceedings Book, 143–150, Chicago (2016)
Sjöström, J., Kozłowski, M., Honfi, D., Lange, D., Albrektsson, J., Lenk, P., Eriksson, J.: Fire Resistance Testing of a Timber-Glass Composite Beam International Journal of Structural Glass and Advanced Materials Research 4(1), 24–40 (2020). https://doi.org/10.3844/sgamrsp.2020.24.40
Sturkenboom, J.: Fire Resistant Structural Glass Beams. Master thesis, Delft University of Technology (2018)
Veer, F.A., van der Voorden, M., Rijgersberg, H., Zuidema, J.: Using transparent intumescent coating to increase the fire resistance of glass and glass laminates (zie ook BIM) Glass Processing Days, 392–396 (2001)