Challenging Glass 6
Conference on Architectural and Structural Applications of Glass
Louter, Bos, Belis, Veer, Nijsse (Eds.), Delft University of Technology, May 2018.
Copyright © with the authors. All rights reserved.
ISBN 978-94-6366-044-0, https://doi.org/10.7480/cgc.6.2166
Authors:
Joren Pelfrene, Sam Van Dam, Siebe Spronk, Wim Van Paepegem | Ghent University, Belgium

Laminated glass provides safety in an impact or explosion event by way of a polymer interlayer to which glass fragments adhere upon fracture. The mechanical deformation of the interlayer defines how the impact energy can be absorbed to prevent calamities by flying glass debris, penetration of a blast wave, lacerations, etc. The PVB interlayer used in safety glass shows highly nonlinear viscoelastic material behaviour, with a great sensitivity to temperature and deformation rate. Although various material models for PVB can be found in literature, few publications discuss the full range of its mechanical behaviour and none are found to describe a material model that is valid in a wide range of deformation rates and up to high elongations. Such material model is necessary for the numerical study of the post-fracture response in a dynamic event.
The article describes the mechanical behaviour of PVB interlayer and the constitutive models by which the polymer can be represented under different load cases. Tensile experiments of Saflex® PVB are presented for a wide range of deformation rates and up to tearing of the specimens. Subsequently, a method to calibrate a hyper-viscoelastic material model for the interlayer by numerically simulating the tensile tests is developed. The resulting material models are valid up to the tearing strain of the interlayer and are accurate within a specified range of deformation rates and temperatures.
1.Introduction
Two or more glass plies can be laminated with transparent, polymer interlayer to form a layered material with enhanced characteristics. In construction and for automotive windshield, laminated glass is used mainly for safety purposes. In essence, the interlayer foil will retain glass fragments when the window is fractured. By proper selection of the interlayer material, laminated glass may also be used for reasons other than mechanical. These include acoustic insulation, fire resistance, altering transparency and appearance, blocking of UV light and lamination to photovoltaic cells.
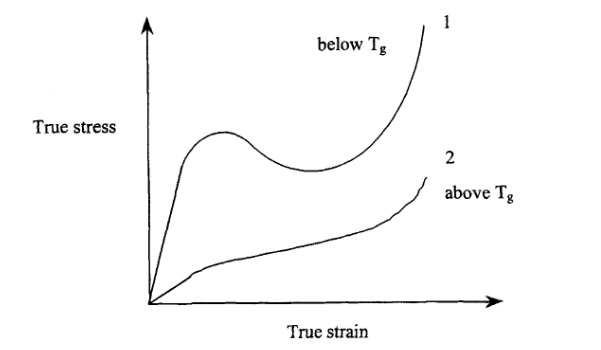
The polymers that are used in structural glass are mainly amorphous thermoplastics and elastomers whose properties can be fine-tuned by various chemical additives and plasticisers. For safety and security purposes, the thermoplastic polyvinyl butyral (PVB) is by far the most used interlayer material. PVB products are manufactured by various companies, notably Eastman™ Saflex® and Kuraray™ (Trosifol®, Butacite®). PVB interlayer can be produced with mechanical and adhesive properties as desired. For laminated safety glass, the most common PVB interlayers, Saflex® R-series and Trosifol® BG-series, have a glass transition temperature TG around room temperature and are relatively flexible (Juang et al., 2001) (see Fig. 1). When stiffer post-fracture behaviour is required, e.g. for glass floors and balustrades, a PVB product with higher TG or an ionomeric interlayer may be used. An example of the latter is Kuraray™'s SentryGlas®, which is a modified polyethylene with strong adhesion to glass surfaces.
Interlayer materials that are less frequently used for safety purposes are the elastomeric ethylene vinyl acetate (EVA) and thermoplastic polyurethane (TPU), which do not require the use of an autoclave for lamination. EVA has low moisture sensitivity and good durability, and is therefore often used as an interlayer in the photovoltaic sector. TPU can be preferred for its good adhesion to polycarbonate, which is used in protective glazing with resistance to burglary and ballistic impact. Also thermosetting Cast-In-Place (CIP) resins may be used for safety purposes, although this product is less commonly applied. Glazing laminated with CIP resin requires a higher manufacturing cost and has poorer low temperature impact performance compared to PVB laminates (Ungureanu, 2011).
In this work, only polyvinyl butyral interlayers are considered, as they constitute the vast majority of interlayers used in laminated safety glass and their performance has proven to be effective under low velocity impact and blast. PVB interlayer is produced from PVB resin, which is too stiff in film form to be used as interlayer directly (Kuraray™, 2012). Plasticisers are added to the resin to make the end product more flexible, as well as decrease the cold-crack temperature. When cured in an autoclave process, the PVB material adheres to glass through hydrogen bridges (Keller and Mortelmans, 1999). The adhesive properties of PVB to glass can be controlled by salt additives that are mixed with the resin. Before lamination, the glass surfaces should also be cleaned from mineral residues that interfere with the bonding of PVB to glass and reduce the overall quality of the adhesion. Subsequently, the glass-film assembly is de-aired in a nip-roll or vacuum process and finally laminated in an autoclave.
When the glass breaks in an impact event, the function of the interlayer exceeds the mere adhesion of glass fragments to avoid propulsion. The PVB foil can absorb a large portion of the impact energy. This takes place by various mechanisms: elastic deformation and material damping, viscous relaxation, and local delamination. The elastic stiffness of the interlayer has a major influence on the forces exerted on the impactor in the post-fractured state. This impactor may in the worst case be a pedestrian in a vehicle crash, for whom the experienced accelerations can be lethal above a critical level. In such case, a softer interlayer may prevent severe injury or worse. Furthermore, an object or air blast wave can penetrate the window when the PVB tears. This can be avoided to some extent by using a relatively soft PVB with lower adhesion grade.
The objective of this paper is to describe the mechanical behaviour of PVB interlayer by a material law that can be used in FEM analysis. This is a key step to finally enable prediction of forces, energies and ultimate failure of a broken laminated glass panel under a given impact or blast load. Section 2 presents a review of the characterisation of PVB in scientific literature. In Section 3, results are given for uniaxial tensile tests of Saflex® R-series PVB interlayer and Section 4 discusses the fitting of a material model to the test results.
2.Characterisation of mechanical properties of PVB in literature
The mechanical behaviour of laminated glass has been a major concern among glass researchers and designers since its first usage. Before 1990, most efforts went into describing a layered-plate model for the laminate as a whole. Experimental research to this end has been conducted by a.o. Behr et al. (1996) and Vallabhan et al. (1987). Later, Vallabhan et al. (1992) characterised the PVB interlayer separately by experiments for simple shear at a very low strain rate and room temperature (21-23 °C). For these conditions, they observed that the shear modulus is less than 1 MPa for small strains and ascends with increasing strain until remaining constant for shear strains greater than 1.5. Upon removal of the load, all specimens returned back to their original state without permanent set.
Juang et al. (2001) studied the viscoelastic behaviour of PVB interlayer near and above the glass transition temperature in order to better understand how the material undergoes processing. They proposed a hyper-viscoelastic material model, valid for low strain rates and around a reference temperature of 65 °C. For the normal operation temperature, i.e. around 20 °C, several authors have performed Dynamic Mechanical Analysis (DMA) tests to characterise the small-strain linear viscoelasticity. By this method, described in detail by Ferry (1980), they have obtained material constants for a Prony series representation, along with the temperature shift function. These models are shown graphically in Fig. 2.
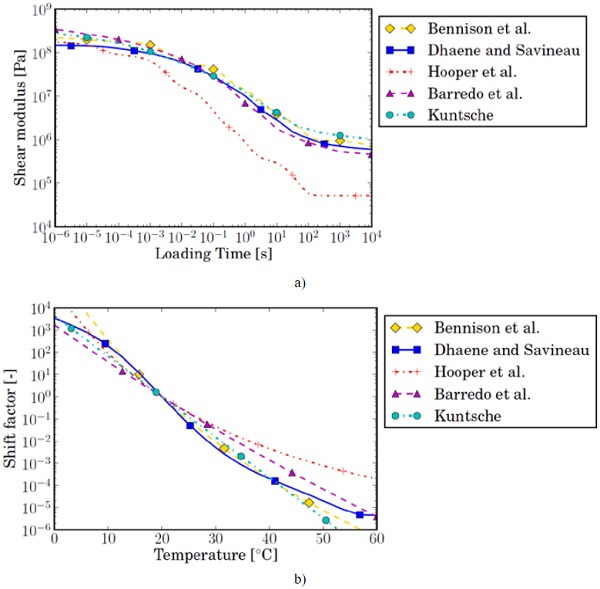
It is important to note that the interlayers that were tested by the different authors were not all of the same type. They do all have the same function in laminated safety glass, which is to absorb energy during an impact and have a glass transition temperature of around 30 °C. The interlayer products for acoustical damping and the high-stiffness variant are not considered. Bennison et al. (1999) worked with Butacite®interlayer, while D'haene and Savineau (2007), and later Hooper (2012), tested Saflex® R-series PVB. Barredo et al.(2011) did not state which type of PVB they have used in DMA-testing. Kuntsche (Kuntsche, 2015) has tested the Trosifol® BG-series interlayer. Interestingly, Kuntsche has also performed DMA tests for other interlayer types, such as EVA, TPU and ionomers.
It is apparent that the material models by D'haene and Savineau, and Hooper differ substantially from each other even though the tested material and the method are the same. The temperature dependency of Saflex R-series PVB, also used in this work, has been characterised alternatively by Van Dam (2017) with the resonalyser method, for which the results are in good agreement with the model of D'haene and Savineau (2007).
The small-strain viscoelasticity is sufficient to characterise the interlayer's behaviour for intact laminated glazing, under both static and transient loading. However, when the glass breaks, the PVB material may rapidly reach a state of high deformation. Very high strains are particularly found in the immediate vicinity of the narrow glass cracks. If the strain becomes too large, the interlayer may locally tear, which can quickly lead to failure of the entire panel. Therefore, in order to conceive a predictive numerical model, it is highly important to also understand the PVB response at moderate and large strains, and over a representative range of deformation rates.
Morison et al. (2007) have performed uniaxial tensile tests on Saflex® R-series PVB at strain rates between 9.4 and 74.2 s-1. The tests were performed for both cured and uncured samples, but no notable difference was observed between their measured responses (which is later confirmed by Van Dam for similar specimens at low tensile loading rates). At all extension rates, the force-displacement results were observed to approach a bilinear relation with a distinguishable stiffness at the low strain range and another, about twenty times lower, for strains of 20% and upwards. Iwasaki et al. (2007) observed a similar bilinear relation in the stress-strain curve for Sekisui S-LEC™ PVB, tested in uniaxial extension at a nominal strain rate of 118 s-1. Despite no permanent set being observed, Morison et al. initially modelled the material as elasto-plastic, but noted high local concentrations of plastic strain, distorting the numerical result. For this reason, they recommend a non-linear viscoelastic constitutive model.
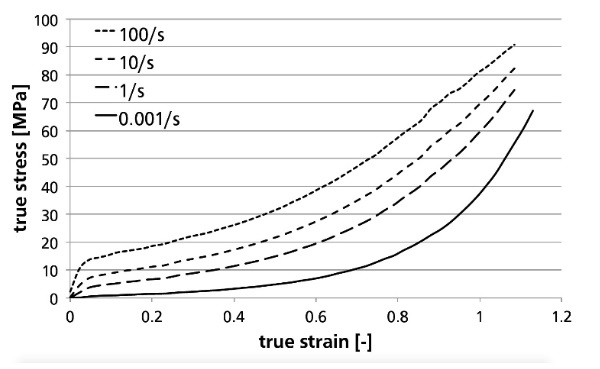
Hooper et al. (2012) also performed uniaxial tensile tests on Saflex® R-series PVB. They described the material behaviour empirically by expressing the small-strain modulus E0, the large strain modulus E20% and the ultimate tearing strain εf as a function of the strain rate. Similar tests on Trosifol® BG-series PVB were performed by Schneider et al. (2012) for both low and high pulling speeds. Schneider et al. made use of the Digital Image Correlation technique (DIC) to obtain the true strains and stresses. Using this technique, they also note that the strain rate during the test is not a constant value. Consequently, they have used an interpolation technique to calculate the behaviour at constant strain rates. For these curves, shown in Fig. 3 the stress-strain relations no longer appear as approximately bilinear. The data from Fig. 3 can be used directly as input for the tabular, rate-dependent hyperelasticity model by Kolling et al. (2007), which has been done for the finite element simulations in (Pelfrene et al. , 2016a).
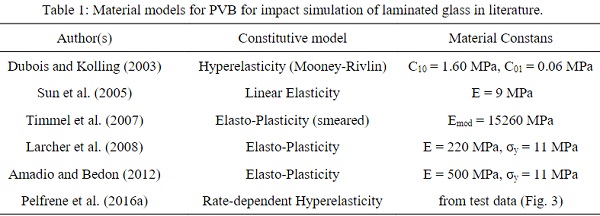
Finally, a selected overview of material models for PVB interlayer used in the numerical simulation of laminated glass under dynamic loading is given in Table 1.
3.Tensile testing of PVB
Considering the differences in material properties for PVB interlayer products by different manufacturers and the strong influence of temperature, it is appropriate to perform additional experiments for the response at large extension of the interlayer considered in this work, Saflex® R-series PVB. The small-strain rheological behaviour for this material is deemed to be sufficiently known by both the DMA experiments by D'haene and Savineau (2007) and the resonalyser technique used by Van Dam (2017).
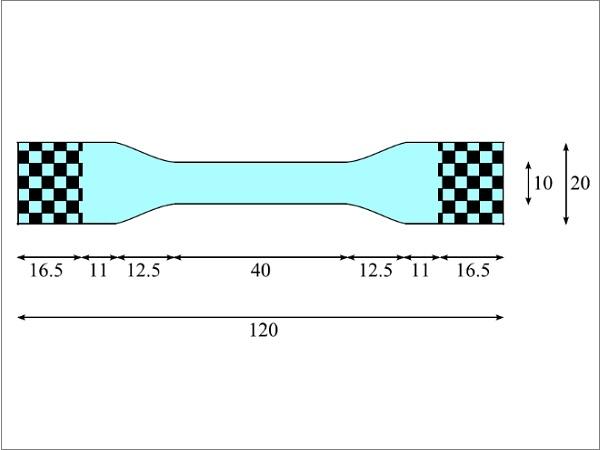
Uniaxial tensile tests are performed for PVB specimens with dimensions as given in Fig. 4. The checkered areas in this figure are glued to cardboard strips of the same size, by which the sample is clamped between machine grips.
![Fig. 4 Dimensions in [mm] of PVB specimens for uniaxial tensile testing; thickness of the specimen is 0.76 mm.](/sites/default/files/inline-images/Fig4_149.jpg)
The specimens are stored at room temperature in the laboratory where they are tested. The temperature is measured on the mounted specimen at the start of each test with a Fluke 561 infrared thermometer. The material is tested for both low and high deformation rates. The low-speed tests are performed on an Instron 5800R tensile testing machine at predefined crosshead speeds of 0.33 and 3.33 mm/s. For the high-speed tests, an Instron IST Hydropuls tensile testing machine has been used, which is capable of reaching speeds up to 20mps. With this machine, tests have been performed at nominal crosshead speeds of 0.1, 0.33, 0.5, 3.0 and 10.0 m/s. Both machines record the loading force and displacement of the crosshead. No additional strain measurement has been performed. This is also not strictly necessary for the numerical approach in Section 4.
For testing at high speeds, it is common to install a lost-motion device to allow acceleration of the crosshead up to its predefined velocity. However, for the PVB samples, the weight of the lost motion device already poses a high load by which it begins to extend before any measurement can take place. An alternative solution is found in positioning the machine clamps a mere 37 mm apart prior to the test, as opposed to the 87 mm distance between the checkered areas in Fig. 4. In that position, the flexible interlayer specimen is curled up and experiences no force until it is straightened by a 50 mm downward displacement of the crosshead.
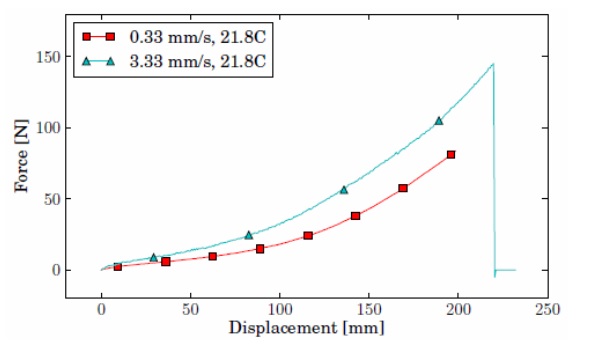
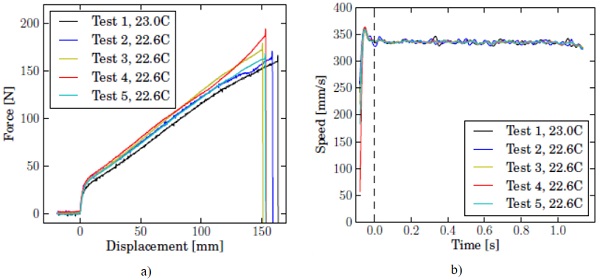
The force-displacement measurements for the low-speed tensile tests are given in Fig. 5. For the high-speed tests, five specimens were used at each speed. In Fig. 6, the results are shown for the specimens that have been tested at 333 mm/s. The time and displacement are set to zero on the moment that the specimen is straightened and begins to extend. For 100, 333 and 500 mm/s, the crosshead has at this point reached its nominal speed, which remains approximately constant thereafter. The force-displacement curves for all high-speed tests approach a bilinear behaviour, even more clearly than for tests of the same PVB product by Morison (2007) and Hooper et al. (2012). For one specimen in Fig. 6, that was tested at a slightly higher temperature, the measured forces are a little, yet noticeably, smaller than for the others. This again demonstrates the material's sensitivity to temperature in the transition zone between its glassy and rubbery state.
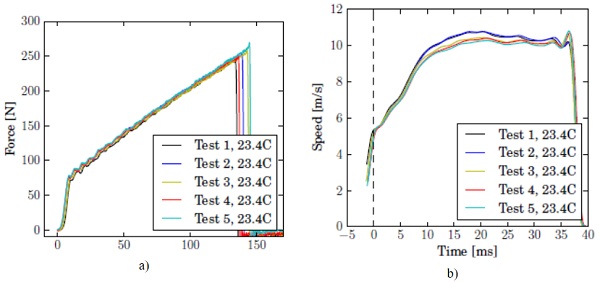
Similar curves are shown in Fig. 7 for the highest testing speed, 10 m/s. It is seen that the crosshead has not accelerated to its nominal velocity yet when the specimen starts to extend. Neither does the crosshead speed remain constant for the short duration in which the specimen is strained and tears. This should be taken into account when numerically simulating the tensile test.
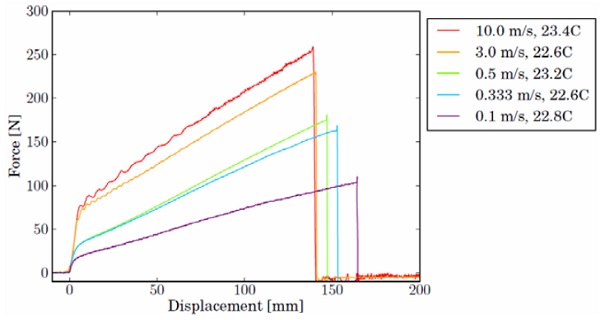
The median of force-displacement responses at every testing speed is shown in Fig. 8. The results of the tensile tests are well reproducible; force vs. displacement curves for samples tested at the same speed and temperature are as good as coincident. As expected, the material acts stiffer with higher rate of deformation. Another trend can be observed for the extension at failure, which decreases with the testing speed.
4. A hyper-viscoelastic material model for PVB
The small strain behaviour of the Saflex® R-series PVB used has been characterised by D'haene and Savineau (2007) and described by a Prony series representation and a time-temperature shift function. Several approaches exist to expand this model for large deformation. A choice can be made, based on the following observations:
- At normal operation temperatures, the PVB interlayer shows no permanent deformation. This has been reported in literature and was observed for all experiments in Sec. 3.
- The force vs. displacement curves on Fig. 8 show the same general shape and appear to be scalable for different testing speeds.
- No experimental data is available for the unloading at finite strains.
As such, it would not be required to use the powerful, but more complex, viscoplastic parallel network models, nor could such model be properly validated by lack of data on the biaxial and hysteretic behaviour of the material. The latter is not indispensable because, during an impact, the loading of the material is far more important than the unloading. As the tensile tests show similar response at different speeds, a hyperelastic strain energy potential to characterise the instantaneous material behaviour could be coupled with the viscoelastic model. Of course, the small-strain modulus for hyperelasticity should be equal to the instantaneous shear modulus of D'haene and Savineau's viscoelastic model, i.e. G0 = 146.12 MPa.
First, a suitable strain energy density function is sought to properly represent the instantaneous material behaviour. Subsequently, the material constants for this strain energy potential can be found by iterative simulation of the uniaxial tensile test at one testing speed. The found material model is further evaluated for the tensile tests at the other tested rates.
4.1.Choice of strain energy density function
The strain energy density function that describes the elastic deformation of a nearly incompressible, rubber-like material should be insensitive to the coordinate system used; it is an invariant of the deformation. As such, the strain energy density function can be described in function of the three invariants of the green deformation tensor C: W(J1, J2, J3), where:
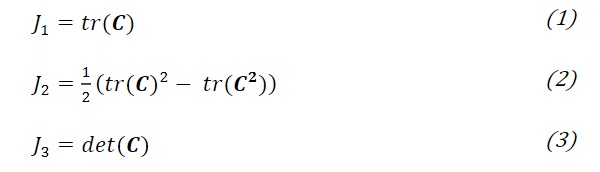
The third invariant is related to the volume change: J3 = (V/V0)². If the material can be idealised as incompressible, J3 is no longer a variable.
A common expression for the strain energy potential function is the polynomial formulation:

In his seminal paper, Yeoh (1990) examined the best suiting formulation for a strain energy density function when only uniaxial test data is available. Based on his observations for filled rubbers, he noted that for small strains δW/δJ1 and δW/δJ2 vary considerably with J1 and J2, but for larger strains δW/δJ1 tends to become relatively much larger than δW/δJ2 and independent of J2. Moreover, a simple relation seems to exist between stress-strain data obtained in uniaxial tension, uniaxial compression and simple shear. The stress terms plotted against the invariant (J1-3) give a single curve for data in these three deformation modes. Therefore, Yeoh proposed a strain energy density function in reduced polynomial form of third order or higher. Such function has a varying shear modulus, as opposed to the Neo-Hooke and Mooney-Rivlin functions, and can describe the rise of the modulus at high strains due to limiting chain extensibility.
Thus, a reduced polynomial function of at least third order will be used to approximate the strain energy density Wexp(J1-3), as calculated from the experimental data. For the approximating function, μ0 is the shear modulus at infinitesimal strain. In combination with viscoelasticity, this value is known for D'haene and Savineau's material model. In the present example, the small-strain shear stiffness in Fig. 2, μ0 = 403.11 MPa, is used as a direct input. The coefficients for the higher order terms are found by use of the curve fitting module in SciPy. It should be kept in mind that the fitted function should most accurately approximate the experimental values for small strains. Considering that the first invariant, J1, changes very quickly with the strain in this range, the fitted function should foremost capture the initial bend in Fig. 9.
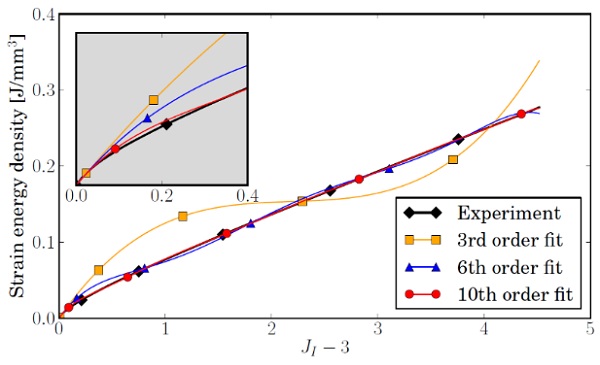
In Fig. 9, the resulting fitted curves are shown for reduced polynomial strain energy potentials of 3rd order (Yeoh's function), 6th order (the maximum order for the built-in hyperelastic model in ABAQUS) and 10th order. It is notable that the 3rd order fit shows large oscillations and is not monotonously ascending. The 6th order approximation does not capture the small strain behaviour accurately. This is only the case for a polynomial function of 10th order and higher. A hyperelastic law of that order is not available as built-in material model in ABAQUS, but can be implemented through theVUANISOHYPER_INV subroutine, which allows for combination with viscoelasticity.
Different formulations for the strain energy potential may be considered. Several options have been tried and evaluated in the scope of our work (Pelfrene, 2016b). Alternatives to the polynomial form were eventually not used because of numerical stability issues, which stem from high gradients in the first or second derivative of the considered (exponential) formulations.
4.2.Inverse modelling of the uniaxial tensile test
The method described in the previous section is very similar to the ‘Evaluate’ step in ABAQUS to find material constants for a hyperelastic strain energy density function (SIMULIA, 2016). However, this method can only be considered as an estimation because it is not entirely consistent with the theory: the strain energy density is calculated from the nominal stresses and strains, and the deformation tensor invariant is formulated for idealised uniaxial tension and calculated from an averaged strain rather than a locally measured one. To find the material constants that better represent the PVB, the uniaxial tensile experiment can be simulated and its material properties iteratively adjusted until a satisfying match with the force-displacement measurement is found.
Direct simulation of the PVB interlayer allows for the use of a constitutive model that combines hyperelasticity with viscoelasticity. The latter is known and implemented as D'haene and Savineau's model. Consequently, only a hyperelastic law for the instantaneous behaviour should be found. In theory, curve fitting at every testing speed should yield the same strain energy potential. In practice, a best fit is obtained only for the testing speed at which an optimised solution is created; for other strain rates, the result can be expected to deviate from the actual material behaviour.
The steps taken in the iterative procedure are given schematically by the diagram in Fig. 10.
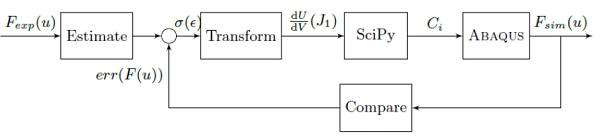
Estimate: An initial estimation for the stress-strain behaviour is made by deriving the nominal stress and nominal strain directly from the experimentally measured force and displacement. Because hyperelasticity is coupled with a generalised Maxwell model, the nominal stress is scaled such that the small-strain shear modulus equals the instantaneous shear modulus for D'haene and Savineau's viscoelastic model: μ0 = G0 = 146.12 MPa.
Transform: The strain energy density and the first invariant, J1, of the deformation tensor are calculated. It has been remarked that a polynomial strain energy potential is only valid for the range of strains to which it has been fitted. In order to avoid instability of the numerical simulation in which locally higher strains may be reached, an extension is made by following the trend of the estimated strain energy density at high elongations. A 3rd order polynomial function is fitted to the last quarter of data points. Extra data points are created for higher values of the first invariant, up to J1 = 12.0 which corresponds to a nominal strain of 280%.
SciPy: The curve fitting module in SciPy is used to find matching material constants Ci for an N-th order polynomial strain energy density function as described by:

ABAQUS: The material constants for the instantaneous behaviour are used in a finite element model of the uniaxial tensile test.
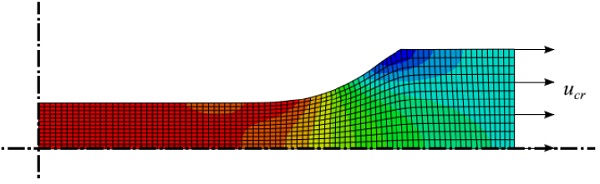
The numerical model consists of a 2D plane stress representation of a quarter of the PVB specimen, as shown in Fig. 11. The material clamped between the machine grips is not modelled (i.e. the checkered area in Fig. 4). The displacement is imposed on the edge nodes of the sample. In perfect clamping, these nodes are not allowed any lateral movement. However, in reality, the PVB does give way, being separated from direct contact with the rigid grips by a layer of glue and strips of cardboard. In the numerical model, the choice is made to allow free lateral movement of the edge nodes at the clamps. The displacement they are imposed in longitudinal direction is not at constant, nominal velocity, but is interpolated between the crosshead displacements recorded during the experiment, where t = 0 is the instant at which the PVB sample is straightened.
The constitutive model for the PVB consists of the combination of a reduced polynomial strain energy potential (implemented through the VUANISOHYPER_INV subroutine for an order higher than 6th) with a Prony series formulation of viscoelastic behaviour (D'haene and Savineau (2007) model). The time-temperature shift factor is taken into account for all simulations.
The explicit solver is used because equilibrium is not always reached for the higher strains when using the rather complex material model with the implicit solver. Also, the material model will be primarily used in impact simulations, which commonly make use of the explicit solver. Mass scaling can be used to increase the stable time increment. This is not done for the two highest testing speeds, 3.0 and 10.0 m/s, where dynamic effects could be expected.
Upon completion of the analysis, output is written for: the reaction force at the boundaries, the longitudinal (true) stress, local strain (both nominal and logarithmic) and strain rate in the middle section of the specimen. Because of mass scaling in the simulation, a check is also made for the kinetic energy and the artificial dissipations.
Compare: The force-displacement curves of the experiment and the simulation are compared. Error factors are calculated for the forces of the simulated result as in Eq. 6.
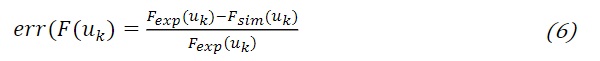
The error factors are used to adjust the estimated stress-strain behaviour of the present iteration by simply scaling the corresponding stress value. The new estimation is fed back into the loop. This is repeated until a satisfying match with the measured force-displacement is achieved.
The system of Fig. 10 is implemented as a single Python script, which can be run in ABAQUS/CAE. The required input consists of the experimentally recorded time, displacement and measured forces. 5 to 10 iterations are sufficient to find an acceptable solution for the material model. This purpose-built method is highly efficient compared to optimisation schemes in specialised software such as iSight which fill in material constants directly in the ABAQUS model and easily require over 100 iterations.
4.3.Resulting material model for Saflex PVB
Before coming to a material model by which the experimental results could be reproduced numerically, two deviations from the original idea had to be taken:
- In SciPy, the first-order constant can be set as C1 = μ0/2 = G0/2, such that the small-strain modulus equals that of D'haene and Savineau's viscoelastic model. However, it is seen after curve fitting that this creates a high overshoot of the stress at the turning point in the stress-strain curve. Simulations quickly become unstable when strains past this point are reached. Therefore, the constant C1 is left as a parameter in the curve fitting procedure. This alleviates the stability issues and enables a better matching fit with the experimental curve, but the solution is no longer truly consistent with D'haene and Savineau's viscoelastic model for infinitesimal strains.
- In Section 4.1, a 10th order polynomial was proposed to provide a good fit with the estimate for the strain energy density. When simulating the tensile test in ABAQUS, it appears that there is a significant ripple on the resulting force and in local stress, which eventually leads to excessive element distortion. An example of such force-displacement response is shown in Fig. 12. Thus, the 10th-order polynomial fit is still not sufficiently smooth. A 20th-order fit will further be used.
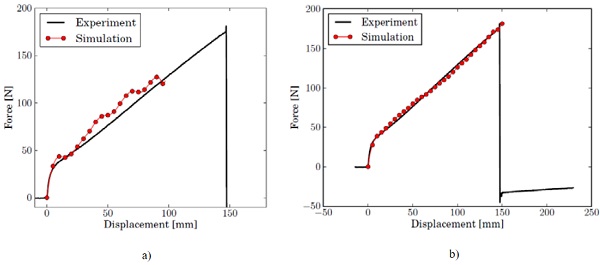
With this approach, hyperelastic material constants can be found at every testing speed that provide a good fit with the experimental force-displacement response. The strain rates of most interest in an impact situation are in the order of 0.1 to 10 s-1. These strain rates are found for the testing speeds of 100 to 500 mm/s. In a first approach, the test at 500 mm/s is used to calibrate the material model. A decent fit is obtained after 8 iterations. The resulting forces are shown in Fig. 12b in comparison with the experimental measurement at 500 mm/s and 23.2°C.
The same material model resulting from the fit at 500 mm/s is used to simulate the other testing speeds. The force vs. displacement responses are shown together with the experimental measurements in Fig. 13. While the measured forces can be reproduced rather well for testing speeds 0.1 and 0.33 m/s, the results for the highest speeds do not show good correspondence. Thus, the assumption that the material stiffness can be scaled by a linear viscoelasticity model also at large strains is not valid for the entire range of deformation rates. A more generally valid material description may be found by introducing non-linearity for the dashpot elements in the generalised Maxwell model. Calibration of such material model does require more extensive test data; more specifically for cyclic loading at a higher strain level, as described by Bergström (2015).
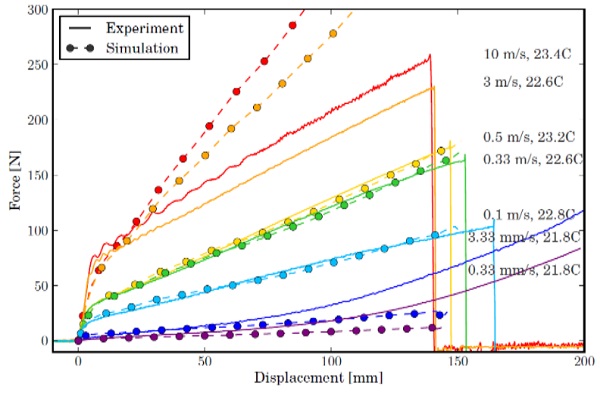
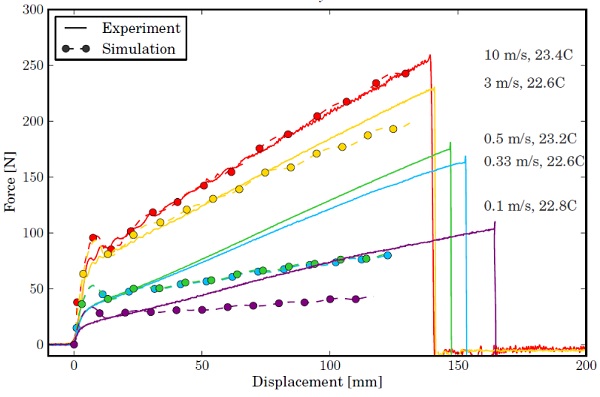
An additional calibration of the material model is made for the highest testing speed, 10 m/s. The resulting forces for all dynamic tests are shown in Fig. 14. While achieving more or less acceptable correspondence for the 3.0 m/s test, the material constants should not be used for simulation at lower deformation rates. Remarkably, some overshoot of the force is seen around the kink in each force-displacement curve. This could not be resolved with the polynomial fit, but also does not lead to instability of the simulation.
5.Conclusions
PVB interlayer is by far the most common interlayer for laminated safety glass. It is an amourphous thermoplast that adheres to glass through hydrogen bonding. Mechanically, PVB interlayer is nearly incompressible, can reach very high strains before tearing and does not show permanent deformation. It is also characterised by very high sensitivity towards temperature and deformation rate.
While showing rather complex mechanical behaviour, several simplifications can be made in constitutive modelling, depending on the considered load case. The small-strain behaviour of PVB is well captured by linear viscoelasticity, for which the time-temperature superposition principle applies. When the glass breaks under impact or blast, the PVB can locally reach large strains. In that case, the material can be modelled by rate-dependent hyperelasticity, a combination of hyper- and viscoelasticity or the more general viscoplasticity. The first is an engineering solution which allows to calculate forces during the loading stage, but ignores much of the material's physical nature. The latter allows to model any type of polymer behaviour, but requires a great amount of test data for different deformation modes. The combination of a hyperelastic strain energy potential with Prony series for viscoelastic behaviour is used here, under the assumption that the stress-strain behaviour at finite strains can be scaled for different deformation rates by the same generalised Maxwell model as for the small strains.
Uniaxial tensile tests of Saflex® R-series interlayer at low to high pulling speeds provide experimental data to calibrate the material model. Remarkably, the dynamic tests all show a similar, nominal stress-strain reponse which approaches a bilinear relation. The tearing strain slightly decreases with the deformation rate.
A strain energy potential that can capture the instantaneous stress-strain curve of the PVB is to be found. As shown by Yeoh (1990), the strain energy density depends foremost on the first invariant of the Green deformation tensor and the strain energy potential may best be written as a function of this variable only. A polynomial fit is a common approach, but a high order is needed to provide a good match with the quick changes in stiffness that the material shows at small strains. An even higher order is needed to enhance the smoothness of the solution in order to avoid instability in numerical analysis.
An iterative simulation procedure has been developed to find the material constants for which a good fit with the experimental results can be established. However, a proper match can only be found when the small-strain modulus of the 20th order polynomial function is allowed to deviate from the instantaneous modulus of D'haene's linear viscoelastic model, to which it is coupled. Also, it appears that the simulated behaviour at large strains only provides a good fit with the test data for a limited range of deformation rates. This indicates that it would be more correct to include rate-dependency of the viscous component in the material behaviour.
Finally, a PVB material model is proposed for use in numerical analysis of dynamic events with glass breakage. This material model is calibrated for a mid-range of strain rates, i.e. 0.1 to 10 s-1.
Acknowledgements
The authors gratefully acknowledge Eastman Chemical for providing the PVB test samples. Thesis student Renaat Muylle is acknowledged for his assistance in the test campaign. This work has been funded by the UGent BOF (Bijzonder Onderzoeksfonds) under grant number B/12091/01.
References
Amadio C., Bedon C.: Dynamic Response of Cable-Supported Façades Subjected to High-Level Air Blast Loads: Numerical Simulations and Mitigation Techniques. Modelling and Simulation in Engineering, 2012:13 (2012)
Behr R., Minor J.E., Linden M.P.: Load duration and interlayer thickness effects on laminated glass. Journal of Structural Engineering, 112(6):1441-1453 (1986)
Bennison S.J., Jagota A.: Fracture of Glass/Poly-vinyl butyral (Butacite) Laminates in Biaxial Flexure. Journal of the American Ceramics Society, 82(7):1761-1770 (1999)
Bergström J.: Mechanics of Solid Polymers. Plastics Design Library. Elsevier Inc. (2015)
Dassault Systèmes Simulia. Abaqus 2016 Analysis User's Manual (2016)
D'haene P., Savineau G.. Mechanical properties of laminated safety glass - FEM study. In Glass Performance Days, pages 594-598, (2007)
Ferry J.D.: Viscoelastic Properties of Polymers. John Wiley and Sons, USA (1980)
Hooper P.A.: The mechanical behaviour of poly(vinyl butyral) at different strain magnitudes and strain rates. Journal of Materials Science, 47:3564-3576 (2012)
Iwasaki R.: Experimental Study on the interface fracture toughness of PVB/glass at high strain rates. International Journal of Impact Engineering, 12(3):293-298 (2011)
Juang Y.-J., James Lee L., Koelling K.W.: Rheological analysis of polyvinyl butyral near the glass transition temperature. Polymer Engineering and Science, 41(2):275-292 (2001)
Keller U., H. Mortelmans H.: Adhesion in laminated glass; what makes it work? In: Glass Performance Days, p.353-356 (1999)
Kolling S., Du Bois P.A., Benson D.J.: A tabulated formulation of hyperelasticity with rate effects and damage. Computational Mechanics, 40:885-899 (2007)
Kuntsche J.: Mechanisches Verhalten von Verbundglas unter zeitabhängiger Belastung und Explosionsbeanspruchung. PhD thesis, Technische Universität Darmstadt (2015)
Kuraray Europe GmbH: Technical manual: the processing of Trosifol® PVB, 6th Edition (2012)
Larcher M., Solomos G., Casadei S., Gebbeken N.: Experimental and numerical investigations of laminated glass subjected to blast loading. International Journal of Impact Engineering, 39:42-50 (2012)
Morison C., Zobec M., Frenceschet A.: The measurement of PVB properties at high strain rates, and their application in the design of laminated glass under bomb blast. In: International Symposium on the Interaction of the Effects of Munitions with Structures (2007)
Pelfrene J., Kuntsche J., Van Dam S., Van Paepegem W., and Schneider J.: Critical assessment of the post-breakage performance of blast loaded laminated glazing: experiments and simulations. International Journal of Impact Engineering, 88:61-71 (2016a)
Pelfrene J.: Numerical analysis of the Post-Fracture Response of Laminated Glass under Impact and Blast Loading. PhD thesis, Ghent University (2016b)
Schneider J., Kolling S., Kuntsche J., Moennich S.: Tensile properties of different polymer interlayers under high strain rates. In: Engineered Transparancy, International Conference at Glasstec, Duesseldorf, Germany, p. 427-437 (2012)
Sun D.-Z., Andrieux F., Ockewitz A., Klamser H., Hogenmuller J.: Modelling of the failure behaviour of windscreens and component tests. In: 5th European LS-DYNA Users Conference (2005)
Timmel M.: A finite element model for impact simulation with glass. International Journal of Impact Engineering, 34:1465-1478 (2007)
Ungureanu V.: Laminated glass and interlayers. European Erasmus Mundus Master Course - Sustainable constructions under natural hazards and catastrophic events (2011)
Vallabhan C.V.G., Minor J.E., Nagalla S.R.: Stress in layered glass units and monolithic glass plates. Journal of Structural Engineering, 113(1):36-43 (1987)
Vallabhan C.V.G., Das Y.C., Ramasamudra M.: Properties of PVB interlayer used in laminated glass. Journal of Materials in Civil Engineering, 4(1):71-76 (1992)
Van Dam S.: Experimental analysis of the Post-Fracture Response of Laminated Glass under Impact and Blast Loading. PhD thesis, Ghent University (2017)
Yeoh O.H.: Characterization of elastic properties of carbon-black-filled rubber vulcanizates. Rubber Chemistry and Technology, 63:793-805 (1990)