Author: Miriam Schuster
Source: Glass Structures & Engineering | https://doi.org/10.1007/s40940-022-00185-x
Abstract
The temperature dependent linear viscoelastic material behaviour of the most commonly used interlayer PVB is typically determined by means of Dynamic-Mechanical-Thermal-Analysis (DMTA). By horizontally shifting the isothermal modulus curves, a mastercurve is created at a certain reference temperature, which can then be mathematically approximated with a Prony series. A time–temperature superposition principle can be derived from the shift factors. In contrast to PVB, EVA and ionomer (or ionoplastic) interlayers have semi-crystalline structures that melt when the melting temperature is reached and form again when the sample is cooled below the crystallization temperature.
The exact structure and number of crystallites depend e.g. on the cooling rate and the physical age (or thermal prehistory) of the sample. These factors must be taken into account in the experimental determination of the material parameters with DMTA. Using the example of SentryGlas®, this article shows that the stiffness of semi-crystalline interlayers is affected by the crystallinity. Mastercurves from DMTA with different temperature programs are created. The degrees of crystallization for the different temperature programs are determined with Differential Scanning Calorimetry (DSC). A time–temperature superposition principle, which applies to the purely amorphous material, and a time-crystallinity superposition principle are derived, which enable the determination of the material parameters for different temperatures and degrees of crystallization.
Introduction
Due to its high transparency, more and more structural building elements are made of glass. In order to fulfil some safety relevant factors, laminated safety glass, which consists of at least two glass panes that are connected via a polymeric interlayer, is used. In case of glass fracture, laminated safety glass is able to retain the glass fragments and to ensure a residual load bearing capacity. If intact laminated safety glass is loaded by bending stress, the interlayer causes a shear coupling between the two glass panes. The amount of the shear coupling affects the resulting maximum glass stress. Hence, knowledge of the mechanical behaviour of the interlayer is of great interest for an economical design. The mechanical behaviour of polymers in intact laminated safety glass is especially dependent on temperature and time. More information on the shear coupling effect in laminated safety glass and on the temperature- and time-dependent material behaviour of interlayers can e.g. be found in (Kuntsche et al. 2019).
The most common interlayer is polyvinyl butyral based (PVB). The temperature dependent linear viscoelastic material behaviour of this interlayer is typically determined by means of Dynamic-Mechanical-Thermal-Analysis (DMTA). The so measured isothermal frequency-dependent stiffness curves are then horizontally shifted, so that a continuous curve, the so called mastercurve, is generated for a specific reference temperature. Subsequently, the mastercurve can mathematically be approximated with a linear viscoelastic material model, e.g. the generalized Maxwell model / Prony series. The temperature-dependence is depicted by deriving a time-temperature-superposition principle (TTSP) from the temperature dependent shift factors, that were necessary for the mastercurve creation. The most common TTSP models are the William-Landel-Ferry model WLF (Williams et al. 1955), the Arrhenius equation (Schwarzl 2013) or polynomial functions (Z-70.3-256 2020). More information on the characterization of PVB interlayers can e.g. be found in (Kraus et al. 2017).
However, the described method is only applicable for thermorheologically simple material behaviour. A material behaves thermorheologically simple, if all the relaxation times of a relaxation test have the same temperature dependency, or graphically spoken, the relaxation curves have the exact same shape, regardless of the temperature at which the test have been conducted (ISO 18437-6 2017; Schwarzl 2013).
SentryGlas®, which was developed for high structural performance, and crosslinked ethylene vinylacetate, which is commonly used in solar applications, are two interlayer types, that contrary to PVB possess crystalline regions (Domininghaus 2013; Schuster et al. 2018; Trösch 2015; Wakabayashi and Register 2006). Hence thermorheologically complex material behaviour is expected (ISO 18437-6 2017). In this paper it will be shown that the crystallinity affects the stiffness behaviour. Furthermore, a DMTA test procedure and evaluation method, consisting of two different shift factors, namely the temperature-dependent shift factor and the crystallinity-dependent shift factor, will be presented. The test results enable the determination of the material parameters for different temperatures and degrees of crystallization. The results have been produced in the context of the dissertation (Schuster 2022).
Mechanical behaviour of polymers with semi-crystalline structures
Definition crystallinity
The degree of crystallization or crystallinity of semi-crystalline thermoplastics is usually based on a two-phase model, with perfect crystallites and distinct amorphous areas. Defects and transition areas between the crystalline and amorphous phases are neglected, e.g. (Schwarzl 2013).
According to Ehrenstein (2011), crystallinities of 10–80% are technically realizable. A higher crystallinity implies a higher stiffness, a higher strength, a higher heat distortion temperature, a higher density and higher processing temperatures. The light transmission and gas permeability however decrease with increasing crystallinity (Kaiser 2011).
The crystallinity χ of a semi-crystalline sample can be determined with different ways. In this paper, it is deduced from Differential Calorimetry tests, see further Sect. 3.2.
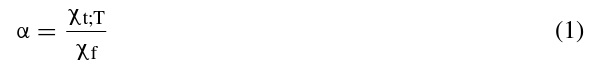
The relative crystallinity α corresponds to the ratio between the crystallinity at a certain time or at a certain temperature χt;T and the crystallinity at the end of the crystallization χf:
Melting and formation of crystallites
When a solid, semi-crystalline polymer is heated, its components (ions, atoms, molecules) are excited to vibrate by the applied heat. If the vibrations are large enough, the strong intermolecular forces in the ordered, crystalline domains are overcome, the crystalline domains melt and arrange in an amorphous way (Lechner et al. 2014). The amount of heat required for this thermal transformation is called melting enthalpy. For perfect, infinite crystals without impurities, this thermal transformation occurs at the so-called thermodynamic equilibrium melting temperature. However, in semi-crystalline polymers, crystallites of different sizes are present, with the smaller imperfect ones melting at lower temperatures than the larger more perfect crystallites, so that the melting process extends over a range of temperatures and is characterized by an average melting temperature Tm (Elias 2009).
If the molten, semi-crystalline polymer is cooled down to a temperature Tc, which is below the melting temperature but above the glass transition temperature, the crystallization process occurs. This consists of several steps: First, nucleation takes place. The molecular movements of the molecular chains in the melt cause individual molecular chains or molecular chain segments to form small crystal-like structures, the embryos. If the embryos exceed a critical size, they grow into nuclei. The number of formed nuclei is dependent on Tc and the crystallization time t. If Tc is only slightly below the melting temperature, only a few nuclei can be formed in a certain time t, which equals a low nucleation rate, and if Tc is much lower than the melting temperature, many nuclei can be formed in the same time t, which corresponds to a high nucleation rate (Lechner et al. 2014). In the second step, nucleus growth occurs, which mainly consists of further folding of polymer chain segments around the nucleus.
For this purpose, the molecules must be transported to the interface via diffusion processes and incorporated there. The rate of transport is higher at higher Tc (Bonnet 2016). Both, nucleation and growth are dependent on Tc and t, hence the whole crystallization is a kinetically motivated process, wherein the crystallization rate Gc is the product of the nucleation rate and the growth rate. The lower temperature boundary for crystallization is the glass transition temperature. Below Tg no molecular movement takes place (Bonnet 2016). Very high cooling rates can suppress or minimize the crystallization process. However, subsequent annealing at temperatures between Tg and Tm lead to physical aging phenomena as e.g. cold crystallization or crystal perfection. Cold crystallization describes the process, in which the initially insufficiently crystallized regions increase their crystallinity due to slow reorganisation effects and hence leads to an increase in the degree of crystallization (Lechner et al. 2014). Crystal perfection occurs when small crystallites melt, while larger ones grow. This shifts the melting point towards higher temperatures (Hammer 2010).
Time-crystallinity-superposition and time–temperature-crystallinity superposition
According to ISO 18437-6 (2017), polymers with crystalline phases behave thermorheologically complex. Hence, the TTSP and whole mastercurving process, which is state of the art for PVB interlayers, are not immediately transferrable. This can also be seen as an example in Fig. 8, in which non-congruent mastercurves for 20 °C resulted from two different DMTA-TFS (TFS = temperature-frequency sweep).
Lamberti et al. (2007) investigated the hardening behaviour (= increase in viscosity) in dependency of the relative crystallinity of two different iPP homopolymers. Therefore, isothermal crystallization experiments were conducted in Differential Scanning Calorimetry tests (DSC) and rotational rheometer tests were performed in order to measure the dynamic viscosity. It was shown, that there is a relation between the crystallinity and the hardening function and that the value of the hardening function is only dependent on the total amount of crystallinity, regardless how the crystallinity was produced (small amount of large crystallites, or large amount of small crystallites). Lamberti et al. (2007) introduced the time-crystallinity-superposition principle TCSP. Analogously to the temperature dependent shift factors in the time-temperature-superposition principle, the crystallinity-dependent shift factors affect the frequency / resp. time. Mastercurves for the complex viscosity |η*| were created using the TCSP for a reference relative crystallinity of αref = 0 and the shift factors were approximated with:

b1 and b2 are fitting parameters. In the following, this equation is referred to as Lamberti-Peters-Titomanlio (LPT).
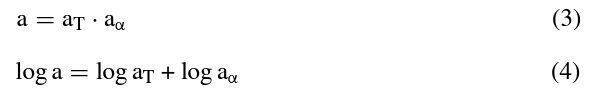
Carotenuto et al. (2019a, 2019b) and Minale et al. (2019) combined the TTSP and TCSP to create a time–temperature-crystallinity-superposition TTCSP (Eqs. 3 and 4). They have recently successfully applied this time–temperature-crystallinity-superposition principle on EVA-samples. Based on rheological temperature-frequency sweeps (where the sample was reheated before each new temperature level, thus zeroing the physical age), they generated storage modulus G’, loss modulus G’’ and complex viscosity mastercurves |η*|.
By performing temperature sweeps with a cooling and heating cycle and time sweeps at different temperatures, they estimated the degree of crystallinity for each data point in the Dynamic-Mechanical-Thermal-Analysis (DMTA). In order to generate mastercurves, first, the temperature dependent shift factor aT was determined by only considering the data points with relative crystallinities close to 0 or 1 in the shifting procedure. In the second step the crystallinity-dependent shift factor aα was determined, by minimizing the horizontal distance between data having similar storage modulus values.
This paper also uses a TTSCP approach. However, the absolute crystallinities χ are used instead of the relative crystallinities α.
Experimental investigations
Investigated material
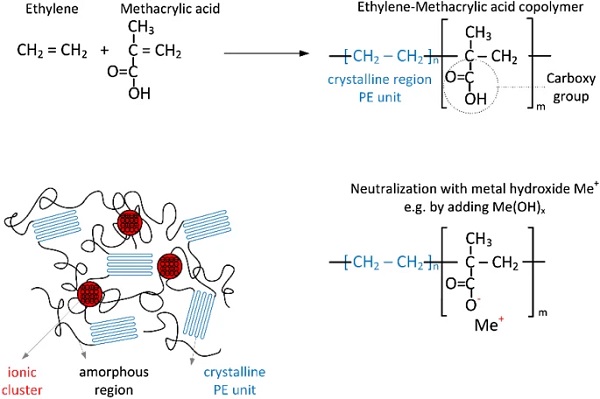
SentryGlas Xtra® (SG6000) from Kuraray is investigated in this paper. SentryGlas® is an ionomer, also sometimes called ionoplast. Ionomers or ionoplastics are copolymers that possess a relatively small number of ionized groups that are distributed along the polymer backbone (Wakabayashi and Register 2006). They are created in two steps: In a first step, the copolymer is created. In the case of SentryGlas®, this happens by the copolymerization of ethylene and organic methacrylic acid (MAA), resulting in carboxy groups on the macromolecules (Trösch 2015, Kuraray 2014). In the second step, neutralization or ionomerization with metal cations takes place (Wakabayashi and Register 2006). According to Kuraray (2014), the metal cation may be sodium, zinc or potassium. The degree of neutralization in SentryGlas® is unknown.
Moreover, no more detailed information is available on the exact process of neutralization. However, one possibly way would be to add metal hydroxides to the ethylene-methacrylic acid copolymer. As a result, the hydrogen is split off from the carboxy group to form water and the carboxyl groups become ionized. The negatively charged oxygen atom of the carboxy group and the remaining positively charged metal atoms of the metal hydroxide create an ionic pair, which results in the formation of a salt.
The energy difference between the nonpolar carbon chains and the polar functional groups, leads to an accumulation of the ion-rich zones, which act as thermo-reversible crosslinks (Gómez et al. 2019; Elias 2009). In these domains, the movement of the amorphous regions is restricted. In addition, polyethylene segments in the macromolecules form crystallites between the ion clusters and amorphous regions (Wakabayashi and Register 2006), which is why SentryGlas® is also referred to as modified polyethylene. The crystallinity of the investigated material (sample state “as received” from the manufacturer) was determined by the author to approx. 9.86% using X-ray diffraction at room-temperature and to approx. 9.5% using the first heating scan in Differential Scanning Calorimetry. The formation process and the molecular structure of SentryGlas® are presented in Fig. 1.
It should be noted, that the investigated interlayers have gone through the lamination process (with additional non-adherent films between the interlayer and the glass panes) before they were tested.
Differential Scanning Calorimetry (DSC)
General
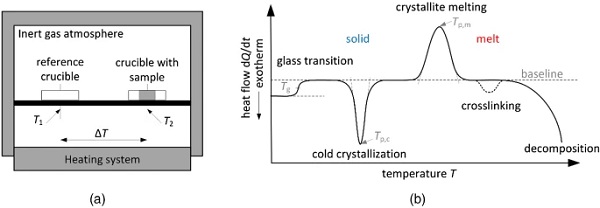
Crystallinity is studied in Differential Scanning Calorimetry (DSC) measurements. In DSC measurements, a crucible with sample is always subjected to a defined temperature program together with an empty reference crucible (Fig. 2a). Due to the difference in heat capacities of the two crucibles, a temperature difference arises from which the heat flow can be derived as a function of temperature or time. In the case of isobaric conditions, the heat flow Φ = dQ/dt corresponds to the enthalpy rate dH/dt. Both quantities are often normalized by the sample mass, resulting in the unit [J/g]. As shown in Fig. 2b, the shape of the DSC curve can be used to detect and investigate physical transformations, such as glass transitions, melting and crystallization processes, and chemical reactions, such as crosslinking (EN ISO 11357-1 2017; NETZSCH-Gerätebau GmbH 2021). In the following, the focus is on phenomena characteristic of polymers with semi-crystalline structures.
The measured heat flow or enthalpy behaves proportionally to the set temperature rate. High temperature rates lead to larger heat flow /enthalpy values and hence are advantageous to make small effects more visible. Small rates are preferred, however, to separate effects that are close to each other (EN ISO 11357-2 2014).
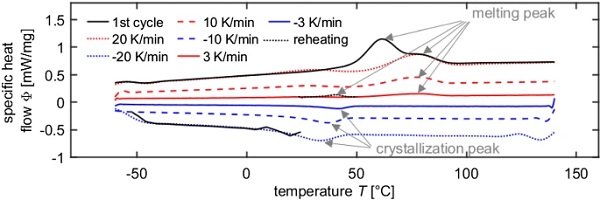
The melting of the crystallites can be recognized by an endothermic peak in the DSC heating curve (EN ISO 11357-3 2013). The melting peak is characterized by different temperatures: the peak temperature, the offset and onset temperatures determined at the intersections of the baseline and the tangent applied at the inflection point of the peak, and the temperatures at which the melting process starts and ends, which are defined as the temperatures at which the first deviations of the thermogram from the baseline occur. Since the melting process is thermodynamically controlled, the endothermic peak is not (or not much) influenced by the heating rate. The first heating curve of polymers often exhibits two melting peaks, one at lower temperatures and one at higher temperatures. In the following heating processes, however, only the high temperature melting peak is recognizable. The low temperature melting peak is the result of secondary crystallization caused by physical aging effects that occur in the temperature range between Tg and Tm. Hence, the shape of the first heating thermogram is very much dependent on the thermal prehistory of the sample. Only the subsequent heating processes after controlled cooling from the melt provide reproducible DSC curves that are independent of the thermal prehistory (EN ISO 11357-1 2017).
During the crystallization process, heat is released, which can be seen in the thermogram of the cooling process by an exothermic peak (EN ISO 11357-3 2013). Analogous to the melting peak, the crystallization peak is characterized by different temperatures, e.g. the peak temperature, the onset and offset temperatures and the temperatures at which the crystallization process starts and ends. Hereafter, the peak temperature is used as the crystallization temperature Tc. Since crystallization is controlled by kinetic processes, the shape and position of the exothermic peak is influenced by the cooling rate. Cold crystallization causes an exothermic peak in the heating curve, which is always located at temperatures below the melting peak temperature. It occurs when the sample had no time to crystallize in the previous cooling process. Since endothermic melting and exothermic crystallization processes take place simultaneously, crystal perfection from smaller to larger crystallites is difficult to detect with DSC (Hammer 2010).
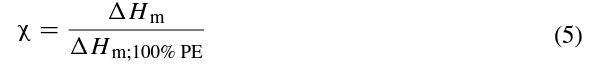
As shown in Eq. (5), the crystallinity is calculated by the ratio of the current melting enthalpy to the melting enthalpy of the fully crystallized material, (EN ISO 11357-5 2014; Schick 2009). The current melting enthalpy is obtained by evaluating the melting peak area. Since the crystallites in SentryGlas® are made of PE units, the theoretical melting enthalpy of the fully crystallized material corresponds to the theoretical melting enthalpy of perfect PE crystallites, which is assumed to be ΔHm;100%PE = 293 J/g (Schubnell 2001; Blaine 2002).
Performed tests
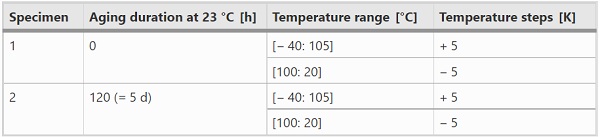
The DSC experiments were conducted in a DWDK Netzsch Type 214 Polyma DSC with Ø5 mm aluminum crucibles. In order to allow pressure equalization during the tests, the lids of the crucibles were pierced. The samples with masses between approx. 4–6 mg were cut from the interlayer foils stored dry at room temperature. After the samples have been placed in the crucibles so that they had good contact with the bottom of the crucible, the lids were cold-welded to the crucibles, the crucibles were weighed with a precision balance and placed in the DSC. The empty reference crucible (with cold-welded lid) was weighed as well and was placed in the DSC next to the crucible with sample. The tests summarized in Table 1 were carried out in a nitrogen atmosphere.
Table 1 Test matrix DSC tests - Full size table
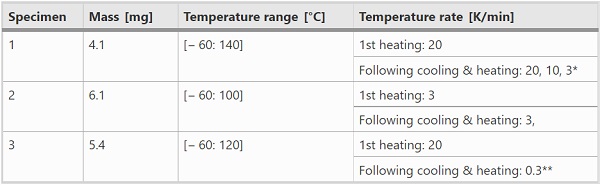
**The 0.3 K/min corresponds to the linearized temperature rate in the DMTA tests (see further Sect. 4.4)
Sample 1 was mainly used to investigate the temperature-rate dependent melting- and crystallization processes. Sample 2 was examined to gain insight into the influence of physical age at a given temperature rate (3 K/min) along with sample 1. Sample 3 was used to evaluate the degree of crystallization at a temperature rate equal to that in the DMTA measurements (here: 0.3 K/min).
In Table 1 it can be seen that the maximum temperatures vary with the samples. However, since all the indicated maximum temperatures exceed the melting temperature range, the exact values have no further importance for the results presented in this paper. In each test, minimum two cycles have been performed with the same temperature rate. In addition to the temperature rates given in Table 1, further temperature scans were run on sample 2 and sample 3 to ensure comparability with sample 1 and to check reliability of the measurements.
Dynamic-mechanical-thermal-analysis (DMTA)
General
The stiffness behaviour as a function of temperature and frequency or loading duration is investigated in Dynamic-Mechanical-Thermal-Analysis (DMTA). Here, the specimen is loaded by sinusoidal vibrations and the viscoelastic material response delayed by the phase shift 0° ≤ δ ≤ 90° is measured. The ratio of the stress amplitude to the strain amplitude gives the magnitude of the complex modulus |G*(ω)|. The complex modulus can be divided into an elastic component, called the storage modulus G'(ω) =|G*(ω)| cosδ, and a viscous component, called the loss modulus G''(ω) =|G*(ω)| sinδ. The ratio of loss modulus to storage modulus is called loss factor tanδ = G''/G'.
Different parameters can be varied in the DMTA. These include excitation amplitude, frequency, and temperature (NETZSCH-Gerätebau GmbH 2021; EN ISO 6721-11 2019). If the temperature is varied with a specific heating or cooling rate while keeping the amplitude and frequency constant, one speaks of temperature sweeps (DMTA-TS). DMTA-TS hence show the temperature-dependent stiffness behaviour at a certain frequency and can therefore also be used to determine transition temperatures (e.g. glass transition temperatures).
In order to determine the temperature-dependent linear viscoelastic material behaviour, temperature-frequency sweeps (DMTA-TFS) can be performed. DMTA-TFS involve measurements at several constant temperature levels with varying frequency and constant excitation amplitude. Accordingly, the result is many isothermal modulus-frequency curves that can be shifted to a so-called mastercurve and mathematically approximated by a linear viscoelastic material model, e.g. the Prony series. The shift factors required for mastercurve generation simultaneously provide a time-temperature-superposition principle.
Performed tests
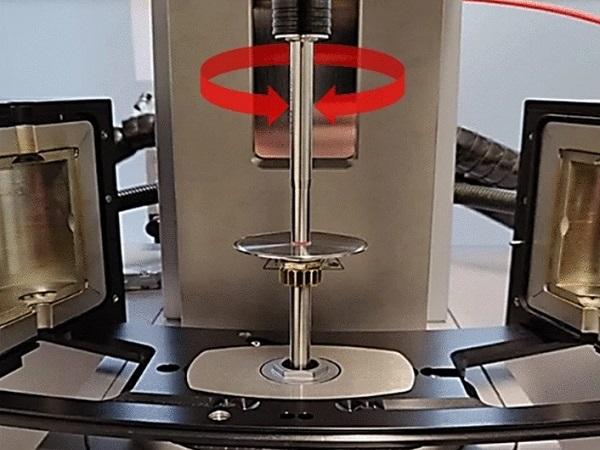
The DMTA tests were performed using an Anton Paar MCR 302 rheometer in plate-plate (PP) configuration (Fig. 3). The temperature was controlled by a convection oven (CTD 450) in combination with a nitrogen system. Circular specimens with a diameter of 8 mm and a nominal thickness of approx. 0.89 mm were tested. Different DMTA-TS were performed, see Table 2. The excitation amplitude was in the linear viscoelastic range (0.025%). The frequency was set to 1 Hz. Before the test start, the thermal prehistory has been deleted.
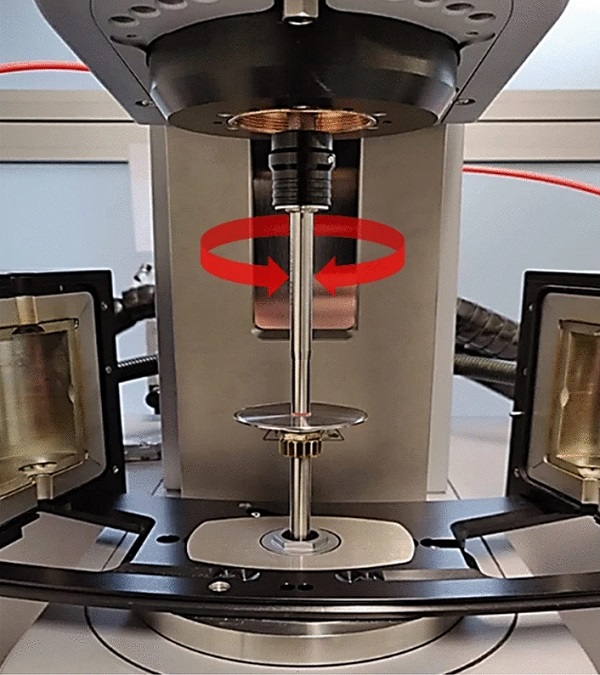
Table 2 Test matrix DMTA-TS - Full size table
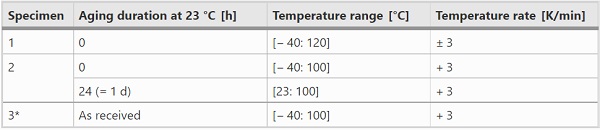
Sample 1 was tested in both heating and cooling mode to investigate the effect of the temperature direction on the stiffness behaviour and to identify a potential correlation to the crystallization behaviour measured in DSC at the same temperature rate. Sample 2 and 3 were tested in heating mode only. The aim was to study the influence of the physical age on the crystallinity.
The performed DMTA-TFS are summarized in Table 3. The excitation amplitude was in the linear viscoelastic range (0.025–0.04%). The frequency range was [0.1: 10] Hz. 25 measuring points were recorded, which were logarithmically equally distributed. The goal of these two experiments was to create mastercurves, as well as the determination of a TTSP (time–temperature superposition principle) and a TCSP (time-crystallinity superposition principle).
Table 3 Test matrix DMTA-TFS - Full size table
Again, the maximum temperatures in the DMTA-TS and DMTA-TFS do not have any impact on the results, since in all cases the melting temperature range is exceeded. The plausibility of the DMTA-TFS results was checked, among other things, by comparing the cooling curves. As expected, both yielded the same results, which is why in the following only one cooling data set (sample 2) is used.
Test results
This section focusses only on the results that are important for the determination of the linear viscoelastic material behaviour. Further results as for example the determination of the characteristic temperatures (glass transition temperature, crystallization temperature, melting temperatures), or the determination of the initial crystallinity can be found in (Schuster 2022; Schuster and Schneider 2022).
Parameters influencing the degree of crystallization
Figure 4 shows the thermograms for specimen 1. It can be noted that the first heating scan significantly differs from the following heating scans. Contrary to the following heating scans, the first scan shows two melting peaks. This is due to differences in the thermal prehistory (or physical aging, see further Fig. 7). Furthermore, the crystallization peak temperatures are always lower than the melting temperature peaks and the crystallization peak temperatures are more dependent on the applied cooling rate than the melting peak temperatures on the heating rate.
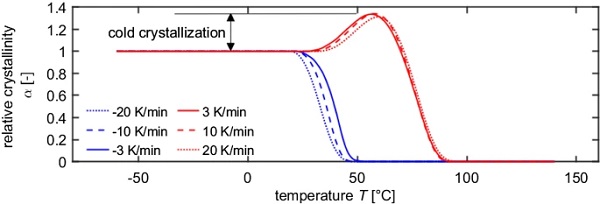
The DSC thermograms can be used to evaluate the relative crystallinities (Eq. (1) and (5)). Graphically spoken, the relative crystallinity corresponds to the evolution of the peak area. E.g. coming from the melt, the relative crystallinity is 0 until the crystallization peak starts and reaches 1 when the peak area has fully developed. In the following heating scan, the relative crystallinity first further increases due the cold crystallization and then decreases to 0 in the range of the melting peak (Fig. 5).
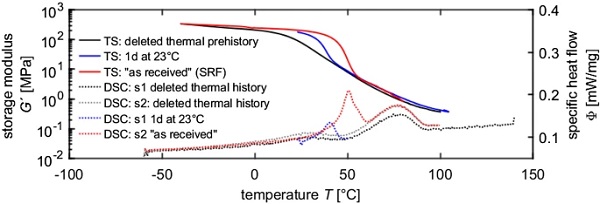
Besides the influence of different temperature directions and temperature rates, the influence of the physical age was investigated. Therefore specimens 1 and 2 from Table 1 were compared (Fig. 7). The deletion of the thermal prehistory leads to the disappearance of the low temperature melting peak. However, after a physical aging process of approx. 1 day at room temperature, it is notable that the low temperature peak is reforming. Compared to the first heating scan of specimen 1, the peak is smaller and occurs at a lower peak temperature.
Effect of the crystallinity on the stiffness behaviour
In order to investigate the influence of the crystallinity on the stiffness, the DSC and DMTA-TS data measured with the same temperature rate were compared (Fig. 6). Interestingly, a hysteresis is observed in the storage modulus curves, whereby the storage modulus in the heating curve is always above the one in the cooling curve. Comparing those results with the DSC results, it becomes clear, that the hysteresis only occurs in the range, where the relative crystallinities in the heating and cooling curves differ. The end of the hysteresis coincides with the end of the melting process. The beginning of the hysteresis coincides with the end of the crystallization peak. Furthermore, the strong increase in the storage modulus matches with the beginning of the crystallization peak.
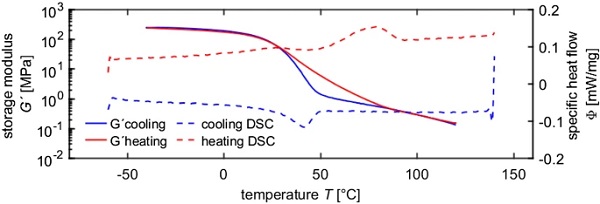
Similar it can be shown, that the low temperature melting peak, which occurs due to physical aging, coincides with the strong decrease in the storage modulus (Fig. 7).
This proofs that the crystallinity has a strong influence on the prevailing stiffness.
Creation of mastercurves
For all temperature programs, continuous mastercurves could be generated by purely horizontally shifting the isothermal curves. For PVB, the reference temperature of mastercurves is often chosen to be Tref = 20 °C. If this is also applied to SentryGlas® and the results of sample 1 and 2 are compared, it can be seen that a horizontal offset occurs (Fig. 8). If the reference temperature is chosen to be Tref = 95 °C, however, all mastercurves are congruent (Fig. 9). This can be explained by the fact that the different temperature programs lead to different prevailing crystallinities at 20 °C. Since 95 °C > Tm > Tc, the melting process in the heating modes is already completed, while the crystallization process in the cooling modes has not started yet. Hence, at 95 °C, for all three temperature programs (“Heat”, “Heat 5d at 23°C” and “Cool”), the relative crystallinity is 0.
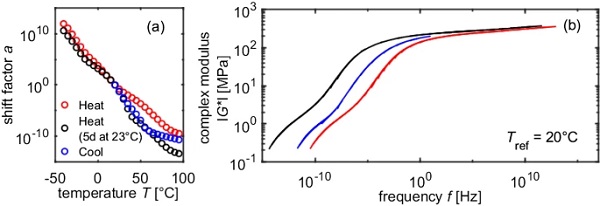
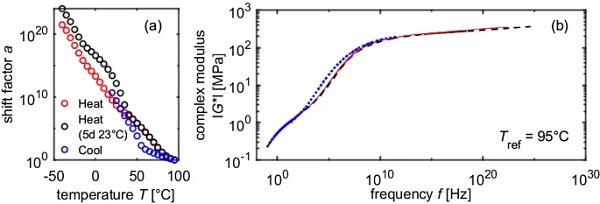
Although the mastercurves are identical, the displacement factors differ greatly. It is supposed, that the difference in the shift factors is caused by the different crystallinities and hence the horizontal shift factor is composed of a temperature dependent part and a crystallinity dependent part.
Decomposition of the horizontal shift factor
To decompose the total shift factor in a temperature dependent part and a crystallinity dependent part, the shift factors from the heating and cooling curve are compared by calculating the ratio of both shift factors (Fig. 10a and b). Additional DSC tests with the same temperature rate were performed (Table 1, sample 3) in order to determine the crystallinities that were prevailing during the DMTA tests (Fig. 10c). The temperature rate in the DMTA-TFS was determined here in a simplified way by approximating the actual step-shaped temperature-temperature curve by a straight line. The slope of this trend line was used as the linearized temperature rate. In the experiments presented here, this corresponded to approx. 0.3 K/min. The difference in the crystallinities is calculated (Fig. 10d).
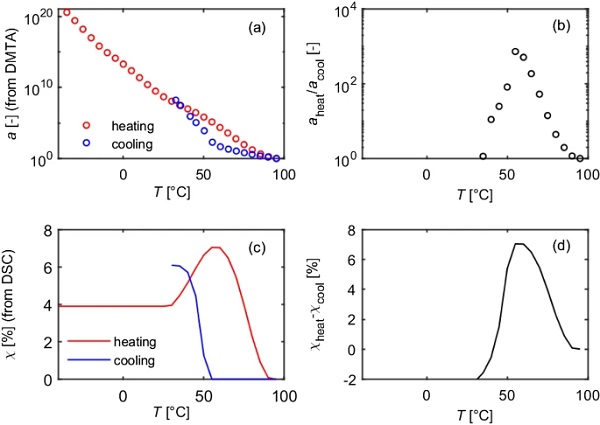
The crystallinity dependent shift factor is obtained by plotting the ratio of the shift factor in dependency of the difference in crystallinity and approximating the datapoints with the LPT power function (Eq. 2). Alternatively, an exponential function was used to fit the datapoints (Fig. 11a).
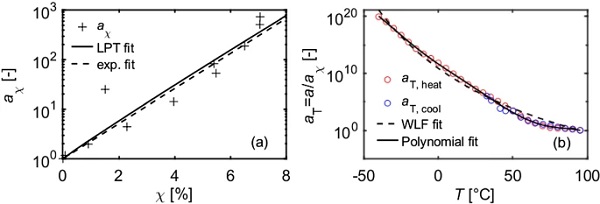
The solely temperature dependent shift factors hence is obtained by subtracting the crystallinity dependent shift factors from the total shift factor (eqs. 3 and 4). Those shift factors can then be approximated with common time-temperature-superposition principles, as e.g. the WLF, Arrhenius or polynomial functions (Fig. 11b).
The TTSP can now be used to shift the mastercurve or the Prony series, which is determined by mathematically approximating the mastercurve, to other T than Tref. This procedure is hence identical to the one that is used for PVB. The shifted curves are only valid for a crystallinity of 0%.
The TCSP allows to shift the Prony series for a specific temperature to different crystallinities.
The combination of both time-superposition principles hence enables to determine the linear viscoelastic material behaviour for an arbitrary temperature and crystallinity combination, so that the stiffness behaviour of the investigated material can be fully described.
Plausibility check
Validations of the derived TTSP and TCSP functions are still required. This could be done for example with the DMTA and DSC data of 5 days at 23 °C physically aged sample. However, the very low temperature rates during the DMTA (approx. 0.3 K/min), also require very low temperature rates in DSC, which proved to be very difficult to evaluate. For this reason, no further DSC was performed for the physically aged sample, and the TCSP and TTSP functions can only be checked for plausibility and not validated.
The plausibility check is performed by back-calculating the prevailing crystallinities by applying the TTSP and TCSP functions from Sect. 4.4 to the DMTA heating data of the for 5 days at 23 °C physically aged sample (sample 2 Table 3, heating mode). First, the solely temperature dependent part of the shift factor is determined by applying the TTSP derived in Sect. 4.4. The purely crystallinity dependent shift factor is calculated with Eq. (3) or (4) and the crystallinity is deduced by rearranging the TCSP from Sect. 4.4.
The so obtained crystallinities are depicted in Fig. 12. The absolute degree of crystallinity up to a temperature of − 10 °C is close to 10%, which corresponds to the initial crystallinity (= interlayer state as received from manufacturer, Schuster 2022; Schuster and Schneider 2022) determined e.g. with the first DSC heating scan or with X-ray diffraction, and hence seems to be plausible. Furthermore, cold crystallization occurs between − 10 and 15 °C, which leads to an increase in crystallinity to about 15%. As already shown in the DSC measurements (see Fig. 5), cold crystallization can certainly occur in SentryGlas®. However, it is not entirely clear, whether the maximum crystallinity value of about 15% and the temperature range at which cold crystallization occur are realistic for the applied temperature history.
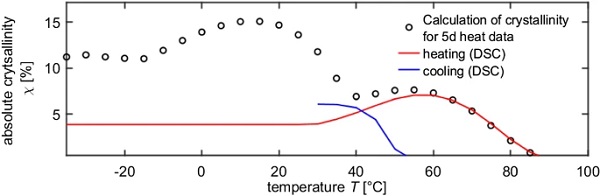
The cold crystallization is followed by a melting process between 15 and 40 °C, where the crystallinity is reduced to about 7%. In a second melting process, the crystallinity further decreases until finally all crystallites are melted at 95 °C. This second melting process is identical to that of the TFS in heating mode (without 5 d storage at 23 °C).
Summary and outlook
A methodology to determine the temperature dependent linear viscoelastic material behaviour of interlayers with semi-crystalline structures was presented.
First it was shown that the crystallinity, which is dependent on temperature direction, temperature rate and thermal prehistory, effects the stiffness behaviour of the interlayers, where high crystallinity corresponds to high stiffness. As a result, two different DMTA-TFS programs lead to different crystallinities at the same temperature levels and different storage moduli are measured. However, it was demonstrated, that regardless of the temperature program, congruent mastercurves but different shift factors are obtained, when the reference temperature is chosen to be above the melting temperature.
The shift factors used to generate the mastercurves were divided into a purely temperature-dependent part and a purely crystallization-dependent part. To perform this split, two DMTA-TFS with different temperature programs are necessary. In addition, the degree of crystallinity during the DMTA measurements must be known. For this purpose, DSC measurements were performed with the same temperature history as in the DMTA. The shift factor difference between the two temperature programs is assigned to the difference in the degree of crystallinity, which results in the time-crystallinity superposition principle. The TTSP is accordingly determined by subtracting the TCSP from the total shift factors.
Well evaluable DSC results are essential for the described methodology. Due to the stepwise DMTA-TFS program, two main disadvantages occur. First, the temperature increment defines the number of data points that can be used to define the time-superposition principles. In the presented example, the temperature increments were about ΔT = 5 °C. Since the crystallization process (in the cooling mode) only occurred in a temperature range of approx. 30–60 °C, only 7 data points (= 7 different degrees of crystallinity) were measured in the transition range. Second, the linearized temperature rates are very low (in the example presented here approx. 0.3 K/min).
DSC measurements with such low temperature rates are difficult to evaluate, which may introduce errors in the evaluation of the prevailing crystallinities. Hence, for further tests, it is suggested to either use DSC instruments that are calibrated for very low temperature rates or to modify the DMTA-test procedure. E.g. the DMTA-TFS could be replaced by DMTA-FTS (FTS = frequency-temperature sweeps). DMTA-FTS consist of many temperature sweeps conducted with different frequencies. Hence, the temperature rates in the DMTA-FTS could be chosen in such a way, that they are well realizable in DSC measurements. Additionally, this has the advantage, that the amount of measured data points can easily be increased.
The here presented characterization method by separating the effects of temperature and crystallinity has the big advantage that it allows the determination of the material relaxation behaviour for each temperature-crystallization combination. In laminated safety glass applications, where the application temperature range is both below and above the melting range of the interlayer, a realistic consideration of the interlayer crystallinity has to be made for the glass design. However, the degree of crystallization depends on the overall temperature history of the interlayer, which is not known for the lifetime of the installed laminated safety glass.
Hence, it is proposed to work with two limiting cases: The first limiting case considers a minimum degree of crystallization and would be the safe side for a design under load induced loading. A minimum crystallinity, that will always be achieved, but still has to be defined, can be used. Alternatively, a relative crystallinity of 0 can be used, but may result in too conservative results. Accordingly, to determine a realistic minimum crystallinity, studies on the temperature history of interlayers in different installed laminated safety glass applications are of great interest and absolutely necessary. The second limiting case considers a maximum degree of crystallization and would be the safe side for a design under deformation-induced loading. Here a relative crystallinity of 1 can be used.
In addition, simplified DMTA characterization methods (without the determination of the crystallinity in DSC and with smeared horizontal shift factors, which are dependent on temperature and crystallinity) based on temperature rates in real applications are also conceivable. But again, investigations on realistic temperature rates are required.
References
Acknowledgements
I would like to thank Kuraray for providing the specimens and the Institute of Construction and Building Materials (TU Darmstadt) for providing the DSC machine.
Funding
Open Access funding enabled and organized by Projekt DEAL.
Author information
Authors and Affiliations
Institute of Structural Mechanics and Design, Technical University of Darmstadt, Franziska-Braun-Str. 3, 64287, Darmstadt, Germany
Miriam Schuster
Corresponding author
Correspondence to Miriam Schuster.