First presented at GPD 2017
Tranquility is an important element to our well-being in everyday life. When it comes to sound insulation, achieving indoor quietness can be a challenge, especially for urban areas with dense population and heavy street traffic. In buildings, windows are generally more susceptible to noise penetration than other partitions because of their lower surface mass. Fortunately, acoustically engineered interlayers in laminated glass can effectively dampen sound propagation and reduce the overall sound transmission.
In this paper, the interlayer technology involved in acoustic glazing is presented from a physics perspective. The mechanism of sound transmission through a solid panel is reviewed at a fundamental level, and the technical approaches to enhance sound transmission loss of laminated glass are discussed. Lab tests and numerical simulations are conducted for verifying the performance of acoustic glazing constructions as well as making predictions.
Mechanism of sound transmission
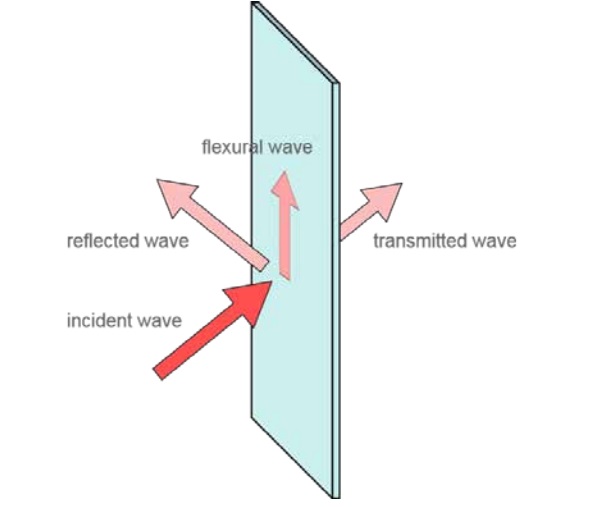
To establish a basic understanding of sound transmission, it is useful to assume a simplified geometry as shown in Figure 1. Here the solid panel is infinitely large in the vertical plane. Air fills the rest of the space on both sides of the solid. On one side of the panel, sound waves are generated and they come at the panel from arbitrary directions.
As sound waves impinge upon the solid, the acoustic energy goes three ways: the first part of the energy gets reflected back to the air; the second part couples into the solid material and induces vibration and/or sound propagating in the solid structure; the third part penetrates through the panel into the air on the other side, becoming transmitted sound waves.
Apparently the third energy fraction is of the most interest as it reflects the ability of the solid panel to block sound. Conventionally, transmittance is used to quantify how much sound energy is transmitted, defined as
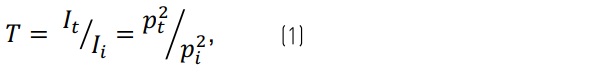
where p and I are the amplitude of sound pressure and intensity, respectively; subscripts i and t stand for the incident and transmitted sound waves, respectively. The reciprocal of sound transmittance is the sound transmission loss (STL). As human hearing exhibits sensitivity on a logarithmic scale, the STL is usually presented in decibels (dB), defined as
![]()
Given the time-frequency representation of sound waves and the problem being in the linear dynamic range, one may decompose a sound field of any temporal profile, frequency content, angular directivity and spatial intensity distribution into a summation of continuous, monochromatic plane waves. Therefore, the fundamental problem can be further simplified to the sound transmission through an unbounded panel by a plane wave propagating at a certain frequency and along a certain direction (i.e. a constant wavenumber vector) in the air.
The mechanism of sound transmission varies depending on how the panel thickness compares to the wavelength of the incident sound wave. At audible frequencies (20 Hz - 20 kHz), the acoustic wavelengths are most likely greater than the thickness of a glazing panel. At very low frequencies where the panel thickness can be considered infinitesimal, the solid material along the entire thickness dimension moves along with the incident wavefront.
In such case the incident sound wave forces the panel to vibrate and radiate sound waves back to the air. Sound transmission in this frequency range is dominated by the inertia of the panel to external excitations. The sound intensity transmittance is found to be inversely proportional to the product of sound frequency, density of the solid and thickness of the panel.
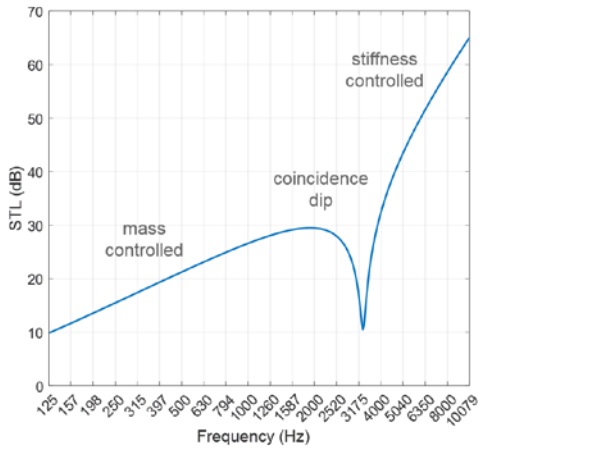
The STL therefore increases linearly with logarithmic frequency at a slope of 6 dB/ octave while the vertical offset of the STL curve is determined by the surface density of the solid panel. This linear correlation is usually referred to as the “mass law”, whereas these low frequencies comprise the mass-controlled frequency regime, as shown in Figure 2.
At higher frequencies, the acoustic wavelength in the air approaches the panel thickness, and it becomes possible that sound will propagate in the solid in the form of plate waves [1]. The dominating mode to which the majority of the acoustic energy will be distributed is the zero-order asymmetric mode, also known as the flexural wave [2]. Such mode exists in plate wave propagation as resonance exists in structural vibration, like a pendulum swing or ringing of a bell. Upon generation from an impulse excitation, a flexural wave ends up following the free propagation mode as dictated by the mechanical properties of the solid material and the thickness of the panel. The wavenumber of a free flexural wave can be described as
![]()
where ω is radial frequency; m and B are the surface density and bending stiffness of the panel, respectively. If the panel consists of only one material, the bending stiffness can be described in a simple expression as
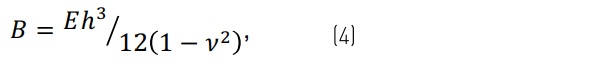
where h is the panel thickness; E and ν are Young’s modulus and Poisson’s ratio of the solid material. Although a free mode is preferred by the flexural wave, under the settings to our sound transmission problem, the entire panel is subjected to an incident plane wave of a certain wavenumber. Therefore, only the flexural wave of the same frequency and wavenumber as the projected incident wave on the panel will be allowed to propagate in the solid.
In many occasions when the “forced” flexural wave does not fit into the free propagation mode, the sound transmittance will be inversely proportional to the product of bending stiffness and cubic frequency. These frequencies comprise the stiffness-controlled regime, where the STL increases linearly with logarithmic frequency at a slope of 18 dB/octave, and the curve is vertically shifted by bending stiffness.
There is a third frequency regime where the forced flexural wave does match the free propagation mode. When this critical condition is met, a unique phenomenon, termed the coincidence effect, kicks in during the course of sound transmission. As the incident sound field engages, the solid panel exhibits pronounced displacements as if the resistance for generating flexural waves is reduced. Moreover, along the path of the incident sound wave, it would seem that the mechanical motion behaved by the panel becomes so cooperative to the incident field that a greater proportion of the acoustic energy is allowed through the panel.
Despite the term “coincidence”, this effect can be seen in the STL spectra of most glazing constructions. The dispersive nature of the flexural wave dictates that for any angle of incidence above 0 there is a frequency at which coincidence will occur. In real-world scenarios, a window panel is exposed to incident sound waves from all directions with equal probability [2]. Consequently, coincidence will take effect within a continuous frequency band, to which the span can be substantial.
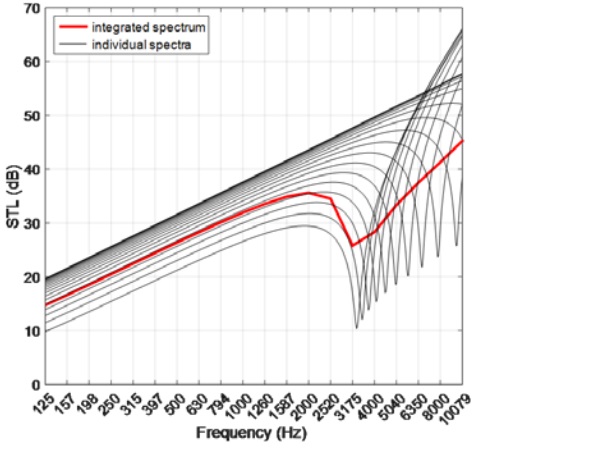
Figure 3 shows the calculated STL of a monolithic glass panel as a function of frequency from incident plane waves at various angles. It is clear that the spectra show steep STL drops covering frequencies from 3 kHz to 10 kHz and beyond. As the spectra superimpose onto one another during a practical test, these drops add up to a collective coincidence dip as seen in the overall STL signature for the panel.
Material damping and sound deadening
As the physical picture of sound transmission becomes clear, it is important that we divide the entire audio frequency range into the three regimes when evaluating the acoustic performance of glazing materials. At both ends of the spectrum, i.e. in the mass- and stiffness-controlled regimes, the assessment is rather straightforward. The major indicator for acoustic performance, the STL, will be predominantly influenced by glass. Simply utilizing thicker glass will benefit sound insulation at both frequency extremes. On the flip side, however, once the overall panel thickness is decided, there is very little room left for sound barrier engineering, since the density and modulus of glass are relatively stable.
A silver lining emerges when it comes to dealing with the third frequency regime. In this regime, we look to recover the acoustic performance that has been compromised by the undesirable coincidence effect. An effective way to achieve this goal is to introduce damping to the solid. Damping by nature represents the loss of mechanical energy and it roots from the imaginary part of a material’s elasticity. Having an outstanding damping factor in the solid will facilitate the attenuation of flexural wave propagation and the transform of acoustic energy into heat.
As flexural waves decay, the incident sound wave will be greeted with less cooperative motions by the panel, and the coincidence transmission will be reduced. It should be noted that glass by itself has a damping coefficient of almost zero in the audible frequency range at room temperature. Therefore, damping is usually added to the panel via lamination, where a comparatively soft interlayer is sandwiched between two pieces of glass.
The interlayer material, regardless of its formulation or intended application, usually increases the damping factor of the composite due to its intrinsically lower glass-transition temperature than glass. As a result, laminated glass usually exhibits a shallower coincidence dip than monolithic glass of the same overall thickness.
Engineered acoustic interlayers give rise to further improved STL over nonspecific interlayers in the damping-controlled frequency regime. The viscoelasticity of acoustic interlayers is tailored such that damping is maximized at frequencies where it is most beneficial.
For example, laminated glass constructed with two pieces of 3-mm glass and a standard PVB interlayer exhibits a collective coincidence dip around 2 kHz and a damping factor of less than 0.1 at this frequency. Replacing the standard PVB with acoustic PVB, the damping factor of the composite will be more than doubled at 2 kHz and neighboring frequencies, leading to up to 10-dB increase in the acoustic performance as well as a less steep coincidence dip in the STL spectrum.
Numerical simulations
A numerical model has been established to simulate the physical process of sound transmission through an unbounded panel. Figure 4 shows the simulated sound pressure distribution in the air and mechanical motion throughout the panel, at a certain angle of incidence and sound frequency. The panel is constructed with a monolithic layer of annealed glass of 4 mm thickness.
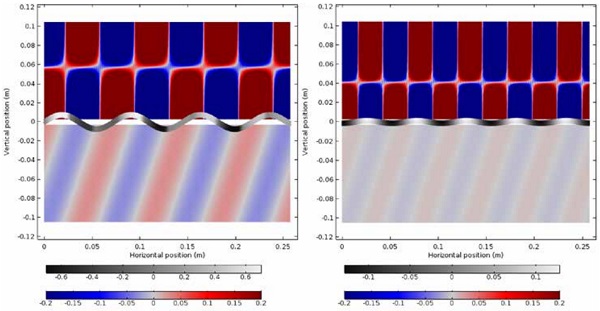
The two graphs demonstrate sound transmission at a 70-degree angle of incidence at coincidence (5 kHz) and non-coincidence (7 kHz) frequencies, respectively. Above the panel the incident and reflected sound waves interfere and form the checkered pattern as seen in the pressure field. Underneath the panel the transmitted sound wave carries itself along the same direction as the incident wave but with a discounted pressure amplitude. It is clear from the comparison that the amplitude of both the flexural wave displacement in the solid and the transmitted sound pressure in the air gets enhanced when coincidence happens.
Following Eqns. (1) and (2), the sound transmittance for a certain combination of incident angle and sound frequency can be calculated by taking the ratio between the averaged sound intensities on the upper and lower surfaces of the panel. Using this model, one can take a step further and derive the overall STL spectrum for a given panel structure by integrating sound transmittance over all the incident angles and scanning through a range of audio frequencies.
Further verification of the model was conducted comparing the simulated STL with the actual measurement, as shown in Figure 5. These measurements were taken from laboratory acoustic testing on samples of a finite size following ASTM E90 [3]. The dash lines in the figures represent the mass law as determined by the surface density of the panel. Note that the measured STL tends to exceed what is limited by the mass law at frequencies below 500 Hz.
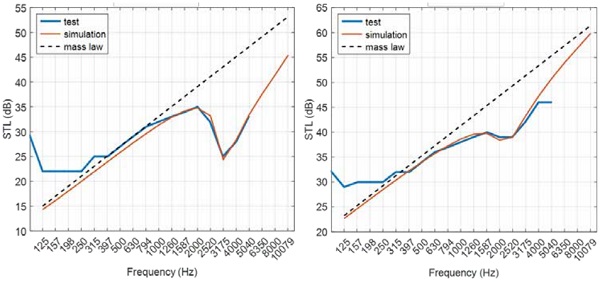
This should not be considered violations to the law of physics, but rather a result of complication to the physical processes at lower frequencies. As the sound frequency comes down to a point where the acoustic wavelength is not significantly smaller than the panel size, the generation of vibration or wave propagation in the panel is affected not only by the weight of the material in the thickness dimension but also by the boundary conditions at the edges of the panel in the lateral plane.
At frequencies over 500 Hz the measurement conforms to the mass law, indicating that the boundary effect diminishes and the test piece becomes practically unbounded to the sound waves with short wavelengths. It can be seen from the figure that the simulation faithfully describes the physical process thus providing on-point STL prediction for the majority of the audible spectrum.
Using the same model, a case study was carried out demonstrating the difference in sound insulation characteristics between standard and acoustic PVB. The results are shown in Figure 6 depicting the STL spectra of laminated glass with a variety of glass thicknesses. An obvious feature to pick up in this graph is that thicker laminates outperform thinner ones because of the extra weight and stiffness as discussed in preceding sections.
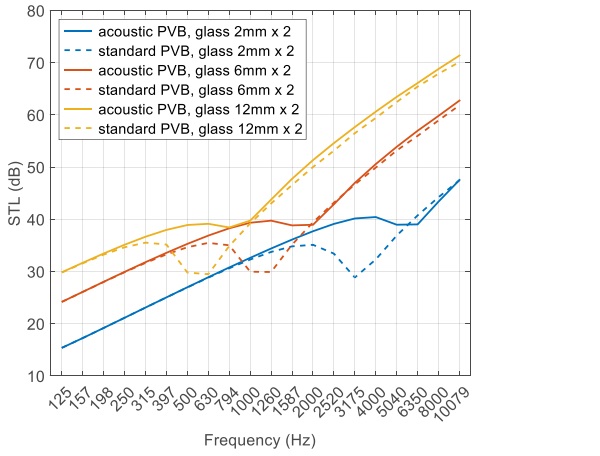
Apart from the baseline shift, the laminates using standard PVB all show a prominent coincidence dip in the STL curves. In other words, none of them is really effective keeping the coincidence effect from sabotaging the acoustic performance. It is worth mentioning that the center frequency where the coincidence dip is located is determined by the bending stiffness of the composite [2]. The higher the bending stiffness, the lower the coincidence frequency.
As seen in Eqn. (4), the bending stiffness increases with thickness. It is therefore expected that the coincidence dip in the STL spectrum move to a lower frequency as the laminate becomes thicker. Even though the coincidence frequency may shift, it is still confined between 500 Hz and 10 kHz for common glazing thicknesses (3-25mm). From a human perception point of view, our hearing sensitivity does not change much (< 2 dB) in this frequency range, therefore the excess noise the laminate lets through within the coincidence frequency band will still be noticeable.
Laminates containing acoustic PVB, on the other hand, do a much better job at dealing with the coincidence effect. The acoustic PVB brings two benefits to the table: first, the softer material reduces the bending stiffness of the laminate, moving the coincidence frequency up by approximately one octave band thus extending the portion of the curve under the mass law; second, the material features high damping factor covering a wide range of audio frequencies, hence less damage done to the STL when coincidence takes effect.
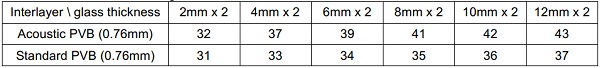
In light of both mechanisms, the performance of acoustic-specific laminates surpasses their nonspecific counterparts under the same glass configuration. At frequencies where the latter is at the bottom of the coincidence dip, the STL can be improved by as much as 10 dB owing to the acoustically engineered interlayer. This improvement can also be seen in singlenumber ratings [4]. As shown in Table 1, one can gain as much as 6 units in the sound transmission class (STC) rating when making the interlayer upgrade from standard PVB to acoustic PVB.
Conclusions
In this paper, the physics of sound transmission through a glazing panel is reviewed. Three frequency regimes are defined based on the length scale of the problem, and the physical processes associated with each frequency regime are carefully analyzed.
Following proper understanding of the physical problem, a numerical model is established and implemented for predicting the sound transmission loss signature of glazing panels. Comparisons are drawn amongst monolithic and laminated glass panels as well as laminates using standard and acoustic PVB.
Results show that acoustically engineered PVB unlocks superior sound insulation performance compared to what nonspecific interlayers have to offer. The acoustic product also shows versatility as improvement in noise reduction can be seen in a variety of glass configurations.
References
[1] H. Lamb, “On Waves in an Elastic Plate,” Proc. Roy. Soc. London, Ser. A 93, 114-128, 1917
[2] F. Fahy, P. Gardonio, “Sound and Structural Vibration,” 2nd Ed., Academic Press, 2007
[3] ASTM Standard E90, 2009, "Standard Test Method for Laboratory Measurement of Airborne Sound Transmission Loss of Building Partitions and Elements," ASTM International, West Conshohocken, PA, 2009, DOI: 10.1520/E0090-09
[4] ASTM Standard E413, 2010, "Classification for Rating Sound Insulation," ASTM International, West Conshohocken, PA, 2010, DOI: 10.1520/E0413-10