Source: Glass Structures & Engineering
Glass Struct. Eng. (2021) 6:487–510 https://doi.org/10.1007/s40940-021-00162-w
Authors:
Efstratios Volakos - University of Cambridge, Cambridge, UK
Chris Davis - H. B. Fuller | Kömmerling, Pirmasens, Germany
Martien Teich - Seele, Gersthofen, Germany
Peter Lenk - Arup, London, UK
Mauro Overend - Delft University of Technology (TU Delft), Delft, Netherlands
Abstract
Connections between load-bearing glass components play a major role in terms of the structural integrity and aesthetics of glass applications. Recently, a new type of adhesive connection, known as embedded laminated glass connections, has been developed where a metallic insert is embedded within a laminated glass unit by means of transparent polymeric foil interlayers and assembled through an autoclave lamination process. In this study, a novel variant of this connection, consisting of a thin steel insert encapsulated by a transparent cold-poured resin, is proposed and examined.
In particular, the axial tensile mechanical response of this connection is assessed via numerical (FE) analyses and destructive pull-out tests performed on physical prototypes at different displacement rates in order to assess the effect of the strain rate-dependent behaviour of the resin interlayer. It was found that the pull-out stiffness, the maximum load-bearing capacity and the failure mode of the connection are significantly affected by the imposed displacement rate.
The numerical (FE) analysis of the pull-out tests, performed in Abaqus, showed that the complex state of stress in the vicinity of the connection is the result of two load-transfer mechanisms and that the relative contribution of these mechanisms depends on the insert geometry and the relative stiffnesses of the constituent materials. Overall, it is concluded that the prototypes are promising in terms of manufacturability, aesthetics and structural performance and thus the novel variant connection considered in this study offers a promising alternative to existing load-bearing connections for laminated glass structures, but further investigations are required to ascertain its suitability for real-world applications.
1 Introduction
High strength load-bearing connections between glass components are challenging because they are required to transmit high forces in a material that is sensitive to stress concentrations (Haldimann et al. 2008) and they must do so in a visually unobtrusive manner. Load-bearing glass components are often connected by bolts specially developed for glass applications. These bolts provide an established and familiar means of connecting glass and they normally allow the glass structure to be disassembled with ease during maintenance and decommissioning stages of its lifecycle. However, bolted connections in glass are structurally inefficient, because they generate high stress concentrations in the vicinity of the bolt holes (Maniatis 2006) precisely where the glass has already been weakened by the flaws induced during the hole drilling process and by the distorted heat treatment stresses (Nielsen 2009).
Alternative connection solutions and most notably adhesive connections have been the subject of on-going research over the last 10 years (Overend et al. 2011; Belis et al. 2011; Van Lancker et al. 2016; Machalická and Eliášová 2017). Glass bonded by means of high strength, high stiffness polymeric adhesives has been shown to outperform its bolted counterparts in terms of load-bearing capacity (Overend et al. 2013). More recently, a novel form of adhesive connection, known as embedded laminated glass connections, has emerged and has made significant improvements in the load-bearing capacity and the aesthetics of structural glass connections. This connection method has been implemented successfully in real-world projects (O’Callaghan 2007, 2012; Willareth and Meyer 2011; Torres et al. 2017).
Embedded laminated glass connections consist of a metallic insert partially encapsulated in laminated glass and bonded to the glass by the laminating interlayer which is typically an ionoplast (SentryGlas) or a polyvinyl butyral (PVB) transparent foil adhesive. The insert is embedded via the standard autoclave lamination process but the heating and cooling of materials with different coefficients of thermal expansion (glass and metallic insert) during the manufacture can lead to undesirable residual stresses (Santarsiero et al. 2018) in the region of the embedded insert. These stresses are mitigated by using inserts made of titanium (Torres et al. 2017) which has a thermal expansion coefficient similar to that of glass. However, the increased cost of titanium along with the cost of the specialised (i.e. vacuum bag is required to achieve high quality lamination) autoclave lamination process make these connections relatively expensive.
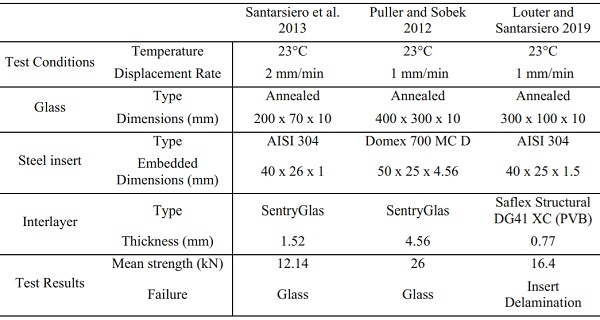
Depending on the geometric configuration and the thickness of the insert (Bedon and Santarsiero 2018b) (Fig. 1), these connections are classified into embedded laminated connections with thick (Santarsiero et al. 2017, 2018; Bedon and Santarsiero 2018) and thin insert (Belis et al. 2009; Puller and Sobek 2012; Carvalho et al. 2012; Denonville et al. 2013; Santarsiero et al. 2013; Marinitsch et al. 2016; Louter and Santarsiero 2019). The studies on the embedded connections with thin insert show that the connection achieves relatively high load-bearing capacity but its mechanical response (i.e. strength, stiffness, failure mode) is largely affected by the temperature and the loading rate. The primary results of these experimental studies along with the main test setup parameters are shown in Table 4 (Appendix).
The current study considers a variant of the embedded laminated connections, where a thin steel insert is partially embedded within the laminated glass component by means of a transparent cold-poured resin (i.e. liquid optically clear adhesive) (Davis 2013). Unlike foil lamination, cold-poured resins lamination, is not endothermic, thereby eliminating the aforementioned unfavourable residual stresses and reducing fabrication costs. Moreover, cold-poured resins are able to accommodate potential fabrication tolerances that may arise during on-site applications.
In this study, the axial load-bearing behaviour of the proposed connection is first assessed via experimental pull-out tests performed on physical prototypes (see Sect. 2). In order to investigate the influence of the strain rate-dependent response of the resin on the connection mechanical response, the tests were performed at two different (1 mm/min, 10 mm/min) constant displacement rates and the related findings are presented in Sect. 3. These pull-out tests are then modelled and analysed in Sect. 4 by means of Finite Element (FE) simulations performed in Abaqus (Simulia 2016) in order to identify the principal load-transfer/failure mechanisms of the connection and the associated stress states. The experimental along with the FE analyses results are compared and further discussed in Sect. 5. Finally, in Sect. 6, the validated numerical (FE) connection model is used for conducting a parametric numerical study to evaluate the effect of salient geometrical variables on the structural performance of the novel liquid-laminated embedded connection.
Full size image
Full size image
Materials and preparation of specimens
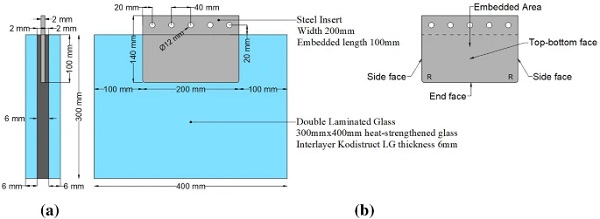
The pull-out specimens (Fig. 2) consist of a laminated glass unit comprising two heat-strengthened (BS EN 1863-1:2011 2011) glass plies where a thin steel plate is partially embedded along one long edge (glass embedment edge). The nominal dimensions of the two rectangular glass plies are 300 x 400 x 6 mm. Heat-strengthened glass was used because it combines increased strength capacity (i.e. compared to annealed glass) and relatively good post fracture performance (Haldimann et al. 2008). In order to achieve high transparency and thus enhanced aesthetics, low iron (high-clarity) soda-lime-silica float glass (BS EN 572–2:2012 2012) with polished edges was selected.
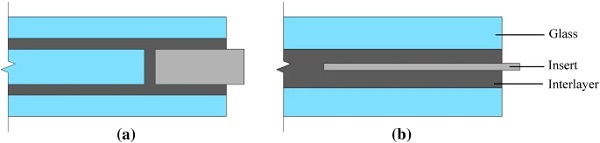
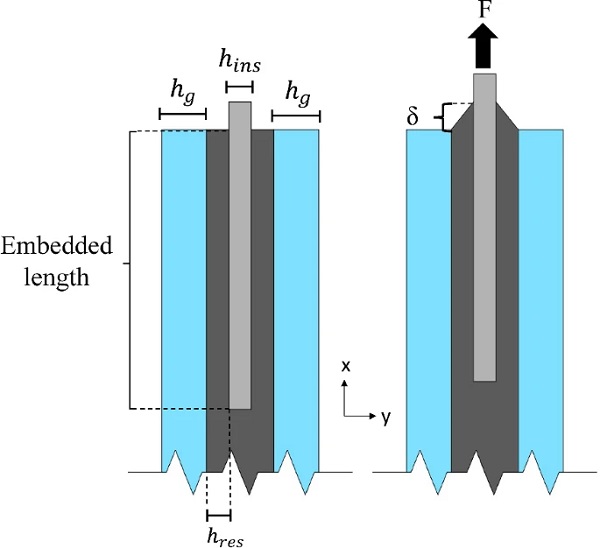
The 140 x 200 x 2 mm rectangular plate insert is made of 1.4404 stainless steel (BS EN 10088-1:2014 2014) which is polished to a surface roughness (Ra) of 0.2 mm. The insert has an embedded length of 100 mm and rounded corners (R = 5 mm) at its end face to minimise stress intensification. The embedded dimensions (100 x 200 x2 mm) of the insert were determined to be practical in terms of fabrication and testing, taking into account the geometric and load capacity of the testing machine. For internal consistency, the large faces of the steel insert are labelled as ‘top-bottom face’, the small lateral faces as ‘side face’ and the remaining embedded face as ‘end face’ (Fig. 2).
Lamination is achieved by means of a transparent two-component polyurethane-based liquid composite resin (Ködistruct LG) provided by H. B. Fuller | Kömmerling. This resin was selected due to its relatively high stiffness (especially for long-term loads) and good adhesion quality with glass (Wittwer and Schwarz 2013) . The resin pot life can be adjusted from 10 to 60 minutes, its handling (fixture) time is approximately 48 hours and its chemical curing (exothermic reaction) is mostly completed within seven days at room temperature. The thickness of the resin interlayer between the steel insert and the glass plies is 2 mm while its total thickness (away from the embedded area) is 6 mm.
Full size image
Full size image
All specimens were manufactured by the author and support staff at the H. B Fuller | Kömmerling Liquid Composite Centre of Excellence at TTec GmbH (Bexbach, Germany). The fabrication methodology is presented in the form of the following sequential steps in chronological order:
- The steel and the inner glass surfaces were cleaned with an agent (Körasolv GL solvent) to provide a dust and grease free surface. Unlike some adhesive interlayers, application of primer is not required prior to lamination to achieve good adhesion quality.
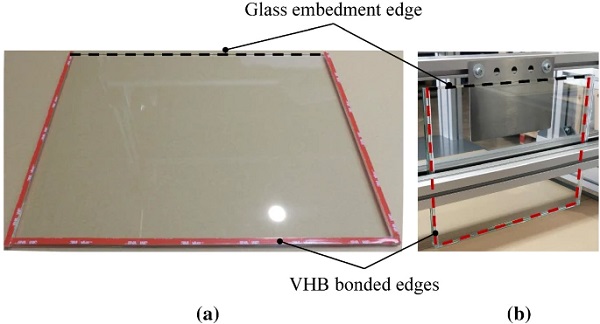
- Three layers of a 2 mm VHB (3M) clear acrylic tape was applied along three glass edges to pre-bond the two glass plies. In this way, a 6 mm gap (clearance) was formed between the two glass plies that provided a controlled envelope for the resin injection (Fig. 3).
- Hot-melt adhesive (HMA) was applied externally along the three VHB bonded edges of the glass assembly with the aid of a glue gun. These edges were further sealed with aluminium tape to eliminate potential leaks during resin injection.
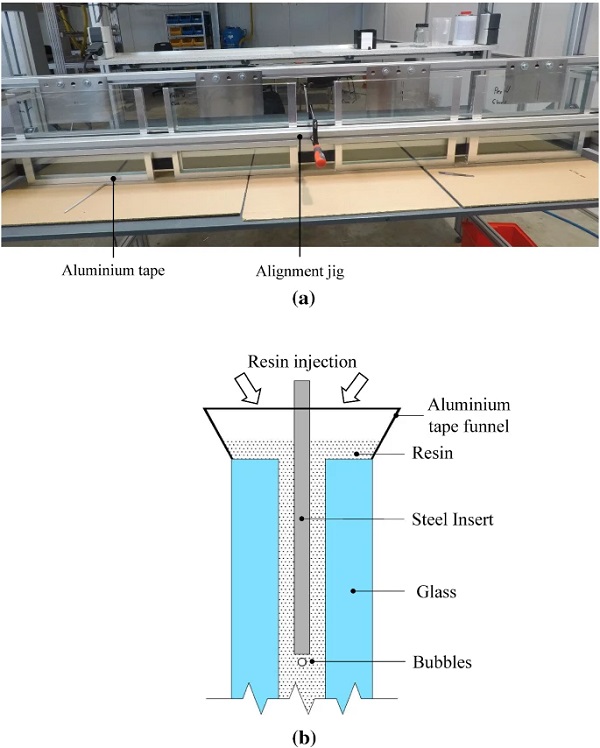
- The glass specimens were placed in a vertical position (glass embedment edge up) in a simple purpose-built assembly jig. The jig held the glass in a vertical position and simultaneously held the steel insert in position and in correct alignment with the glass during assembly. The jig had a capacity of four specimens (placed side by side) and a tolerance of ± 1 mm from the nominal geometry (Fig. 4).
- The two resin components were mixed at a specific ratio by a specialised metering/mixing system (eldomix) and then injected into the glass assembly with a pipe. The total volume of the resin required to ensure a complete filling of the finished specimens was calculated to compensate for the resin shrinkage (3.5 %) during the curing phase. Aluminium tape was used to form a suitable funnel along the entire length of the filling edges (glass embedment edges) (Fig. 4).
During the resin injection (Step 5) no leaks were observed. Visual inspection at the end of the curing period revealed that some specimens (≃ 30%) exhibited relatively small (≤ 1 mm diameter) bubbles distributed along the end face of the steel insert (ranging from 5 to 15 in total) due to air trapped during the resin injection (Fig. 4).
Experimental investigations
Pull-out tests setup
The testing campaign consists of 8 pull-out tests, all executed at Cambridge University Structures Laboratory using an Instron electro-mechanical testing machine fitted with a 150 kN load cell (± 0.5% load measurement accuracy). The tests were carried out at ambient laboratory temperature (22∘C±2∘C) and in displacement control, at two (1 mm/min, 10 mm/min) different constant crosshead displacement rates (4 tests for each displacement rate).
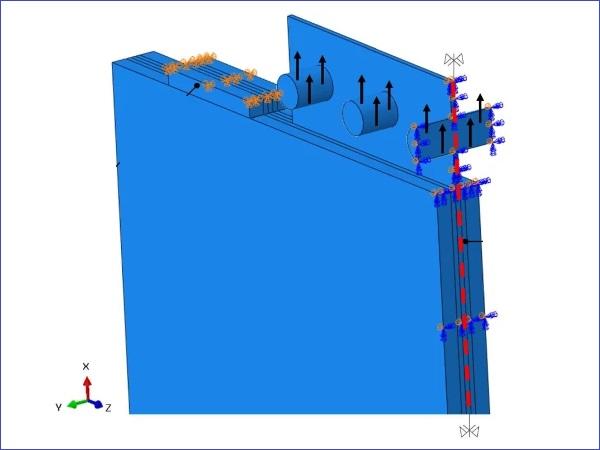
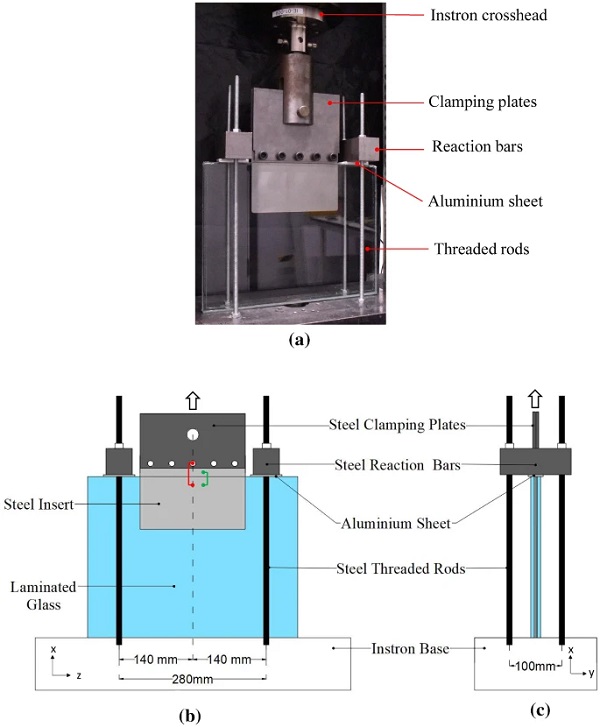
The specimens are placed vertically (Fig. 5) and the protruding part of the steel insert is connected by five M12 grade 8.8 steel bolts to two (one on each side) steel clamping plates. These steel clamping plates were in turn connected to the crosshead of the Instron machine with a single M20, grade 8.8 steel bolt. The specimens were clamped down to the machine by means of two symmetrically placed steel reaction bars which are directly fixed to the Instron base via four steel threaded rods. The steel reaction bars were placed relatively close to the steel insert (15 mm clearance) to minimize load eccentricity. Pure aluminium sheets of thickness 6.35 mm were placed between the steel reaction bars and the glass embedment edges, thereby avoiding direct contact between the glass and the steel reaction bars.
The total applied load and the crosshead displacement were recorded throughout the tests. Additionally, two transducers (one on each side) were used to measure the relative displacement between the glass and bolts (highlighted in red in Fig. 5b) and two (one on each side) laser extensometers along with two transducers (one on each side) were also used to record the relative displacement between the steel insert and the glass (highlighted in green in Fig 5b).
Full size image
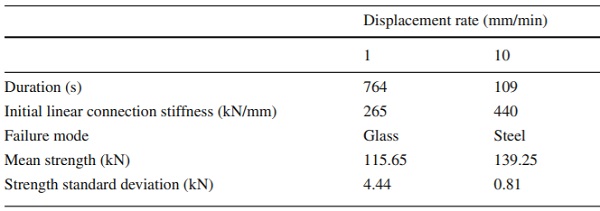
Table 1 Results of pull-out tests at different displacement rates - Full size table
Full size image
Full size image
Full size image
Full size image
Primary experimental observations and failure mechanisms
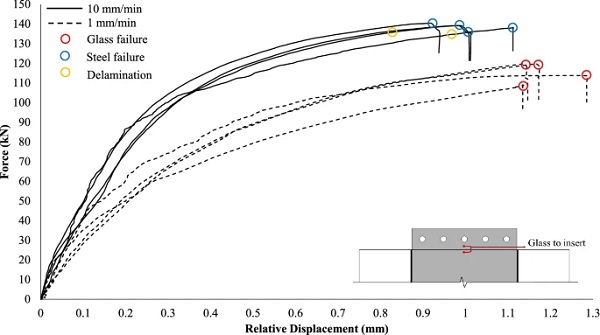
The primary experimental observations during the pull-out tests are here presented for the two different imposed displacement rates (1 mm/min and 10 mm/min). Firstly, for both applied displacement rates, yielding of the steel insert was observed in the vicinity of the boltholes at a relatively low applied load due to the high stress concentrations in this region and the relatively low grade steel insert. As the load continued to increase, this plastic deformation became more evident distorting the shape of the boltholes. Finally, when the magnitude of the applied load decreased by 40% with respect to the maximum value, the tests were automatically stopped (by the Instron machine software). The average total testing duration of the high displacement rate (10 mm/min) tested specimens was ≃ 110 s while the corresponding duration of the low displacement rate (1 mm/min) tested specimens was approximately 7 times longer (Table 1).
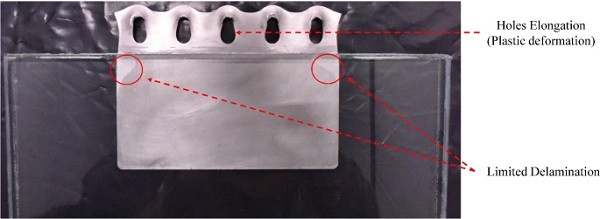
Two distinct failure mechanisms were observed during the testing. The high displacement rate(10 mm/min) tested specimens exhibited steel failure which manifested in significant plastic elongation in the region of the boltholes. This resulted in high ductility prior to failure and therefore it is deemed as a ‘safe’ failure mode. Moreover, after the steel insert had significantly plastified (i.e. applied load = 135 kN), a small degree of delamination (loss of adhesion) at the corner edges of the embedded insert of some specimens (i.e. 3 out of 4) was observed (Fig. 6).
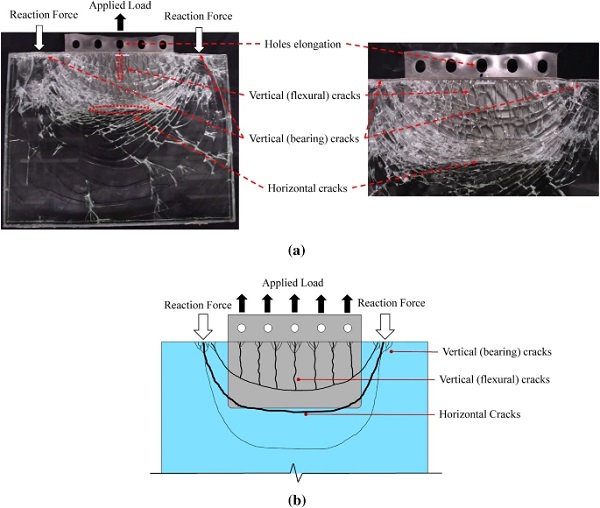
For the low displacement rate (1 mm/min) tested pull-out specimens, the failure mechanism was governed by fracture of one of the glass plies (Fig 7). However, in this case as well, the steel insert underwent large plastic deformation in the vicinity of the boltholes resulting in considerable ductility prior to glass fracture. Based on the experimental observations, the origin of glass failure was located at the glass embedment edge (Fig. 3) and especially in the region of contact with the steel reaction bars where the glass was subjected to large normal compressive stresses due to the reaction forces that led to the development of vertical (bearing) cracks (i.e. parallel to the loading direction).
These cracks instantly propagated over the embedded zone, gradually deviating from the loading direction until becoming almost perfectly horizontal (i.e. perpendicular to the loading direction) at the glass region located close to the end face of the steel insert. The formation of vertical (flexural) cracks was also observed at the glass embedded area in the vicinity of the glass embedment edge (Fig 7). Considering that in real applications the connection transfers forces (e.g. axial) between laminated glass panels (i.e. absence of reaction bars/forces), glass failure is expected to occur in the vicinity of the end face of the insert where the formation of horizontal cracks (Fig. 7) was experimentally observed.
Pull-out load-displacement curves
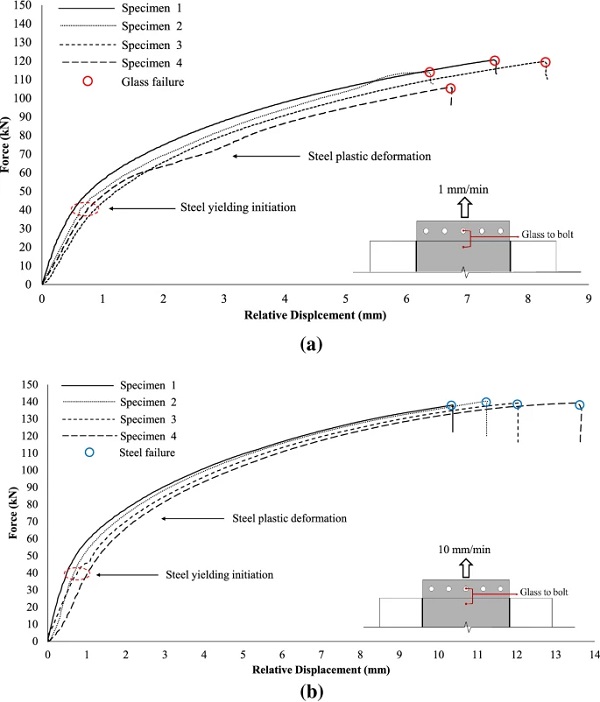
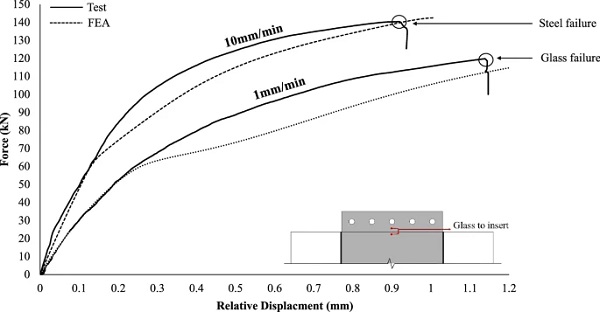
The overall structural pull-out response of the connection is further examined in terms of the load versus relative displacement curves. Figure 8 shows the applied load as a function of the relative displacement between the glass and the bolts. It is observed that for both applied displacement rates the specimens demonstrated an initial linear elastic response up to approximately 40 kN, followed by an elasto-plastic (softening) behaviour up to failure. This reduction in initial stiffness is attributed to yielding of the insert in the vicinity of the boltholes where high stress intensification occurs, in conjunction with progressive softening of the resin interlayer. After the initial linear response, for the high displacement rate specimens (10 mm/min), the load continued to increase with the steel insert deforming plastically up to a maximum load of about ≃ 140 kN and maximum displacement of approximately 12 mm where the steel insert failed in the region of the boltholes.
Accordingly, for the low displacement rate tested specimens (1 mm/min), after the initial linear response, the applied force increased up to a maximum load of about ≃ 120 kN and displacement of about 7 mm where the connection lost its load-bearing capacity due to fracture of one of the glass plies. As expected, the standard deviation of the maximum load-bearing capacity (Table 1) of the low displacement rate tested specimens that exhibited glass failure is higher compared to that of the high displacement rate tested specimens (steel failure) due to the relatively large statistical spread distribution of the glass strength.
The relative displacement between the glass and the steel insert shown in Fig. 9 allows us to decouple the two non-linear phenomena i.e. the yielding of the steel insert in the region of the bolted connection and the softening of the interlayer. From this figure, it is observed that for both displacement rates the load-relative displacement responses were initially linear and were followed by gradual softening (resin relaxation) up to adherend failure (steel for 10 mm/min and glass for the 1 mm/min). As expected, due to the higher strain rate applied, the stiffness of the 10 mm/min tested specimens is noticeably greater than that of the 1mm/min tested ones. In particular, the average (st. dev. = 16.97 kN/mm) linear connection stiffness (i.e. initial linear slope of the equivalent bilinear curve that approximates the experimental load-displacement curves shown in Fig. 9) of the high displacement rate tested specimens was found to be in the order of ≃ 440 kN/mm exhibiting an increase of ≈ 66% compared to the low displacement rate tested specimens (i.e. ≃ 265 kN/mm, st. dev. = 15.47 kN/mm) (Table 1).
By comparing Figs. 8 and 9, it can be seen that despite the high displacement rate tested specimens reached a higher relative displacement between the glass and the bolt (Fig. 8) at failure than the low displacement rate ones, the corresponding relative displacement between the glass and the insert (Fig. 9) at failure was found to be lower. This is attributed to the greater resin stiffness of the high rate tested specimens and indicates the development of large plastic deformations in the vicinity of the boltholes that eventually led to steel failure.
Numerical (FE) investigations
Description of numerical (FE) models
Connection numerical (FE) model
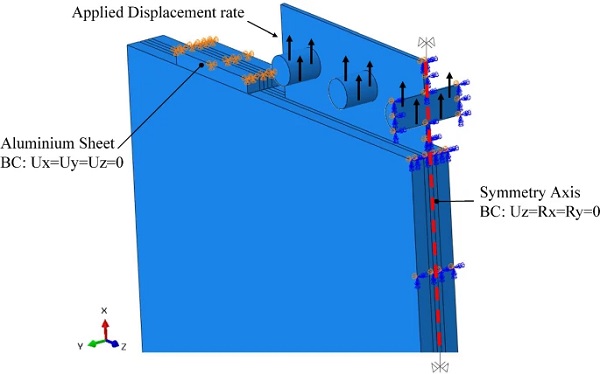
In order to further explore and understand the experimental findings, a 3D Finite Element model of the pull-out tests was constructed and analysed in Abaqus (Simulia 2016). The simulations were performed as quasi static analyses taking into account the strain rate-dependent material response of the resin interlayer (Visco Step in Abaqus). Non-linear effects from large displacements and deformations (geometric non-linearity) were also considered.
Full size image
Full size image
To reduce computational time, half of the pull-out specimen (Fig. 10) was modelled utilising the symmetry along x-axis (direction of loading) and applying the relevant boundary conditions (BC). Moreover, to further simplify the model, the steel clamping plates (Fig. 5) were omitted and hence a forced displacement rate (in the x-axis) was applied to the M12 bolts in the region of contact with the steel clamping plates. The steel reaction bars along with the steel threaded rods that restrain the glass specimens were also omitted from the model and were simulated by appropriate boundary conditions at the free (top) face of the pure aluminium sheet.
Solid brick elements were used to describe the geometry of the FE specimens. Namely, Continuum 3D stress elements (C3D8R) with reduced integration were assigned to the glass plies, the steel insert, the aluminium sheets and the resin interlayer. The main advantage of these elements is that they are not susceptible to volumetric locking phenomena (see Abaqus User’s Guide) which occur when modelling incompressible materials (Poisson ratio ≃ 0.5) as the resin interlayer. Additionally, It was assumed that the glass plies, the steel insert and the resin interlayer are rigidly connected and thus possible delamination (debonding) phenomena are neglected in the current numerical study.
For the contact between the M12 bolts and the steel insert as well as between the glass plies and the aluminium sheet, surface to surface contact interactions were defined. In the direction of the applied displacement rate, hard normal contact was considered which allows separation of the surfaces in contact but prevents penetration. For the tangential behaviour, it was assumed that the surfaces in contact can slide freely (i.e. frictionless tangential relative displacement).
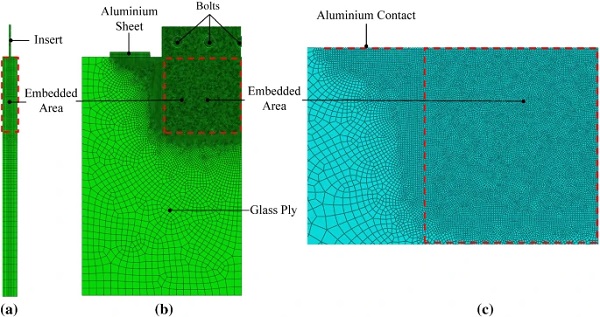
The mesh pattern of the FE model (Fig. 11) was carefully selected in order to ensure sufficient accuracy of the numerical predictions. In this regard, based on the experimental observations the mesh size was refined (solid elements of size 1mm) (i) in the region of the embedded area, (ii) in the vicinity of the contact between the glass plies and the aluminium sheet and (iii) in the region of contact between the bolts and the insert where large stress gradients are expected to occur. A coarser mesh was assigned along the end edges of the FE specimens (12mm element size). A total number of 280,000 elements and 920,000 degrees of freedom were defined to replicate/reproduce the pull-out experimental tests.
Special attention was given to the materials numerical models and especially to the strain rate-dependent behaviour of the resin interlayer. The glass was modelled as linear elastic material with nominal values for modulus of elasticity Eglass= 70 GPa and Poisson ratio vglass= 0.2 (BS EN 572–2:2012 2012). The 1.4404 stainless steel insert was modelled as elasto-plastic material with modulus of elasticity Esteel= 200 GPa and Poisson ratio vsteel= 0.3 (BS EN 10088-1:2014 2014). The yielding and ultimate stress were defined based on data provided by the product manufacturer as 320 MPa and 620 MPa respectively. For the aluminium, a linear elastic behaviour was assigned with modulus of elasticity Ealum.= 70 GPa and Poisson ratio valum.=0.30 (BS EN 1999-1-1:2007 2007).
Resin numerical (FE) model
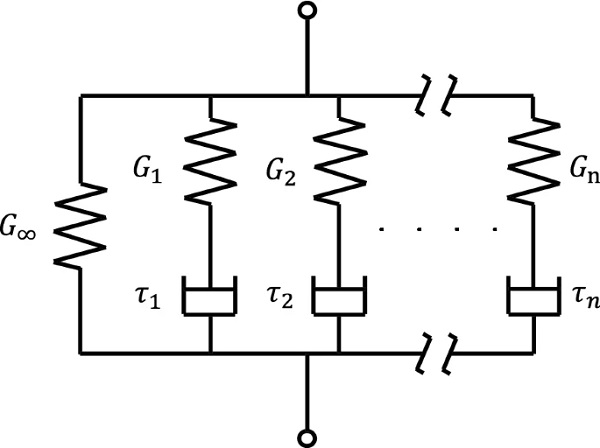
The viscoelastic behaviour of polymeric materials can be represented using the generalised Maxwell Model (Ferry 1980). This model which is commonly used to define the viscoelastic material properties in FE programs such as Abaqus, consists of a series of elastic spring and viscous damper pairs in parallel (Fig. 12). One of its main benefits is that the strain rate-dependent mechanical response of the resin is taken into account in the numerical replication of the tests.
Full size image
Full size image
The generalised Maxwell Model can be mathematically approximated with a Prony Series:
Where G(t) is the shear relaxation modulus (function of time), G∞ is the long term (infinitely slow loading) shear modulus and Gi, Gτi are the shear modulus and relaxation time respectively associated with each spring and damper pair for each term (i) of the Prony Series. The instantaneous (rapid loading) or glassy shear modulus, G0 can be evaluated as :
Table 2 Prony Series coefficients (G0=36.3MPaG0=36.3MPa) of Ködistruct LG at room tempurature (T=22∘C)(T=22∘C) - Full size table
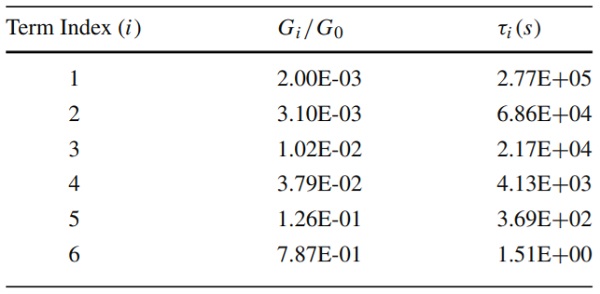
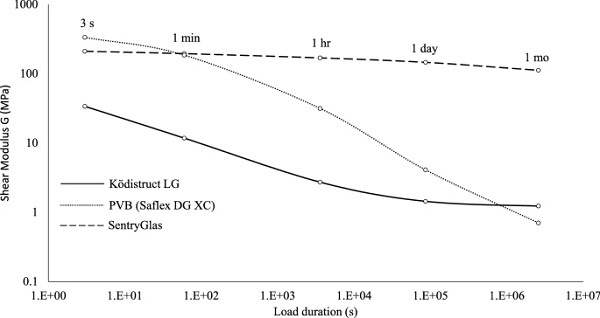
In the present study, the Prony Series coefficients of the resin were determined by the product manufacturer (H. B. Fuller | Kömmerling) and are summarised in Table 2 at room temperature (T=22∘C). In accordance with the product manufacturer, the resin is isotropic and almost incompressible (v ≃ 0.5) with its Poisson’s ratio being time and temperature independent (Wittwer and Schwarz 2013). Finally, Figure 26 (Appendix) shows the mechanical properties of Ködistruct LG in comparison to other conventional interlayers (PVB, Eastman 2021 and SentryGlas, SentryGlas Ionoplast Interlayer 2021) commonly used in glass applications.
Full size image
Numerical (FE) results
Load-transfer mechanisms and stress distribution
Given the experimental and numerical load-relative displacement curves shown in Fig. 13, the FE specimens show a close correlation with the experimental results, especially in the region of the initial linear pull-out response, confirming the experimentally observed stiffness variation between the different imposed rates. In this regard, the suitability of the numerical procedure and the materials models is verified which enables us to explore the principal load-transfer mechanisms as follows:
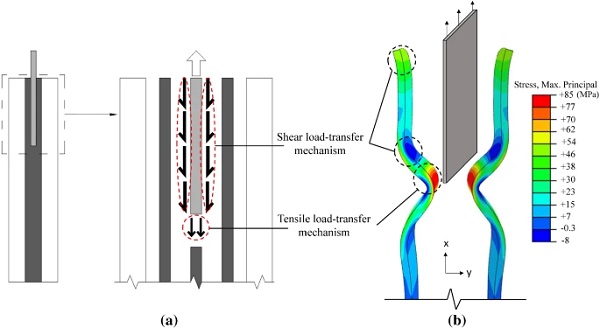
The load is initially applied to the steel insert through the bolted connection and it is then transferred to the glass plies via the resin interlayer. The load-transfer through the resin is achieved by two mechanisms (Fig. 14):
1. Shear load-transfer mechanism
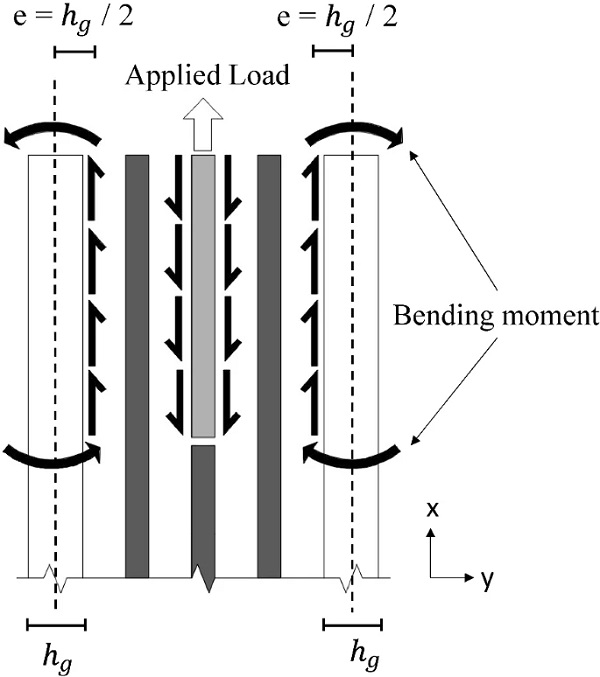
Load-transfer at the top-bottom faces (Fig. 2) of the steel insert that results in shear stresses (Fig.14) in the resin interlayer (i.e. stress tensor is mostly dominated by the deviatoric component) which are in turn transferred to the inner surface of the glass plies generating normal tensile stresses in the glass parallel to the loading direction (σx). The eccentricity, e, of these shear stresses with respect to the centroidal axes of the glass plies produces out-of-plane bending (Fig. 15) that gives rise to additional tensile stresses (σx) located at the outer and inner glass surface in the region of the end face of the insert and the glass embedment edge respectively.
2. Tensile load-transfer mechanism
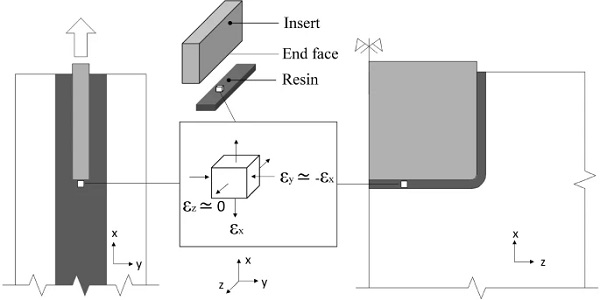
Load-transfer at the end face of the steel insert (Fig. 2) that results in normal tensile stresses in the resin interlayer parallel to the loading direction (Fig. 14). As mentioned in Sect. 4.1.2, the resin is isotropic and almost incompressible (εx+εy+εz=0) because of its high Poisson’s ratio (vresin≃0.5). In addition, the resin is highly confined (εz=0) along the in plane z direction (perpendicular to the loading direction) in this region (Fig. 16). Therefore, a small in-plane strain in the loading direction (i.e. εx) yields an equal and opposite out-of-plane (εy≃−εx) strain (i.e. contraction) producing out-of-plane bending of the glass plies and thus resulting in normal tensile stresses (σx) at the inner surface of the glass plies in the vicinity of the end face of the steel insert.
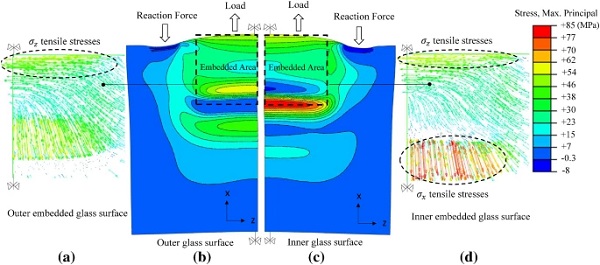
The effect of these load-transfer mechanisms on the connection response is illustrated qualitatively in Fig. 14b in terms of the out-of-plane deformed shape of the glass plies and the through thickness distribution of the maximum principal (σmax,princ.) stresses. Accordingly, Fig. 17 shows the in-plane deformed shape of the glass plies along with the distribution and direction of the maximum principal stresses. It is observed that a rather complex stress state is developed with large stress gradients especially over the embedded zone. More in detail, in the region of the glass embedment edge both the outer and inner glass surfaces are subjected to tensile stresses whose direction is perpendicular to the loading direction (σz), gradually deviating until they become parallel to the loading direction (σx) in the vicinity of the end face of the steel insert. In this region, large stress intensification (σx tensile stresses) is observed at the inner glass surface due to the combined action of the aforementioned two load-transfer mechanisms (Shear and Tensile).
Full size image
Full size image
Full size image
Discussion of experimental/numerical (FE) results
To further explore the structural response of the connection, the experimental along with the numerical (FE) results are compared and discussed.
Firstly, as expected the experimental findings revealed that the high rate tested specimens demonstrated a significantly higher linar connection stiffness compared to the low rate ones (Fig 9). Based on the average initial linear secant connection stiffness (i.e. slope =Fδ, Table 1), the average intial linear shear stiffness of the resin (Gres) for each applied displacement rate can be approximately calculated (Eq. 3) assuming a uniform distribution of the shear stresses/strains along the embedded length (Shear mechanism) and neglecting the contribution of the Tensile load-transfer mechanism:
where τaver, γaver is the average shear stress and strain in the interlayer respectively given by:
where F is the total applied load, Aemb (400cm2) is the sum of the steel insert surfaces subjected to shear stresses (i.e. top/bottom faces in Fig. 2), δ is the relative displacement between the glass and the insert and hres (2mm) is the resin thickness between the glass and the steel (Fig 18).
By substituting the above parameters in Eqs. (3), (4) and (5), it is found that the high displacement rate tested specimens exhibited an average initial linear resin shear stiffness of about 22 MPa which is increased by ≃66% than that (13.25 MPa) of the low displacement rate tested ones.
Additionally, two distinct failure mechanisms were identified from the tests. Namely, the high displacement rate tested specimens exhibited steel failure due to high stress concentrations in the vicinity of the bolt holes while the low rate tested ones exhibited glass failure. The glass crack pattern of the latter is sufficiently captured by the distribution and direction of the maximum principal glass stresses (σmax,princ,Fig 17) considering that in brittle materials (i.e. glass) the crack plane is usually located orthogonal to the maximum tensile stresses direction.
Specifically, from Fig. 17 it is observed that in the region of the glass embedment edge at the embedded zone, tensile stresses are developed perpendicular to the applied load (σz) at the outer and inner glass surface, that are in line with the experimentally observed vertical (flexural) cracks and are attributed to in-plane bending of the glass plies produced by the eccentricity between the applied load and the reaction forces (Fig 7). Figure 17 also shows the development of large tensile stresses parallel to the loading direction (σx) at the inner glass surface in the vicinity of the end face of the insert which match the location and direction of the horizontal cracks (Fig. 7). The stress intensification in this region is attributed to the combined action of the two load-transfer mechanisms (Fig. 14). Namely, the tensile stresses generated by the applied shear stresses at the inner glass surface due to the Shear load-transfer mechanism are superimposed with the tensile stresses produced by the out-of-plane bending of the glass due to the Tensile mechanism.
The experimental results also showed that the low displacement rate tested specimens failed at a lower load (≃ 120 kN) compared to high displacement rate ones (≃ 140 kN). This premature glass failure can be attributed (i) to possible variations in glass strength, (ii) to the reduced glass strength of the low displacement rate tested specimens owing to the sub-critical crack growth phenomenon (i.e. stress corrosion Haldimann et al. 2008) since the duration (Table 1) of the low displacement rate tests is significantly longer compared to the high displacement rate ones and (iii) to the different states of stress generated in the glass by testing at high and low displacement rate.
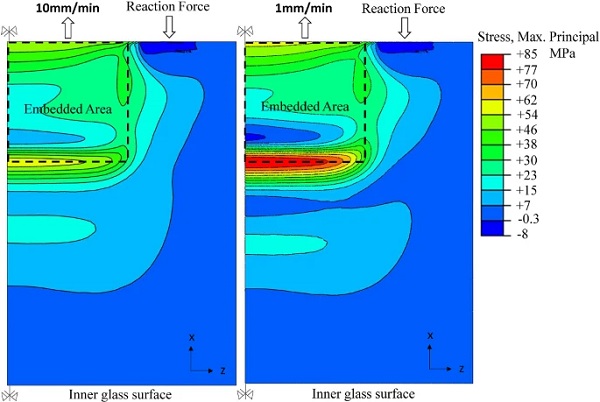
In order to illustrate the latter (iii), the distribution and magnitude of the maximum principal glass stresses for the two applied displacement rates are compared at the load of 120 kN where glass failure occurred for the low displacement rate tested specimens (Fig.19). Fig. 19 shows that the maximum stress of the low displacement rate tested specimen in the vicinity of the end face of the insert is approximately 85 MPa which is close to the characteristic strength (i.e. 70 MPa neglecting the annealed glass strength component) of heat-strengthened glass (prEN 13474-3:2009 2009). For the same applied load (i.e. 120 kN), the maximum stress of the high displacement rate tested specimens decreases by 30% (≃59 MPa) with respect to the low displacement rate ones.
This magnitude difference constitutes one of the main reasons for the premature glass fracture of the low displacement-rate tested specimens and it is attributed to the resin stiffness. Specifically, for the same applied load, the higher resin stiffness of the high displacement rate tested specimens yields lower relative displacement between the glass and the steel insert compared to the low displacement rate ones (Fig 13), producing smaller resulting axial strain (εx) in the resin located at the end face of the insert and thus reduced out-of-plane bending of the glass plies (Tensile load-transfer mechanism, see Fig. 16).
Full size image
Full size image
Geometrical parametric FEA study
FEA study of the experimental (reference) connection configuration
Given that the results obtained from the numerical (FE) model of the connection are in good agreement with the response obtained from the physical experiments, a parametric FEA study was conducted to explore and evaluate the effects of some salient geometric variations on the pull-out structural response of the connection.
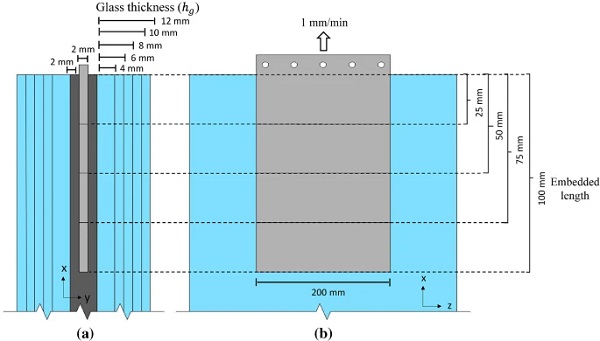
In the first instance, the pull-out load-bearing capacity of the reference (R in Table 3) connection was investigated for the low displacement rate (L in Table 3) tested specimens considering variations in the thickness of the glass plies (hg = 4, 6, 8, 10, 12mm) and in the embedded length (25mm, 50mm, 75mm, 100mm) of the insert (Fig. 20, Table 3). Other parameters such as the thickness of the resin (hreshres) and the insert (hinshins) (Fig. 18) also affect the connection mechanical response (Machalická and Eliášová 2017) but are not considered in the current study.
The experimental campaign indicated that the failure of the low displacement rate tested specimens is governed by glass fracture, therefore the criterion adopted for the numerical (FEA) determination of the maximum connection load-bearing capacity is based on the glass fracture strength. Namely, it is assumed that glass failure occurs when the maximum principal tensile stress in the glass reaches the characteristic tensile strength of heat strengthened glass (i.e. 70 MPa neglecting the annealed glass strength component) (prEN 13474-3:2009 2009).
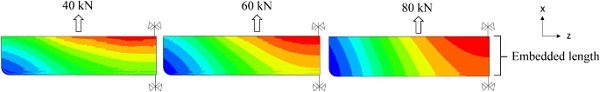
In fact, the parametric FE analyses revealed that for all configurations, the maximum principal tensile glass stress is located in the vicinity of the end face of the steel insert due to the combined action of the aforementioned two mechanisms (Fig. 14).
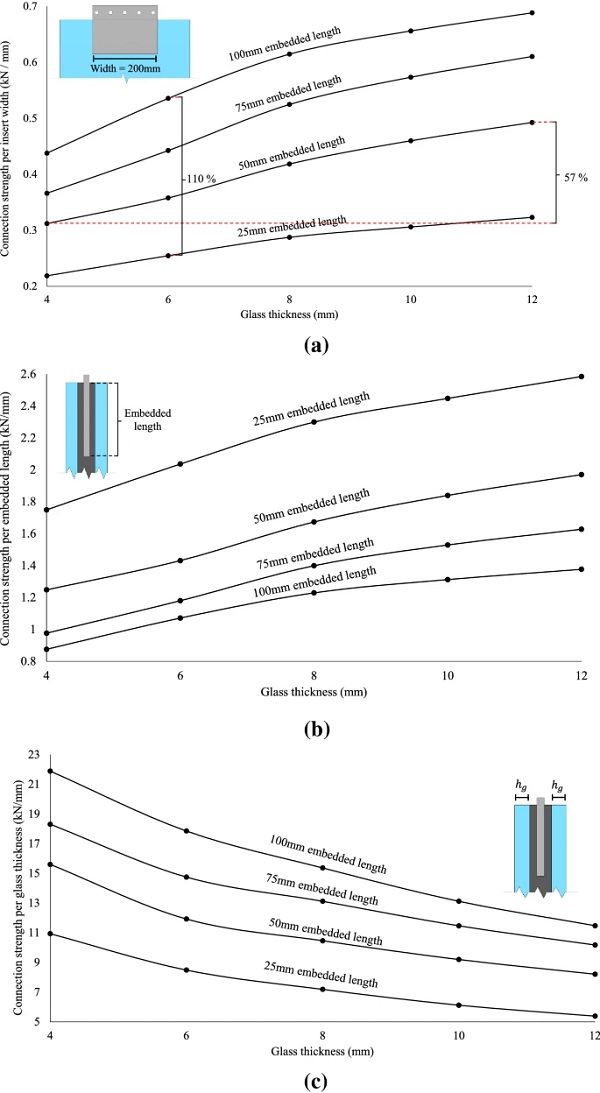
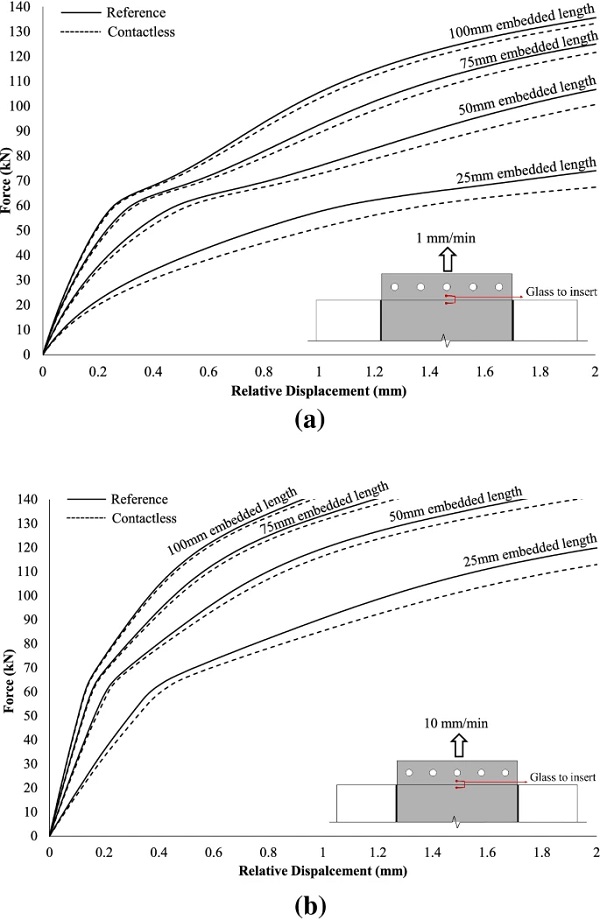
As expected, the FEA results indicate that the overall connection strength decreases with the reduction of the embedded length and/or reduction of the glass thickness (Fig. 21a). In the former case, the applied load is distributed over a smaller embedded area (i.e. top-bottom faces) which results in larger shear stresses in the resin interlayer, thus higher relative displacement between the glass and the steel insert and according to the Tensile load-transfer mechanism, larger out-of-plane bending of the glass plies. In the latter case, the glass resistance to axial loading (i.e. cross-sectional area) and out-of-plane bending (i.e. moment of inertia) decreases and thus higher tensile glass stresses are developed.
In particular, from Fig. 21a that summarises the connection strength per the width of the insert (i.e. 200 mm) for each geometrical setup, it is found that for a given embedded length (e.g. 50 mm), the average strength increase due to increase in glass thickness (i.e. from 4 mm to 12 mm) is ≃ 57% while for a given glass thickness (e.g. 6 mm), the average connection strength increase due to increase in the embedded length (i.e. from 25 mm to 100 mm) amounts to ≃110%. From this perspective, it is concluded that in terms of achieving higher load-bearing capacity, it is more effective to increase the embedded length rather than the glass thickness.
Moreover, in order to assess the effect of each parameter (i.e. embedded length and glass thickness) separately, Fig. 21b and c show the connection strength per the embedded length and per the glass thickness respectively. It is observed that for a given glass thickness, although reduction in the embedded length leads to decrease in the overall connection strength (Fig. 21a), the strength per the embedded length of the insert increases exponentially (Fig 21b). Accordingly, for a given embedded length, although reduction in glass thickness leads to decrease in the overall connection strength (Fig. 21a), the strength per glass thickness rises exponentially (Fig 21c). Therefore, it is concluded that increase of the embedded length and/or glass thickness yields higher overall connection strength but poorer material utilisation.
Full size image
Full size image
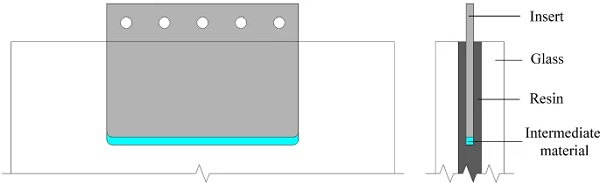
FEA study of a modified (contactless) connection configuration
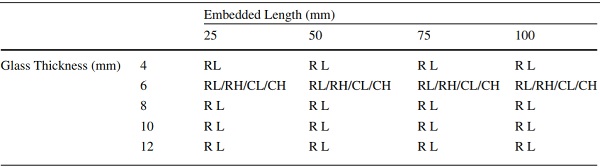
The numerical/experimental findings discussed so far, revealed that the critical region of the connection for glass failure is located at the end face of the steel insert where large stress intensification occurs due to the combined action of the two load-transfer mechanisms (Fig. 14). In this regard, in order to evaluate the effect of the Tensile load-transfer mechanism and improve the structural performance of the connection, a ‘contactless end face’ (C in Table 3) configuration (Fig. 22) was numerically (FE) modelled and assessed, featuring a 2mm gap (clearance) between the end face of the steel insert and the resin interlayer so as to prevent adhesion and load-transfer between them and hence eliminating the contribution of the Tensile load-transfer mechanism. In real world, this can be realised by placing an intermediate transparent adhesion blocking coating (e.g. EPDM, PC) at the end face of the insert prior to lamination. Totally, 4 configurations (Table 3) were analysed for each displacement rate (L, H in Table 3), all featuring 6 mm thick glass plies but different embedded length (i.e. 25mm, 50mm, 75mm and 100mm).
Table 3 Parametric FEA connection configurations (R = Reference, C = Contactless, L = 1 mm/min and H = 10 mm/min) - Full size table
Full size image
Full size image
Full size image
Full size image
Firstly, the numerical load-relative displacement curves at different embedded lengths shown in Fig. 23, indicate that regardless of the configuration type (i.e. reference R or contactless C) and the applied displacement rate, the connection pull-out stiffness is largely unaffected by end face adhesion and it is in fact governed by the embedded length. Specifically, the connection stiffness decreases with shorter embedded lengths since the applied load is distributed over a smaller embedded area. For example, for both applied displacement rates, the initial linear stiffness of the 25 mm embedded length configurations exhibits a reduction of about ≃ 62% with respect to the 100 mm embedded length ones.
By comparing the reference (R) with the contactless (C) configurations, it can be seen that the variation in pull-out stiffness rises as the embedded length decreases. This indicates that for a rectangular insert, the contribution of the Tensile mechanism to the total load-transfer depends on the ratio of the embedded length to the thickness (hins) of the insert (Fig. 18). In particular, for relatively long embedded lengths and/or thin inserts the load is mostly transferred via shear forces at the top/bottom surfaces of the insert (Shear mechanism). Conversely, for short embedded lengths and/or thick inserts a significant amount of load is transferred through direct stresses at the end face of the insert (Tensile mechanism).
Further comparison between the two configuration types indicates that for a given geometrical setup (e.g. 25 mm embedded length) the variation between the two curves becomes more apparent as the load/displacement increases (Fig. 23). This may be attributed to the gradual softening of the resin interlayer. For instance, for the 25 mm embedded length reference (R) configuration analysed at 1 mm/min (L) displacement rate, Fig. 24 shows the distribution along the embedded length of the insert of the axial displacement parallel to the loading direction (δx) at different load steps. It is observed that, as the load/displacement increases and the resin softens, the distribution of the axial displacement along the embedded length becomes more uniform and thus greater axial displacement is developed at the end face of the insert that leads to greater resulting normal strain (εx) at the resin (see Fig 16) and thereby amplifying the contribution of the Tensile load-transfer mechanism. Consequently, for a given geometric configuration, the contribution of the Tensile mechanism to the total load-transfer depends on the relative stiffnesses of the constituent materials (glass, steel and resin) and specifically the more compliant the interlayer is the more significant the contribution.
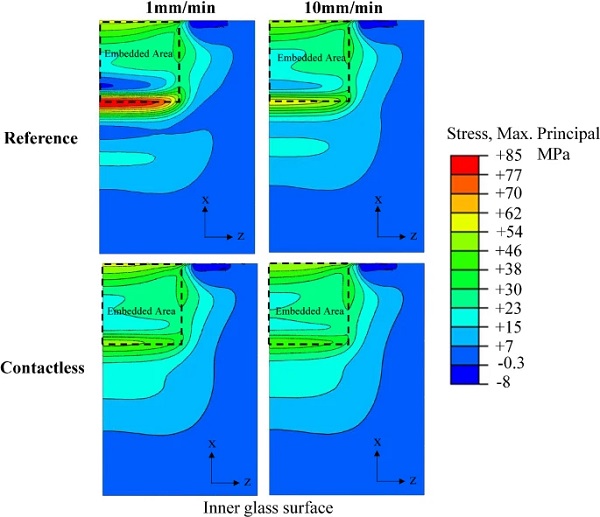
Following the implications of the Tensile load-transfer mechanism on the connection stiffness, the effect of this mechanism is further examined in terms of the resulting stress state in the glass. In fact, it was found that despite the minor difference in stiffness between the reference and contactless configurations especially for the long embedded length setups (Fig. 23), the numerical results revealed significant variations in the magnitude of the resulting stresses at the critical glass region. In particular, Fig. 25 shows that for the contactless configuration featuring 100 mm embedded length and analysed at low displacement rate (1 mm/min), the maximum principal tensile glass stress (49.02 MPa) at the load of 120 kN (i.e. experimental glass fracture) exhibits a reduction of 42% compared to the reference (experimental) configuration (84.19 MPa). For the high displacement rate tested specimens the corresponding percentage equals to 25%. Therefore, it is deduced that the contactless configuration is structurally more efficient compared to the reference one especially for relatively long embedded lengths and relatively compliant interlayers since it markedly reduces the localised glass stress concentrations without compromising the connection pull-out stiffness and aesthetic performance.
Conclusions
In this paper, the structural behaviour of liquid-laminated embedded glass connections with thin steel insert was examined by means of experimental and numerical (FEA) methods.
Firstly, from the experimental pull-out tests performed at different displacement rates, it was found that the stiffness, the load-bearing capacity and the failure mode of the connection are significantly affected by the magnitude of the imposed displacement rate. The results from the non-linear numerical (FE) model of the connection correlate well with the physical pull-out tests results. Specifically, it was observed that the numerical load-displacement curves are in good agreement with the experimental data and that the state of stress (location and orientation of maximum principal stresses) in the glass plies obtained from the FEA corresponds to the glass crack pattern observed in the experiments, exhibiting large stress concentration in the glass in the vicinity of the end face of the insert.
It was also shown that this resulting stress state within the connection is a consequence of two load-transfer mechanisms (termed, Shear and Tensile) and that the relative contribution of each mechanism depends on the geometry of the embedded insert and the relative stiffnesses of the constituent materials (glass, steel, resin). In this regard, a modified embedded connection configuration was proposed that significantly reduces the glass stress concentration in the vicinity of the end face of the insert without compromising the pull-out stiffness of the connection or its aesthetic qualities, provided that delamination phenomena do not govern the mechanical response of the connection.
Overall, the connection offers a promising performance in terms of manufacturability and structural behaviour that merits further investigation. In particular, additional experimental research is needed to assess the effect of the temperature-dependent resin behaviour on the mechanical response of the connection. In addition, considering its relatively good axial load-bearing capacity, the connection seems promising for in-plane loading glass applications (e.g. shell structures, membrane action). However, even such applications require a small degree of shear and (out-of-plane) bending capacity. Therefore, further experimental work is required to examine the structural performance of the connection when subjected to out-of-plane loading.
Table 4 Primary results and test setup parameters of several experimental studies on pull-out tests performed on laminated embedded connections with thin insert at room temperature - Full size table
Full size image
References
- Bedon, C., Santarsiero, M.: Laminated glass beams with thick embedded connections-Numerical analysis of full-scale specimens during cracking regime. Compos. Struct. 195, 308–324 (2018)
- Bedon, C., Santarsiero, M.: Transparency in Structural Glass Systems Via Mechanical, Adhesive, and Laminated Connections-Existing Research and Developments. Adv. Eng. Mater. 20(5) (2018b)
- Belis, J., Van Hulle, A., Out, B., Bos, F., Callewaert, D., Poulis, H.: Broad screening of adhesives for glass-metal bonds. Proceedings of Glass Performance Days 286–289 (2011)
- Belis, J., De Visscher, K., Callewaert, D., Van Impe, R.: Laminating metal-to-glass: preliminary results of case-study. Glass Performance Days 2009, 191–193 (2009)
- BS EN 1863-1:2011. Glass in building-Heat strengthened soda lime silicate glass. CEN European Committee For Standarization (2011)
- BS EN 572–2:2012.: Glass in building-Basic soda lime silicate glass products. CEN European Committee For Standarization (2012)
- BS EN 10088-1:2014. Stainless steels. CEN European Committee For Standarization (2014)
- BS EN 1999-1-1:2007. Eurocode 9: Design of aluminium structures General structural rules. CEN European Comitte For Standarization (2007)
- Carvalho, P., Cruz, P.J., Veer, F.: Connecting through reinforcement-Experimental analysis of a glass connection using perforated steel plates. Challenging Glass 3 (2012)
- Davis, C.: Meeting the challenges of the modern world with liquid composite laminated glass. Proceedings of COST Action TU0905 Mid-term Conference on Structural Glass, 317-322 (2013)
- Denonville, J., Puller, K., Haase, W., Sobek, W.: Long-term Behaviour of Metal Inserts Partially Embedded in Laminated Glass. Glasbau 2013, 117–127 (2013)
- Eastman Chemical Company: Product Technical Data Saflex∘∘ Structural (DG) Polyvinyl Butyral Interlayer -accessible at https://www.saflex.com/products/saflex-structural-pvb-interlayer (2021)
- Ferry, J.D.: Viscoelastic properties of polymers. Wiley, NY (1980)
- Google Scholar
- Haldimann, M., Luible, A., Overend, M.: Structural use of glass. Iabse (2008)
- Louter, C., Santarsiero, M.: Metal-to-glass Bond Strength of Structural PVB. Glass Performance Days 2019, 49–55 (2019)
- Machalická, K., Eliášová, M.: Adhesive joints in glass structures: effects of various materials in the connection, thickness of the adhesive layer, and ageing. Int. J. Adhes. Adhes. 72, 10–22 (2017)
- Maniatis, I.: Numerical and experimental investigations on the stress distribution of bolted glass connections under in-plane loads. Thesis dissertation. Technische Universität München (2006)
- Marinitsch, S., Schranz, C., Teich, M.: Folded plate structures made of glass laminates: a proposal for the structural assessment. Glass Structures and Engineering journal 451–460,(2016)
- Nielsen, J.H.: Tempered Glass: bolted connections and related problems. Technical University of Denmark, Denmark (2009)
- Google Scholar
- O’Callaghan, J.: An all glass cube in New York city. Glass Performance Days 2007, 98–101 (2007)
- O’Callaghan, J.: Adventures with structural glass. Glass Performance Days 2012, 2–6 (2012)
- Overend, M., Jin, Q., Watson, J.: The selection and performance of adhesives for a steel-glass connection. Int. J. Adhes. Adhes. 31(7), 587–597 (2011)
- Overend, M., Nhamoinesu, S., Watson, J.: Structural performance of bolted connections and adhesively bonded joints in glass structures. Journal of Structural Engineering 139(12) (2013)
- prEN 13474-3:2009. Glass in building-Determination of the strength of glass panes. CEN European Committee For Standarization (2009)
- Puller, K., Sobek, W.: Load-carrying behaviour of metal inserts embedded in laminated glass. Challenging Glass 3, 307–314 (2012)
- Google Scholar
- Santarsiero, M., Carvalho, P., Louter, C., Cruz, P.: Experimental and numerical investigations of metal-to-glass embedded connections with thin stainless steel plate. Proceedings of COST Action TU0905 Mid-term Conference on Structural Glass, 421-428 (2013)
- Santarsiero, M., Louter, C., Nussbaumer, A.: Laminated connections for structural glass components: a full-scale experimental study. Glass Structures & Engineering 79–101 (2017)
- Santarsiero, M., Bedon, C., Louter, C.: Experimental and numerical analysis of thick embedded laminated glass connections. Composite Structures 242–256 (2018)
- SentryGlas∘∘ Ionoplast Interlayer: Technical Data Sheet -accessible at www.sentryglas.com (2021)
- Simulia: ABAQUS v. 6.14 computer software and online documentation. Dassault Systems Providence RI USA (2016)
- Torres, J., Guitart, N., Teixidor, C.: Glass fins with embedded titanium inserts for the façades of the new Medical School of Montpellier. Glass Structures & Engineering 201–219 (2017)
- Van Lancker, B., Dispersyn, J., De Corte, W., Belis, J.: Durability of adhesive glass-metal connections for structural applications. Eng. Struct. 126, 237–251 (2016)
- Willareth, P., Meyer, D.: A new folding glass roof for the historic city swimming hall Zürich. Glass Performance Days 17–20 (2011)
- Wittwer, W., Schwarz, T.: A material law for shear load and creep behaviour of glass laminates. COST Action TU0905 Mid-term Conference on Structural Glass, 377-388 (2013)
Acknowledgements
The support of H. B. Fuller | Kömmerling seele and Arup in providing the materials and technical advice needed for this study is gratefully acknowledged. In addition, the authors would like to thank TTec GmbH and H.B. Fuller | Kömmerling for providing technical support for the specimens fabrication. This research project is funded by the EPSRC (UK) Doctoral Training Account and supported by H. B. Fuller | Kömmerling, seele and Arup.
Funding
This research project is funded by the EPSRC (UK) Doctoral Training Account and supported by H. B. Fuller | Kömmerling, seele and Arup.