
Authors: Karoline Osnes, Jens Kristian Holmen, Tormod Grue & Tore Børvik
Source: International Journal of Impact Engineering, Volume 156, October 2021
DOI: https://doi.org/10.1016/j.ijimpeng.2021.103922
Highlights
- Ballistic impact experiments were carried out on double-laminated glass plates.
- A single and double pane configuration were tested two and six times, respectively.
- Two of the tests with a double pane configuration resulted in embedment of the bullet.
- Numerical simulations with node splitting recreated the global behaviour very well.
Abstract
Laminated glass is a type of safety glass that is frequently used in blast-resistant windows and bullet-proof glazing. However, few studies concerning the perforation resistance of laminated glass exist in the open literature. In this study, double-laminated glass plates are impacted by 7.62 mm armour piercing (AP) bullets, and their ballistic limit velocity and curve are determined both through experimental tests and numerical simulations. Two different configurations, i.e., a single pane configuration and a configuration of two panes stacked with an airgap in between, are tested at striking velocities between 375 and 700 m/s.
The experimental tests showed that the amount of cracking can be divided into three distinct zones and that the extent of these zones is dependent on the striking velocity. In the numerical study, finite element simulations employing higher order elements and 3D node splitting are used to predict the velocity-time history of the bullets during impact. The simulations employ simplified material and fracture models for the glass and PVB. Even so, the numerical predictions are found to be in excellent agreement with the experimental data, and both the residual and ballistic limit velocities are precisely determined.
1. Introduction
Due to the brittle nature of glass, windows made from annealed float glass provide limited protection against ballistic impact. However, glazing configured with multiple layers of glass and polymer can be bullet resistant [1]. The glass and polymer layers are bonded together to a laminate through a process including heat and pressure in an autoclave. When the laminated glass is impacted by a projectile, the polymer will keep the layers together and prevent large fragments from being ejected by retaining the shattered glass on the interlayer.
The mechanical properties of float glass are dominated by a brittle fracture behaviour with a probabilistic fracture strength that is dependent on the geometry, loading situation and boundary condition of the glass plate [2]. The probabilistic fracture strength of glass is due to the presence of microscopic surface flaws where fracture typically initiates. The flaws also cause glass plates to fail primarily in tension since crack propagation is generally induced by mode I loading (i.e., the opening of a flaw) [3]. Thus, the tensile strength of glass is typically much lower than the compressive strength. If the microscopic surface flaws are removed or reduced (e.g., by chemically etching the glass surface), the fracture strength can be significantly increased.
In a study by Nie et al. [4], the authors managed to improve the flexural strength of borosilicate glass by about one order of magnitude through hydrofluoric acid etching. Other methods for improving the fracture strength of glass can be found in e.g., Donald [5]. The fracture strength of glass also depends on the loading rate. This rate dependency has been demonstrated in several studies and applies to loading in both tension [4,[6], [7], [8]] and compression [7,9,10]. In the study by Nie et al. [4], the average flexural strength for acid-etched specimens increased by about 200 % when the stress rate was increased from 0.7×10⁶ MPa/s to 4×10⁶ MPa/s. Sandpaper-ground specimens obtained an increase of 90 % for the same stress rates. Different flaw shapes were considered to be the cause of the difference in the rate dependence between the acid-etched and sandpaper-ground specimens.
Under highly localised loading, such as ballistic impact, failure mechanisms other than tension failure might be present. When struck by a projectile, the impact side of the glass plate experiences compression and shear loading at high strain rates, which result in fracture and pulverization of the glass material. The back side of the impacted plate may fail because of bending-induced tension [11]. Tensile failure under ballistic loading typically occurs in thin plates, and then the fracture strength is governed by the presence of microscopic surface flaws on the back side. For thick plates, however, the tensile strength of glass is considered less crucial to the ballistic performance [12].
Compared to metals, a rather small number of experimental studies on the ballistic perforation resistance of laminated glass exist in the open literature. Some notable studies include experiments by Anderson et al. [13,14], Shim et al. [15], Bless et al. [16], Strassburger et al. [17], Hu et al. [18] and Osnes et al. [19]. Anderson et al. [13,14] performed ballistic experiments on borosilicate glass plates backed by a polycarbonate layer. The study presented in [13] demonstrated a scale effect with a reduced performance when increasing the plate size, while the main objectives of the tests in [14] were to measure crack velocities and the damage velocity of glass. Shim et al. [15] performed experiments on different configurations of laminated glass and demonstrated a varying ballistic performance with glass thickness, polymer material and stacking sequence.
The authors also showed that when increasing the tensile strength of the glass by tempering, the ballistic performance improved. The same conclusion was made by Vlasov et al. [20]. They tested untreated and treated monolithic glass plates under ballistic loading. The treatment involved removing surface cracks by hydrofluoric acid, thus improving the tensile strength, and significantly enhancing the impact resistance of the glass target. The experimental studies by Bless et al. [16] and Strassburger et al. [17] involved ballistic testing of a composite consisting of several layers of glass with a polycarbonate backing.
The damage morphology was reported in both studies. In the experimental studies by Hu et al. [18], the authors tested thin soda-lime glass plates with a polycarbonate backing impacted by a spherical projectile and reported a significant change in the damage pattern with a change in the impact velocity. The study by Osnes et al. [19] involved laminated glass plates consisting of soda-lime silica float glass with an interlayer of PVB impacted by 7.62 mm AP bullets at velocities ranging from 672 to 892 m/s.
The tests were carried out to study the performance of laminated glass plates damaged by a fragment or a bullet before arrival of a blast wave generated by an explosion. It was found that the protective capacity of the laminated glass was significantly reduced if it was pre-damaged by a fragment or a bullet. From these studies, it is clear that the ballistic performance of a laminated glass plate is dependent on several factors, including the mechanical properties of the glass and polymer, the impact velocity of the projectile, and the stacking sequence and the thicknesses of the different layers.
In addition to the works on laminated glass discussed above, some studies on monolithic glass under ballistic loading exist. As an example, Anderson and co-workers [21], [22], [23] presented a series of experimental studies on the behaviour of lead and borosilicate glass impacted by a gold rod at velocities between 1 and 2 km/s using high-speed video and flash radiography. Also, a large literature on the ballistic perforation resistance on ceramic armour are available (see e.g., the recent review article by Zhang et al. [24]).
As an alternative to experimental tests, finite element (FE) simulations can be used to study the influence of different parameters on the ballistic performance of laminated glass. Utilizing such methods may help to optimize glass solutions in a systematic and more economical way. One of the first attempts to model penetration in glass was presented by Holmquist et al. [25]. Later, some of the same authors published a constitutive model for glass subjected to large strains, high strain rates and high pressures [26], and used this model to simulate the experimental tests in Anderson et al. [13] and Behner et al. [21] with reasonable results. Recently, Holmquist et al. [27] proposed an improved version of their original model.
However, due to the brittle behaviour of glass it is difficult to capture the macroscopic cracking and fragmentation process during ballistic impact using traditional finite element methods and element erosion. As a consequence, a number of alternative numerical techniques have been proposed over the years to simulate this problem with varying degrees of success. These techniques include, but are not limited to, the extended finite element method (XFEM), smoothed particle hydrodynamics (SPH), discrete element methods (DEM) and cohesive zone models (CZM) [28], and more recently peridynamics (PD) [29] or phase-field models (PFM) [30].
Here, we will introduce an alternative numerical technique to model ballistic impact on laminated glass through higher order elements and a 3D node splitting algorithm. Even though the simulations employ simplified material and fracture models for the glass and PVB, the substantial potential of this approach to model ballistic penetration and perforation of highly brittle materials will be demonstrated.
In this study, double-laminated glass plates are impacted by 7.62 mm AP bullets, and their ballistic limit velocity and curve are determined both through experimental tests and numerical simulations. The double-laminated glass plates consist of three 3.8 mm thick glass sheets and two 1.52 mm thick polyvinyl butyral (PVB) interlayers. Two different configurations, i.e., a single pane configuration and a configuration of two panes stacked with an airgap in between, are tested at bullet velocities between 375 and 700 m/s.
In the numerical study, FE simulations employing higher order elements and 3D node splitting are used to simulate the ballistic impact tests. The main objective of the numerical study is to investigate whether the simulations can recreate the global behaviour (e.g., the perforation resistance of the laminated glass) using relatively simple FE models and the node splitting technique, while capturing local behaviour (such as crushing of the glass material) is of second-order importance.
2. Materials
2.1. Laminated glass
The double-laminated glass plates used in this study consist of annealed soda-lime silica float glass and polyvinyl butyral (PVB) of the type Saflex RB-41. Annealed glass refers to a glass product which has undergone an annealing process, and thus contains almost no internal stresses. Soda-lime silica refers to the main components of the glass, i.e., silica sand (silicon dioxide), lime (calcium oxide) and soda (sodium oxide) [31]. Float glass is made by the float process, which is the most common method of producing glass today.
Glass is a brittle material and exhibits a linear-elastic behaviour until fracture. Fracture in glass plates typically initiates in microscopic surface flaws, which leads to a highly stochastic fracture behaviour [2]. The microscopic flaws also cause the compressive fracture strength to be much larger than the tensile strength [3]. In addition, the glass strength is known to be strain-rate dependent [4,[6], [7], [8], [9], [10]]. Table 1 presents some commonly used material parameters for glass. Note that the listed fracture toughness (KIC) is found from quasi-static tests [33].
Table 1. Material parameters for soda-lime silica glass [32,33].
![Table 1. Material parameters for soda-lime silica glass [32,33].](/sites/default/files/inline-images/Tab1_150.jpg)
PVB is the most used interlayer in laminated window glass and automobile windshields. It is a highly flexible material and may undergo large strains before failure without significant permanent deformation. It is also considered to be nearly incompressible [34]. Moreover, PVB exhibits a nonlinear behaviour that is dependent on the loading rate and the temperature [35,36]. The stress-strain history at high strain rates shows an initial steep rise in the stress before an abrupt decrease occurs. This initial rise is not observed at low strain rates. In a study by Hooper et al. [35], the instantaneous shear modulus of PVB at room temperature was measured to G₀=178 MPa. Thus, by assuming an incompressible material (Poisson's ratio ν=0.5) the instantaneous Young's modulus is found to be E₀=534 MPa. Finally, it has been reported that the failure strain of PVB decreases with an increasing strain rate [36].
Laminated glass is typically made by sandwiching layers of polymer in between two or more glass plates. The layers are bonded together mechanically and chemically through a process including heat and pressure in an autoclave. The main purpose of the polymer interlayer is to increase the loading resistance, to retain broken glass fragments on the interlayer and to break the glass fragments into smaller pieces when the glass fractures. The laminated glass plates used in this study were delivered by Modum Glassindustri in Norway.
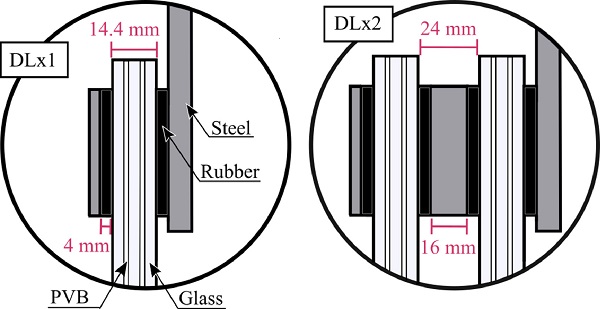
Fig. 1 shows the stacking sequence of the laminated glass plates subjected to ballistic impact in the study: Three plies of 3.8 mm thick glass plates separated by two 1.52 mm thick PVB plies. The total nominal thickness of one double-laminated plate is thus 14.44 mm, while the in-plane dimensions were 400 mm × 400 mm. Two different glass pane configurations were tested:
- DLx1 – One double-laminated glass plate (left in Fig. 1).
- DLx2 – Two layers of double-laminated glass plates with a 24 mm airgap in between (right in Fig. 1).
DLx1 was tested twice (DLx1-1 and DLx1-2) at two different impact velocities, whereas DLx2 was tested six times (DLx2-1 to DLx2-6) at five different impact velocities.
2.2. Bullets
Fig. 2 shows the geometry of the 7.62 mm armour piercing (AP) bullet that was used in all the ballistic impact tests. The bullet consists of a hardened steel core, a lead cap, and a brass jacket and end cap. Its total mass is 10.5 ± 0.25 g. The steel core has a maximum diameter of 6.1 mm, a mass of 5.0 g, a Rockwell C hardness Rc of 63 and a calibre radius head (CRH) of 3.0. The lead cap, which purpose is to stabilize the bullet during flight and in the initial stage of the penetration process, has a mass of 0.7 g. The brass jacket and end cap have a combined mass of 4.8 g. Relevant material data is summarized in Table 2, while further details regarding the make-up of the bullet and associated tests can be found in Børvik et al. [37].
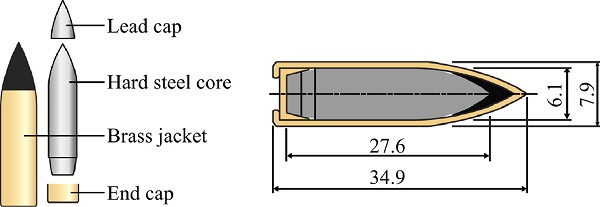
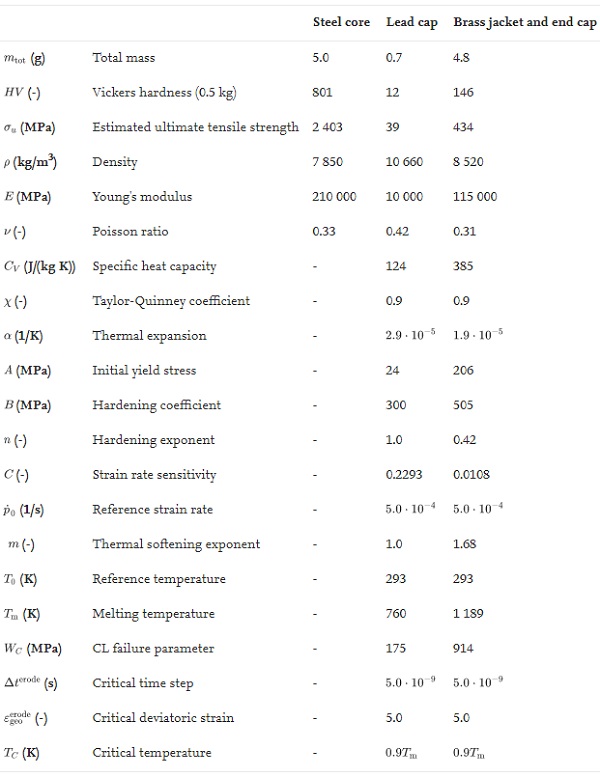
Table 2. Physical and modelling details about the 7.62 AP bullet [37].
3. Component tests
3.1. Experimental tests
The ballistic tests were conducted in a ballistic range that was first described in Børvik et al. [38]. In this study, the 7.62 mm AP bullets were fired from a smooth-bored Mauser gun that was mounted in a rigid rack in a bullet proof impact chamber. A magnetic trigger allowed us to initiate the tests from a safe distance. By adjusting the amount of powder in the cartridge, we could control the impact velocity of the bullet to within ± 20 m/s. The distance from the muzzle to the target plate was approximately 1 m.
Fig. 3a shows how two steel beams were used to clamp the laminated glass plates to the test fixture. There were two bolts for each beam, and each bolt was tightened with a torque of 10 Nm. The setup was aligned to ensure that the striking point was at the centre of the glass target and that the impact angle was perpendicular to the target face. Because a large portion of the glass target cracked and shattered during impact, the target was replaced after each test.
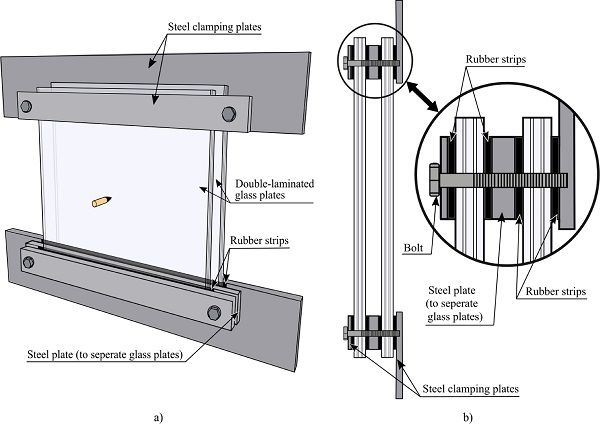
Rubber gaskets were placed at all steel-to-glass interfaces to prevent the glass from breaking before the test started (see Fig. 3b). All rubber gaskets were 4 mm thick, meaning that in the tests where two double-layered laminated glass plates were tested (DLx2), the total spacing of 24 mm was maintained with 16 mm thick steel inserts.
The primary objectives of the ballistic test series were to determine the ballistic limit velocities and curves for the laminated glass plates and to obtain a basis of comparison to evaluate the fidelity of FE simulations. The perforation process for all the tests were captured by a Phantom v2511 high-speed camera operating at 75 000 fps with a resolution of 1280 × 256 pixels. These image series were later used to determine the impact and residual velocities of the bullet by tracing the tip of the bullet, and to investigate the dispersion of the debris clouds and fragments from the impact.
After each test we carefully removed the laminated glass plates from the test fixture before photographing each plate separately. Pertinent measurements of the different zones (bullet hole, comminution zone, dense cracks) were also conducted after testing.
3.2. Ballistic results
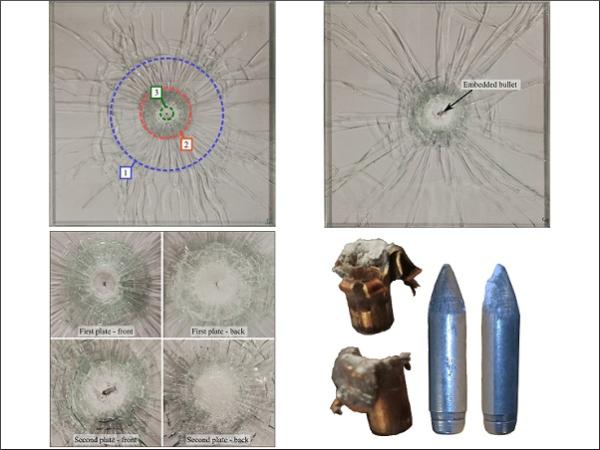
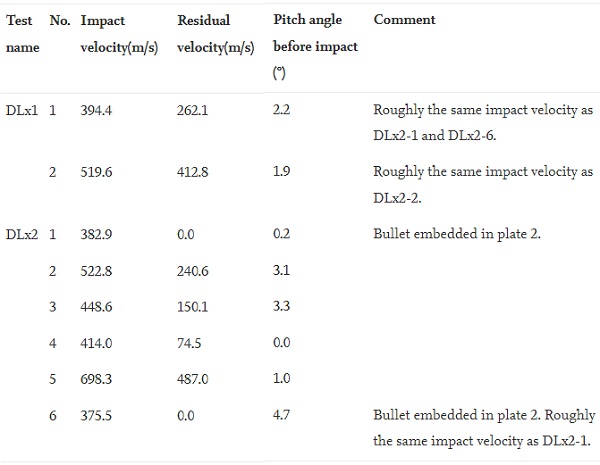
Table 3 lists the measured impact and residual velocities from each test. For DLx1, the impact velocity of both tests was high enough to cause perforation and the residual velocities were relatively high. For DLx2 we obtained residual velocities both above and below the ballistic limit velocity. In tests DLx2-1 and DLx2-6, the bullet was embedded in the rear plate, while for the remaining four tests, the bullet perforated the target and retained a residual velocity. Note that tests DLx2-1 and DLx2-6 had approximately the same impact velocity, which suggests that the variability of the glass strength may not be as prominent under high-velocity ballistic loading as under other loading conditions [2].
Table 3. Overview of the ballistic impact tests.
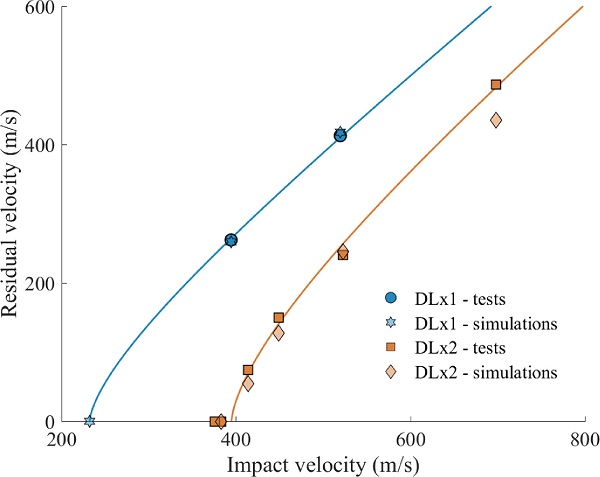
The residual velocity (vr) is plotted against the impact velocity (vi) in Fig. 4. The solid lines follow the generalized Recht-Ipson equation [39]
![]()
where a and p are fitting parameters.
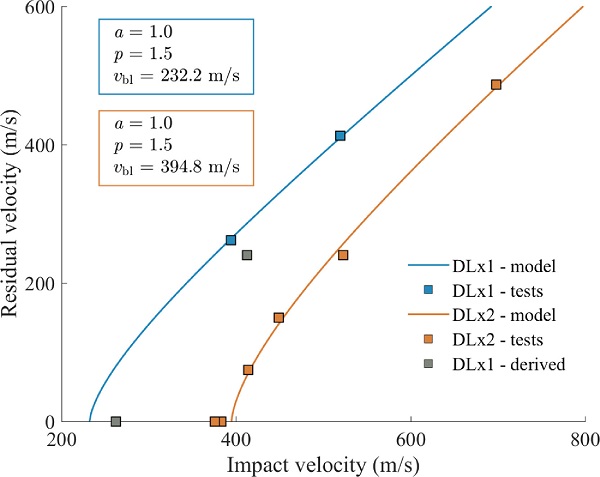
For DLx2, the ballistic limit velocity vbl=394.8 m/s was taken as the average of DLx2-4 and DLx2-6, that is the lowest impact velocity that resulted in perforation and the highest impact velocity that resulted in embedment. The parameters a=1.00 and p=1.50 were then found by minimizing the mean squared error of Eq. (1) to the experimental results. Because we only had two tests for DLx1, we assumed a=1.00 and p=1.50 (based on the DLx2 tests) and used vbl as the variable to optimize. The resulting value was found to be vbl=232.2 m/s.
The lead cap and the brass jacket were always peeled off the hardened steel core during perforation of the first plate, while the nose of the core deformed marginally during testing. In the two tests where the bullet was embedded in the rear plate (DLx2-1 and DLx2-6), the brass jacket was found deformed and cracked between the two laminated glass plates after testing. In addition, in tests DLx2-3 and DLx2-5 there were small parts of the brass jacket embedded in the rear plate. In DLx2-4, a piece of the brass jacket was embedded in the first plate.
The impact velocity in test DLx1-1 is nearly identical to the impact velocity in DLx2-1, and the impact velocity in test DLx1-2 is close to the impact velocity in DLx2-2. By studying the residual velocity of the DLx1 tests we could get a decent estimate of the velocity between the two plates in DLx2-1 and DLx2-2, and thus the velocity at which the bullet struck the rear plate. These datapoints are plotted in Fig. 4 (denoted “DLx1 derived”) and they indicate that the resistance of a plate increases if the bullet has previously perforated a plate. This might be because the brass jacket has been stripped off in the first plate and the mass and kinetic energy associated with the bullet is smaller, or because the fragments and debris from the first plate affect the impact process in the second plate. Additionally, after impacting the first plate, the trajectory of the bullet was generally altered, which could also affect the perforation of the second plate.
3.3. Debris cloud and crack pattern
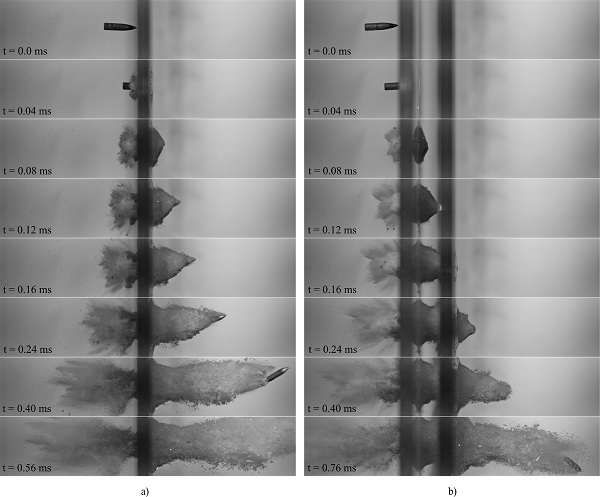
Figs. 5a and b show high-speed camera images from tests DLx1-2 and DLx2-2, respectively. It is seen in both tests that powdered-like glass fragments were generated quickly after the bullet impacted the glass plates. About 0.020-0.040 ms after contact, the material on the back side of the glass plates shattered, presumably due to tensile stresses. Further, we observed that the fragments travelled in the same direction as the bullet on the back side, and in the opposite direction on the front side. In DLx2-2, the second plate was hit by glass fragments ejected from the first plate. It appears that the combined mass of the fragments is larger than the weight of the bullet. However, since the fragments are highly dispersed, we assume that the local loading effect on the second plate is small compared to the pointed bullet.
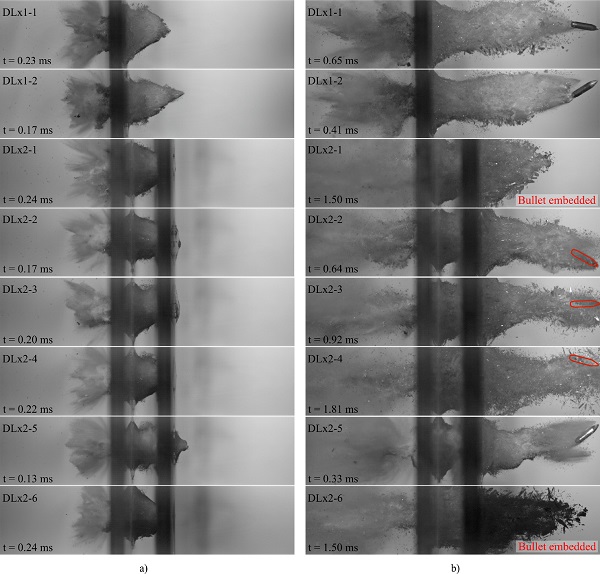
Fig. 6 presents high-speed camera images from all the tests. The images in Fig. 6a are taken from a scaled time equal to t=0.24·(375.5/vi) ms after first bullet-glass contact, i.e., a time where the bullet had perforated the first plate, but not yet the second plate in DLx2. In Fig. 6b, the images are taken from a time in which the bullet had perforated the plates and travelled approximately 175 mm from first contact. Images from the tests where the bullet was embedded in the second plate (DLx2-1 and DLx2-6) are also included and are taken at a time t=1.50 ms after first contact. Note that for the tests DLx2-2 to DLx2-4, the bullet is not visible under the glass fragments, and the approximate position and orientation of the bullet are indicated in red.
From Fig. 6a, it appears that the pulverized area and the amount of glass fragments ejected from the front of the first plate were relatively constant for all the tested velocities. Furthermore, Figs. 5 and 6b show that the glass fragments cannot keep up with the projectile if the residual velocity of the bullet is above, say, 240 m/s. We also observed that although the residual velocity of the bullet is zero, glass fragments were still ejected from the rearmost glass plate.
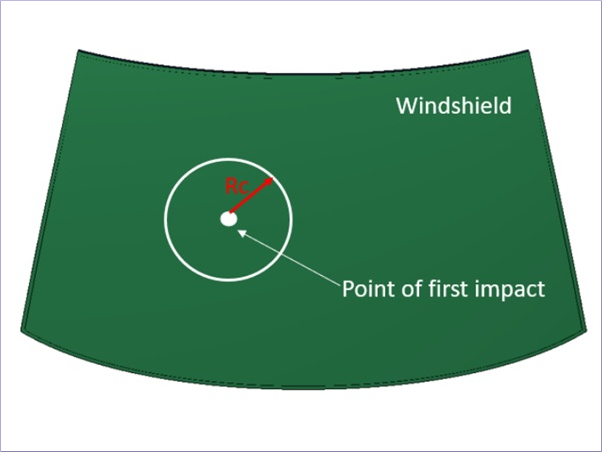
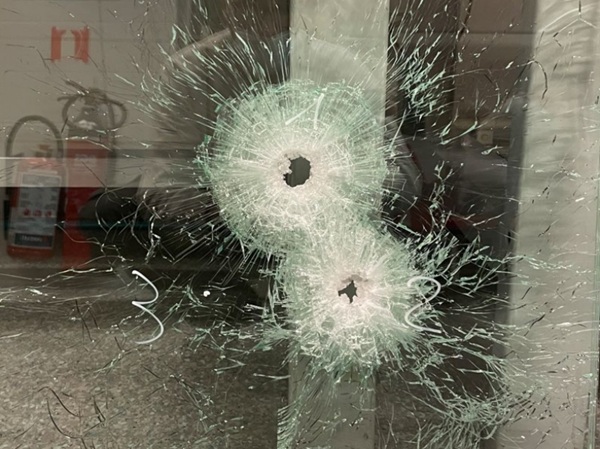
Images of the glass plates in DLx2-1 after testing are presented in Fig. 7a to c, while images of the brass jacket and the steel core are shown in Fig. 7d. Figs. 7a and b depict the front of the first and the second plate, respectively, and Fig. 7c presents a close view of the bullet holes at the front and the back sides. From the images of the first plate, we observe three distinct zones with varying glass damage, denoted 1, 2 and 3 in Fig. 7a. Similar fracture patterns were present in all glass plates after impact. The glass material in zone 3 partly disappeared, and the zone consists of completely pulverized glass.
The bullet hole in the PVB (inside zone 3) was approximately 3-4 mm in diameter, i.e., smaller than the bullet diameter, which suggests that the PVB material contracted after perforation of the bullet. Zone 2 includes radial cracks with circumferential cracks over the entire zone, while zone 1 contains mainly radial cracks. The edge of zone 1 has a circular shape and consists of cracks appearing normal to the radial ones. The diameter of the three zones was measured after each test, and the results are presented in Fig. 8. It appears that the diameter of zone 3 is relatively constant, which agrees with the amount of pulverized glass depicted in Fig. 6a.
Furthermore, the size of zones 1 and 2 seems to decrease with an increasing impact velocity. This observation may be explained by the fact that the global deformation of the target plate is reduced when the impact velocity is increased. Therefore, circumferential cracks occur closer to the bullet hole. Outside the three distinct zones, the glass plate contains more dense cracks. Some of these cracks experienced crack arrest and therefore did not propagate completely towards the plate edges. The number of arrested cracks appeared to decrease with a reduced impact velocity. The cracks also seemed to become less straight when the impact velocity increased. This may also be explained by a more localised loading and less global deformation.
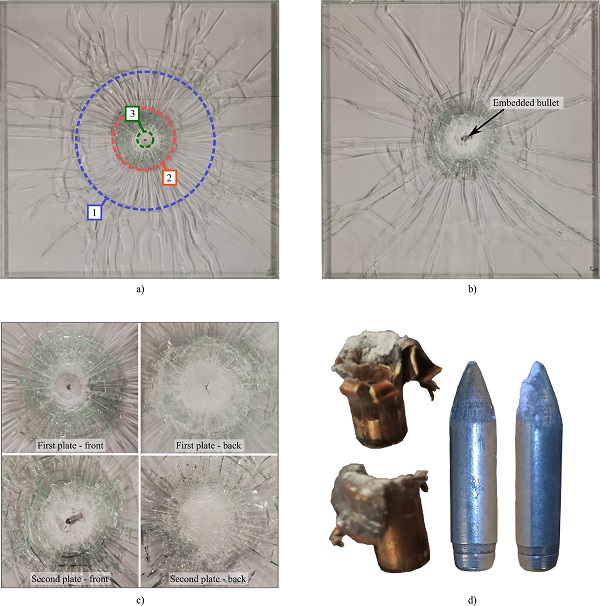
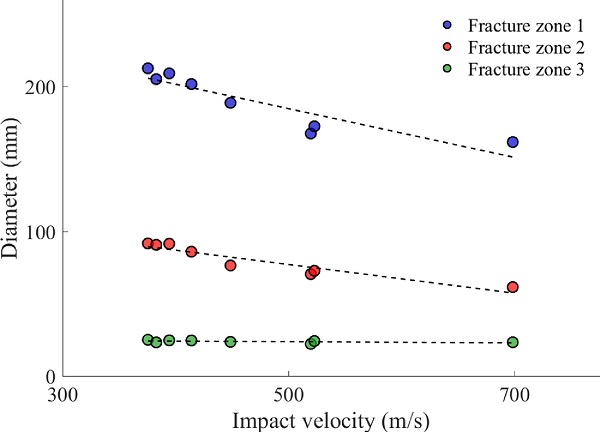
Fig. 7d shows that the brass jacket experienced large plastic deformation and fracture. By comparison, the deformation of the steel core was rather limited and included a small chip close to the tip, some scratches, and a slightly rounded tip.
4. Numerical simulations
4.1. Material model for the bullet
Some of the authors have previously conducted simulations using the same type of 7.62 mm AP bullets as were used in this study [37,40]. Table 2 lists the material parameters that are necessary to model the entire bullet. The hardened steel core was considered as a rigid body with density ρ = 7850 kg/m³, meaning that we do not require any hardening rule or fracture criterion. The constitutive behaviour of the brass jacket and the end cap, as well as the lead cap, were represented by the Johnson-Cook (JC) constitutive model [41]. Thus, the equivalent von Mises stress σeq is represented by
![]()
Here, A is the initial yield stress, B and n control the work hardening, C is the strain-rate sensitivity constant, and m is the thermal softening coefficient. The equivalent plastic strain and strain rate are given as p and p˙, while p˙₀ is a reference strain rate. T is the current temperature, T₀ is the reference temperature, and Tm is the melting temperature of the material. We further assume adiabatic conditions, so that the temperature in each integration point is calculated as

where ρ is the density, Cp is the specific heat capacity, and χ is the Taylor-Quinney coefficient that represents the amount of plastic work converted into heat.
Failure of the lead and brass parts was controlled by the one-parameter Cockcroft-Latham (CL) failure criterion [42]

where Db is the damage variable (ranging from 0 to 1), WC is the CL failure parameter, and σI is the major principal stress defined as
![]()
Here, σ* is the stress triaxiality and θL is the Lode angle. Thus, the CL fracture criterion is as seen a function of both the hydrostatic stress state and the deviatoric stress state. Note that failure occurs in the simulation when Db becomes unity. In addition, to avoid highly deformed elements we introduce a critical time step Δtᵉʳᵒᵈᵉ and a critical deviatoric strain
![]() .
.
If any elements reach Δtᵉʳᵒᵈᵉ or
![]() ,
,
they are eroded from the simulation.
All the material parameters that are listed in Table 2 were originally determined by Børvik et al. [37] for a modified version of the JC model [43], but later converted to the original JC model by Holmen et al. [40]. No further calibration of the bullet materials was conducted in this study.
4.2. Material model for the glass
The glass was modelled as a linear elastic material with a brittle failure criterion. The elastic behaviour is determined by Young's modulus E and Poisson's ratio ν, while fracture initiates when the damage variable Dg defined as

reaches a value of 1. The parameters σs, ts and αs refer to the stress threshold for fracture initiation, the fracture initiation time threshold, and an exponent that controls the fracture initiation time, respectively. H is the Heaviside function, which causes fracture initiation to only occur in tension, and σI is as before the major principal stress. Propagation of an initiated crack will take place if the stress intensity factor KI reaches the critical value, i.e., the fracture toughness KIC. The stress intensity factor KI is calculated as
![]()
where d is the distance from an integration point to a node neighbouring a failed element. The constant α depends on the element type used in the numerical simulation (see Section 4.4). We refer to Osnes et al. [44] for more information about the brittle fracture criterion used herein.
The material parameters presented in Table 1 were used to describe the glass material in the ballistic impact simulations. Further, the tensile strength σs was chosen as 200 MPa, even though the strength of glass is known to be stochastic. The fracture initiation parameters ts and αs were set to 2·10⁻⁷ s and 0.5, respectively [44]. Since a ballistic impact scenario involves high strain rates and a highly localised loading, selecting the tensile strength of the glass is not trivial.
Therefore, a parametric study is presented in Section 4.5 to demonstrate the sensitivity of the numerical results to this parameter. Other parameters are also investigated. It should be noted that the chosen brittle fracture model is not able to capture all local effects (e.g., crushing of glass material) occurring in the glass during ballistic impact. However, the main goal of the numerical simulations was to recreate the global behaviour (e.g., bullet velocity), and it is assumed that the energy absorbed due to local failure mechanisms is small compared to the kinetic energy of the bullet. In addition, failure in tension is likely to dominate the behaviour of the thin glass plates under lateral ballistic impact.
4.3. Material model for the PVB
The PVB material in the simulations was represented by a linear elastic model. Failure of the PVB was further governed by the effective strain εᵉᶠᶠ defined as
![]()
where ɛ is the strain tensor. Failure occurs when the effective strain reaches the effective failure strain
![]()
During ballistic impact, the PVB will be subjected to very high strain rates, resulting in a relatively stiff response. Young's modulus was chosen as the instantaneous modulus at room temperature (E₀=534 MPa), which is found from the experimental work by Hooper et al. [35]. The density was set to ρ = 1100 kg/m³. Poisson's ratio ν was chosen as 0.42, resulting in a nearly incompressible material. The effective failure strain
![]()
was at first set to 1.0. The sensitivity of this parameter is demonstrated in the parametric study presented in Section 4.5. Note that a more comprehensive model for the PVB material used in a laminated glass was described in Osnes et al. [44].
4.4. Finite element models
The numerical simulations were performed using the nonlinear explicit FE code IMPETUS Afea Solver [45], which offers special features such as higher order elements and a 3D node-splitting technique. Higher order elements provide additional robustness and accuracy, which is particularly suitable for simulations involving large deformations. Node splitting enables modelling of fracture and crack propagation by separating elements along the element borders instead of deleting them as in the case of element erosion. Thus, fragmentation can be described without losing mass, momentum, and kinetic energy in the FE model. This is of outmost importance in highly brittle materials such as glass. For more information on higher order elements and the node splitting technique, please see Osnes et al. [44] and Holmen et al. [46].
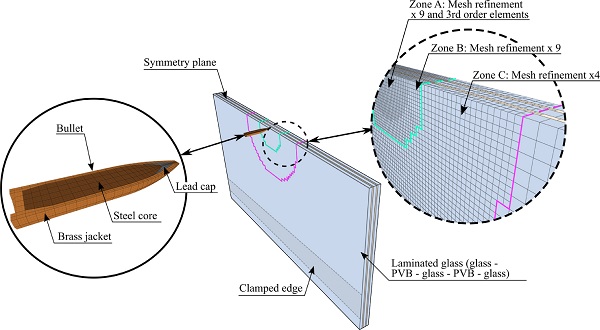
Fig. 9 depicts the first FE model employed in the numerical study, referred to as the base model. We chose to start with DLx1-2, i.e., only one double-laminated glass plate was included in the simulation. In the numerical model, an exact representation of the boundary conditions was deemed unnecessary due to the highly localised loading situation. Instead, the clamping of the glass plates was included by restricting the displacement of the outer nodes in the clamped areas. The simulations were run with one symmetry plane, and thus only one half of the plate and bullet was modelled.
The glass and the PVB parts consisted of approximately 4 mm × 4 mm fully integrated 8-node hexahedral elements with one element over the thickness for each part. Around the impact point, we included three mesh refinement zones. In the outer refinement zone (zone C), the mesh was refined two times in the thickness direction and four times in the in-plane directions, resulting in 1 mm × 1 mm elements. In zones A and B, the mesh was refined three times in the thickness direction and nine times in the in-plane directions, giving 0.4 mm × 0.4 mm elements. The zones A, B and C were made circular with a radius of 20 mm, 30 mm, and 70 mm, respectively. In addition, the elements in zone A were made cubic (i.e., higher order elements with 64 nodes).
The elements used for the bullet parts were all made cubic, and the element sizes are visualized in Fig. 9. Failure of the glass parts was modelled by node splitting, which enabled the representation of free-flying glass fragments. For simplicity and to reduce the computational time, failure of the PVB and the non-rigid bullet parts was modelled by traditional element erosion. The glass and the PVB layers were adhered together by merging nodes in the PVB to the glass surfaces, however, no delamination criterion was included in this study. The friction between all parts was set to μ=0.05 in accordance with previous studies of ballistic impact in metallic targets [47,48]. This is, however, not a universal value that is applicable to all impact situations [46]. Due to the uncertainty associated with the friction coefficient, it is investigated in the parametric study presented in Section 4.5. The mesh sensitivity of the glass and the PVB models is also studied.
4.5. Simulation results
4.5.1. Parametric study
Fig. 10 presents the velocity-time history of the bullet in the base model simulation of DLx1-2. The dashed grey line in the Fig. refers to the measured residual velocity in the experiment. The simulation resulted in a residual velocity of 422.7 m/s, i.e., 2.4 % higher than in the experiment. A parametric study was then performed to demonstrate the model's sensitivity to seven different parameters in the base model: the minimum number of elements over the glass thickness
![]() ,
,
the minimum number of elements over the PVB thickness
![]() ,
,
the fracture stress of the glass
![]()
the PVB failure strain
![]()
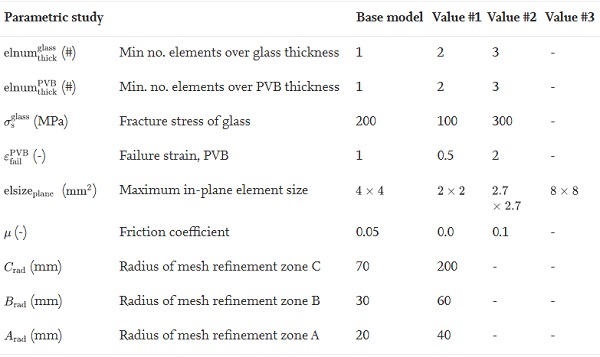
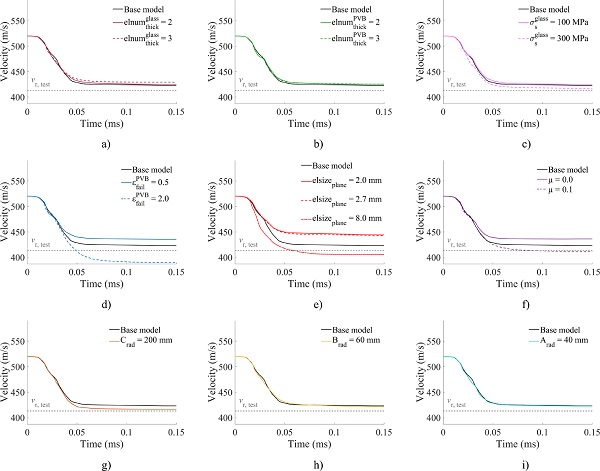
the maximum in-plane element size of the glass and PVB (elsizeₚₗₐₙₑ), the friction coefficient (μ) and the radius of the mesh refinement zones C (Crad), B (Brad) and A (Arad). Table 4 gives an overview of the values used in the parametric study, and Fig. 11, Fig. 12 present results from the simulations. Fig. 11 shows the velocity-time histories for the simulations and compares them to the base model, while Fig. 12 presents the percentage change in residual velocity at t=0.15 ms (vᵣ,ₜ=0.15) relative to the base model.
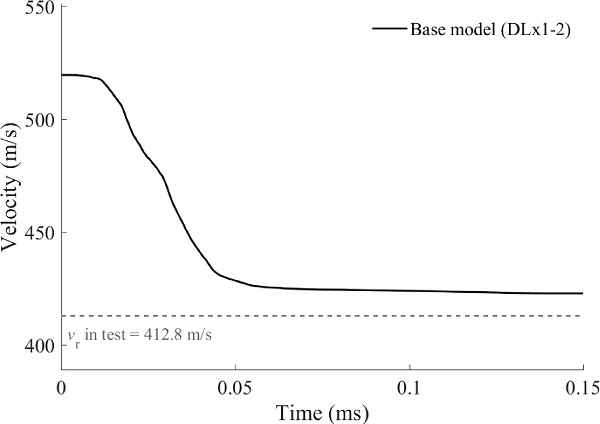
Table 4. Overview of the parametric study for the numerical model.
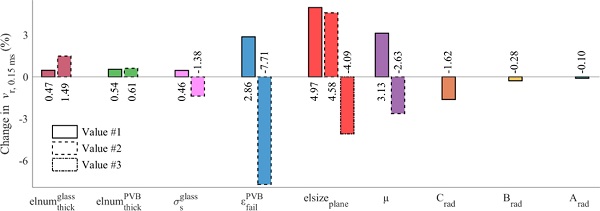
The largest changes in vr,t=0.15 are seen for εfailᴾⱽᴮ, elsizeplane and μ. Since the difference in the velocity-time history for simulations with elsizeplane=2mm×2mm and elsizeplane=2.7mm×2.7mm is minimal, we can assume mesh convergence for the latter. As expected, an increased value for εfailPVB leads to more resistance of the PVB material, which again results in a larger deceleration of the bullet. The same effect was expected for the friction coefficient, as less friction makes the bullet slide easier though the laminated glass plate. A minimal change in vr,t=0.15 is seen for the changes in the number of elements over the thickness
![]()
which suggests that three cubic elements at the impact point are sufficient to capture the global behaviour in the current problem.
We also observe a relatively small change in vr,t=0.15 for σₛᵍˡᵃˢˢ. However, we would expect a more extensive change in the residual velocity with a further increase of σₛᵍˡᵃˢˢ. A relatively small change in vr,t=0.15 is seen when the refinement area C (Crad) covers almost the entire plate, while an insignificant change is found for an increased radius of the mesh refinement zones B and A (Brad and Arad). It should be noted that even though some of the model parameters were considerably changed in the parametric study (see Table 4), the change in bullet residual velocity was in general small, and never more than 8 % compared to the base model. Also, the results from the parametric study indicate that several combinations of different parameters can result in a similar global behaviour.
4.5.2. Numerical predictions
In the final stage of the numerical study, we made two new models for simulating all the tests in the experimental programme: one model for DLx1 and one for DLx2. These models are referred to as the final models. For simulations of DLx2, we included an extra double-laminated glass plate, which was modelled in the exact same way as the first. Compared to the base model, the final models use the converged element size elsizeplane=2.7mm×2.7mm and the largest PVB failure strain, i.e., εfailᴾⱽᴮ=2.0. Except for these changes, the inputs to the final models were identical to the base model.
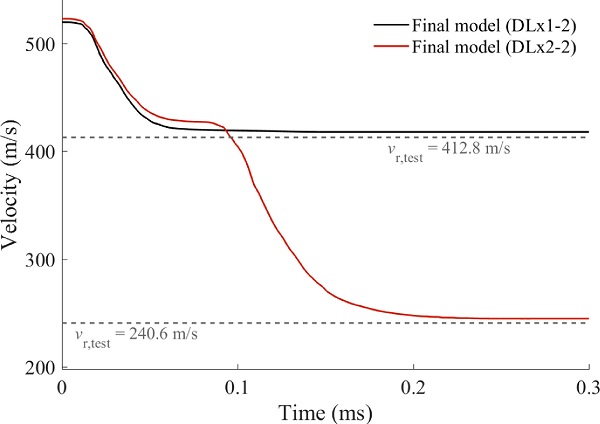
Fig. 13 presents the velocity-time histories for DLx1-2 and DLx2-2 using the final models. The simulation of DLx1-2 resulted in a residual velocity of 418 m/s (1.3 % larger than the experiment), and for the simulation of DLx2-2 the residual velocity was 245.4 m/s (2 % larger than the experiment). Thus, the final models appear to perform slightly better than the base model. Fig. 14 presents the residual velocity of all the numerical and experimental ballistic impact tests, together with the ballistic limit curves from the experiments.
For DLx1, the simulations corresponded extremely well with the experiments, but keep in mind that only two experimental test results are available for this configuration. An additional simulation was run using an impact velocity equal to the estimated ballistic limit velocity from the experiments, i.e., vi=vbl=232.2 m/s. The simulation resulted in embedment of the bullet, as we would expect in an experiment. For DLx2, we also got a very good agreement, although some discrepancy is seen at the highest impact velocity. Just like in the experiment, the simulation of DLx2-1 resulted in embedment of the bullet. However, the DLx2 simulations provided in general a slightly higher resistance than what was observed in the experiments.
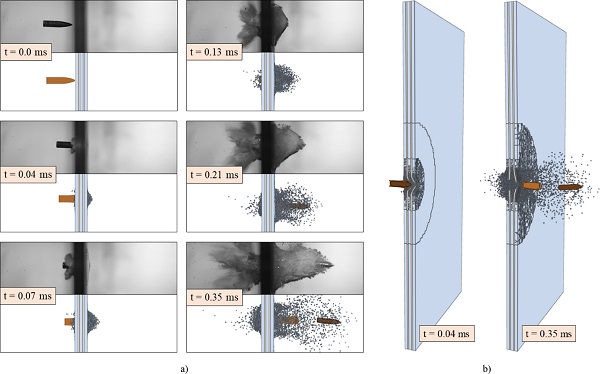
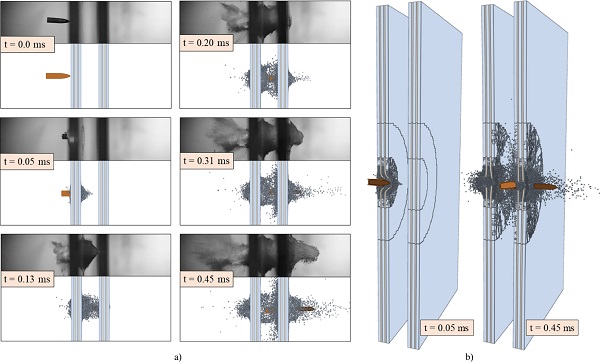
As a final result, Fig. 15, Fig. 16 present images of the perforation process in simulations of DLx1-1 and DLx2-3, respectively. On the left side of the Figs., we compare high-speed camera images from the experiments with corresponding images from the simulations at six different points in time. The right side shows images in which the fracture pattern on the back side of the plate is visible. The trajectory of the steel core seems to follow the experiments very well. In addition, the brass jacket is peeled off during perforation of the first plate, just as in the experiments.
On the other hand, the cracking and pulverization of the glass is not perfectly replicated. The number of fragments is much smaller in the simulations compared to the experiments. This deviation is naturally due to the element sizes used for the glass, and the fact that the node-splitting technique only separate elements at the element borders. Also, cracks do not propagate further than the refinement zone C in the numerical models. In the experiments, most cracks propagated all the way to the plate edges (see Fig. 7). Nevertheless, the area in which pulverization of the glass occurs and the subsequent cloud of pulverized material in the simulations are comparable to the experiments.
For a closer examination of the fracture behaviour of the glass plates in the simulations, we include an additional Fig., which corresponds to Fig. 7c. As in Fig. 7c, Fig. 17 includes a close view of the bullet holes at the front and the back sides of the first and the second plate of DLx2-1 after impact. Note that elements that have detached and travelled outside the glass plates have been removed from the view. Undoubtedly, the fracture pattern in the simulation is highly dependent on the element mesh and is quite different from the physical test. However, there are still similarities. At the front of the first plate, there is an area in which the glass material has been removed (zone 3). In the simulation, this area has a diameter of approximately 25 mm, which is only slightly larger than in the experiment.
Glass material has also been removed on the back side, which extends further than on the front side. Furthermore, there is a smaller amount of removed glass material in the second plate compared to the first plate. We also see that the bullet core is embedded in the second plate in a similar way as in the experiment. For an improved prediction of the fracture pattern, the authors would recommend a refined mesh, in addition to more advanced constitutive models for the glass and the PVB interlayer. Although the local response inevitably influences the global behaviour, the latter is recreated well with the applied models. Thus, if the residual and ballistic limit velocities alone are of interest, the current models are deemed sufficient.


