Article Information
- Digital Object Identifier (DOI): 10.47982/cgc.8.422
- This article is part of the Challenging Glass Conference Proceedings, Volume 8, 2022, Belis, Bos & Louter (Eds.)
- Published by Challenging Glass, on behalf of the author(s), at Stichting OpenAccess Platforms
- This article is licensed under a Creative Commons Attribution 4.0 International License (CC BY 4.0)
- Copyright © 2022 with the author(s)
Authors:
- Tim van Driel - Structural Design & Building Engineering, Faculty of Civil Engineering & Geosciences, TU Delft
- Chris Noteboom - Structural Design & Building Engineering, Faculty of Civil Engineering & Geosciences, TU Delft
- Mauro Overend - Department of Architectural Engineering + Technology, Faculty of Architecture and the Built Environment, TU Delft

Abstract
Free-form façades with bent glass are becoming increasingly popular. As bending glass provides it witha better resistance to out-of-plane loads, it can result in thinner glass. A promising new technique is to cold bend thin glass plates with a stiff structural edge into a hyperbolic paraboloid (hypar), and to subsequently lock the corners to create a self-contained, self-stressed system. In this study, the bending process of specially-fabricated double glazing units (‘panels’) is investigated with a focus on a local instability phenomenon. The hypothesis that this instability is affected by edge stiffness of the plate, is tested by using 30x30 mm GFRP profiles as spacers along the perimeter of the glass.
These were bonded to the glass using Dow 993 silicone adhesive. Four 1.5x1.5 m panels were produced in total, three with 4mm fully toughened (FT) glass, and one with 1.1 mm chemically toughened (CT) glass. The panels were cold bent in a series of laboratory experiments. A numerical model was developed to provide further insight on the mechanical response and to predict the outcome of the experiments.With the sizes of panels used it was not possible to form a hypar. Due to the small thickness of the glass, one the diagonals would always straighten when cold-bent. The 4 mm FT panels failed when the bottom plate fractured at a corner displacement of around 150 mm and a total load of 2.6 kN.
The bottom plate of the CT 1.1 mm was also the first to fracture, at a corner displacement of 120 mm and a total load of 1.4 kN. The top and bottom plates came into contact in the centre of the plate when the corner displacement was around 50 mm for the FT 4 mm panels, and around 30 mm for the CT 1.1 mm panel. The numerical model predicted this contact and the overall behaviour of the panel up to a corner displacement of 60 mm. It was concluded that the glass was too thin to create a hypar with this panel size. The experimental data generated along with the numerical model are useful for futureresearch and developments.
1. Introduction
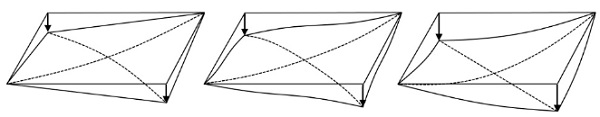
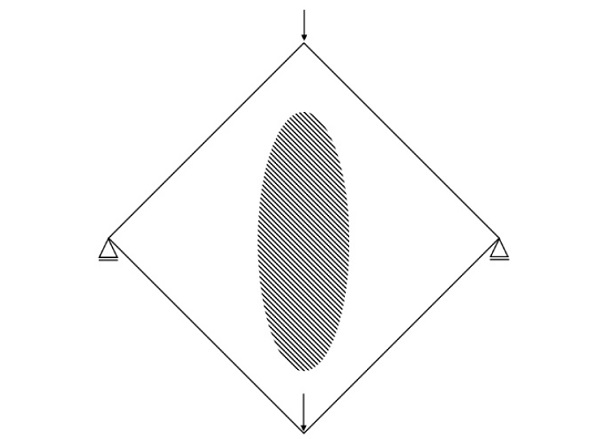
Three-dimensional curvatures, of sufficient magnitude, could make the use of thin glass (<2.1 mm) viable for use in buildings, leading to lighter structures and lower carbon emissions. Many researchers in the last decade have looked at ways of implementing this, and many, such as Galuppi et al (2014) and Datsiou and Overend (2016), consider shaping thin glass sheets into a hyperbolic paraboloid (hypar). However, these studies have found that there is one major difficulty with shaping a thin plate into a hypar. When twisting the plate, a local instability phenomenon occurs in which one of the plate’s diagonals straightens (Figure 1). Eekhout and Staaks (2004) found this instability to occur at a corner displacement of about 16 times the plate’s thickness.
Nehring and Siebert (2018) found that using laminated glass helps achieve a higher curvature with thin glass. To delay the instability further, Galuppi et al (2014) propose a solution involving stiffening of the edges. Through numerical analysis they showed that the instability phenomenon is indeed delayed. To test this experimentally, Young (2019) performed physical experiments on a stiffened glass plate. The results of those experiments seemed promising. Therefore, the study described in the present paper builds on those findings.
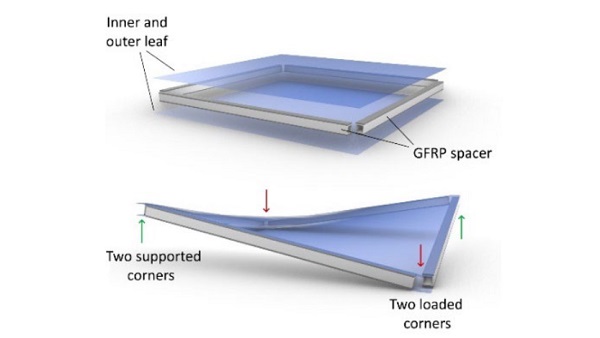
The plates used by Young (2019) were 1x1 m, made of 1.5 mm chemically toughened (CT, Zaccaria et al, 2019)) glass, stiffened with glass fibre reinforced polymer (GFRP) square hollow profiles of 30x30x3 mm. In the present study, the panels were enlarged to 1.5x1.5 m in order to approach the sizes expected in real-world applications. For that same reason, an additional glass plate was added to the unit to effectively produce a thin glass insulated glazing unit (IGU), which could provide acceptable levels of thermal conductivity required in modern buildings (Figure 2).
A gap was left at the corners, so the cavity was not sealed. This way, the individual parts of the edge frame could move independently, and the internal pressure would not affect the shaping process. The same GFRP profiles as those used by Young (2019) were used, as they were lightweight, which was in line with the original goal of creating a lightweight building product. Furthermore, GFRP has good insulating properties and has a good stiffness-to-weight ratio. Two types of glass were used to test different configurations of the panel. Three panels were made with 4 mm fully toughened (FT) glass, and one panel with 1.1 mm CT glass. The original intention was to produce three CT 1.1 mm panels, but the 1.1 mm panes in their untreated state were challenging to manufacture due to their fragility and the amount of CT glass received within the time-frame of this study was sufficient for one CT glass unit to be assembled.
This paper aims to describe the behaviour of this sandwich panel during the cold bending process. A numerical model is first set-up to predict the response of the panel. This is followed by physical experiments are carried out to verify this numerical model.
2. Numerical model
The first step in creating the numerical model was to recreate an experiment done at Cambridge University by Young (2019). In this experiment, a single thin CT glass plate of 1x1 m, reinforced with a GFRP frame, was subjected to twisting at room temperature. For this paper, a finite element model was set up in DIANA FEA to match the results of the experiment. The Mooney-Rivlin material model was used to capture the response of the silicone joint and a mesh study was done to improve the model’s accuracy. The model was successful in representing the global stiffness of the experiment within ± 5%.
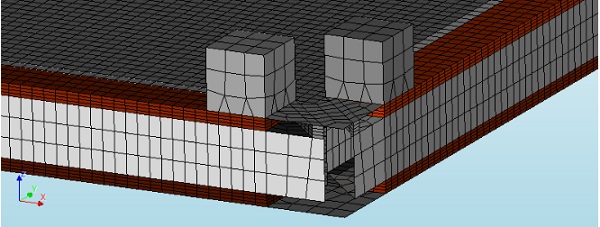
This finite element model was used as a validated basis to model the experiments for the present study. It was first enlarged to 1.5x1.5m, and a second plate was added to the other side of the GFRP frame to create a sandwich pane. The modelling was focussed on the 4 mm panels. A mesh study was performed on this model, focussed on the silicone mesh, which was found to be the most sensitive to changes. This resulted in the mesh seen in Figure 4, with 4 solid brick elements (HX25L) over the height of the silicone joint.
The contact between the glass plates that was observed during the subsequent experiments was eventually incorporated in the numerical model. This was done by inserting linear springs with a nonlinear stiffness between the glass plates. These springs had a stiffness of (practically) 0 until the plates were almost touching. At that point the stiffness increased rapidly to infinity, making sure the plates did not come into contact with each other.
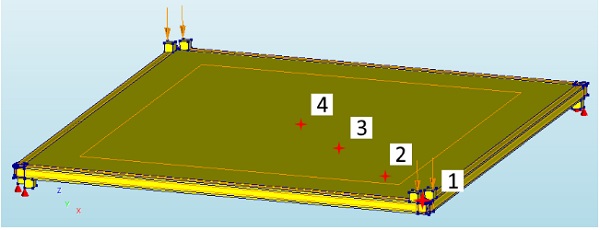
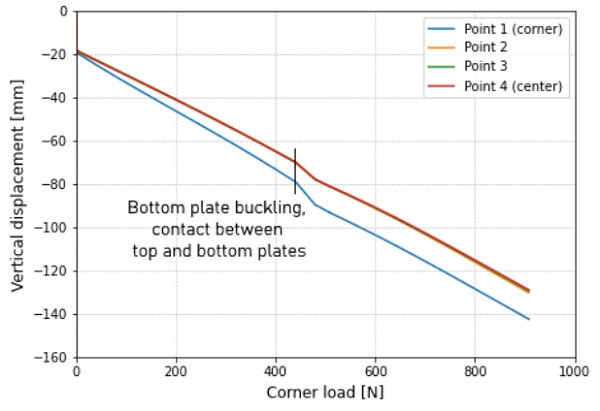
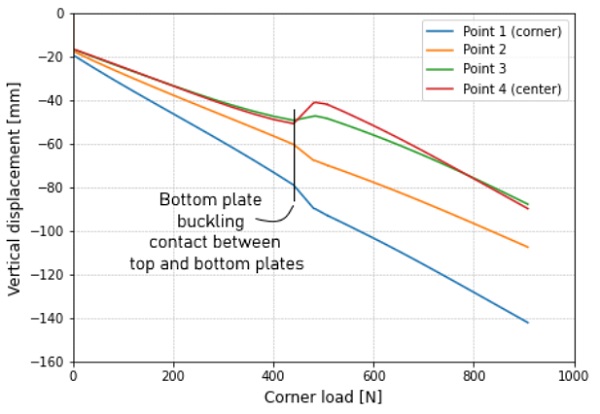
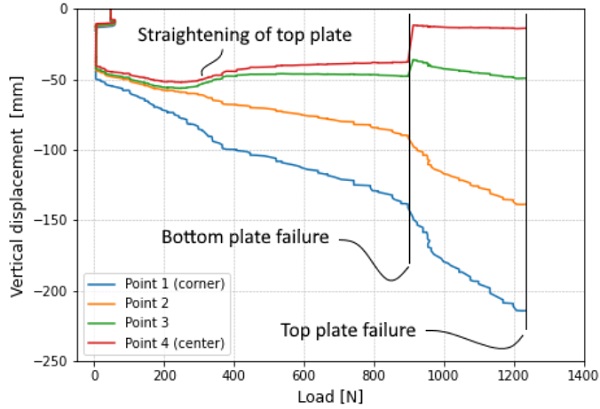
The load-displacement curves of this model can be seen in Figures 5 (top plate) and 6 (bottom plate).The displacement was analysed at 4 points, with point 1 being one of the loaded corners, point 4 the centre of the plate, and points 2 and 3 placed at equidistant intervals between 1 and 4, see Figure 3. The graphs do not start at zero displacement on the vertical axis, because the self-weight of the panel causes an initial vertical displacement. From Figure 6, we can see that at a corner load of around 300 N the rate at which the bottom plate moved downwards decreased. At 450 N, the bottom plate straightened along the supported diagonal, and thus the centre and intermediate points movedupwards, which lead to the plates making contact. The ‘buckled’ configuration of the bottom plate made it less stiff, but the contact between the plates increased the global stiffness, resulting in almost no net change to the global stiffness of the panel.
3. Experiments
3.1. Set-up
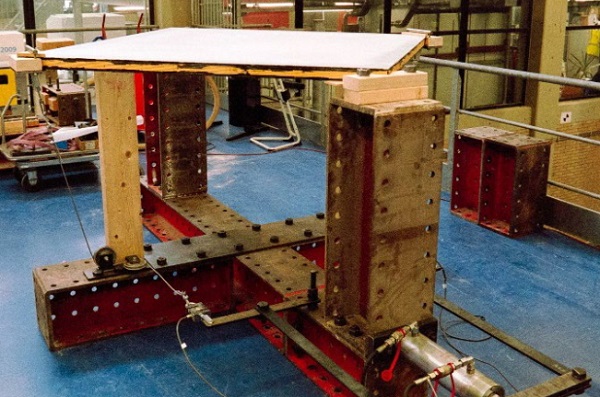
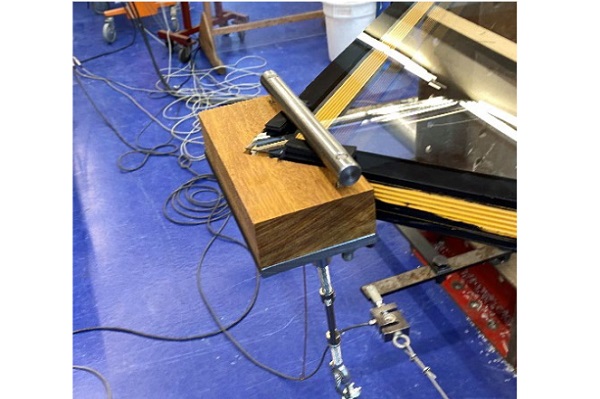
The experimental set-up (Figure 7) was created with the intention of matching the boundary conditions of the numerical model, while keeping the design compact and cost-effective. Therefore, the choice was made to introduce the load to the corners from below the panel. The load was applied by means of a manually actuated hydraulic cylinder, to which two cables – one for each corner – were attached. The cables were redirected through two pulleys and attached to the corners of the panel with the detail shown in Figure 9.
This detail was altered slightly after the first test, to prevent clamping of the corners. Figure 9 shows the adjusted final version. It should be noted that when the panel was in the unloaded horizontal position, the cables were not vertical, but subtended an angle of approximately 12° to the vertical. This was done to prevent the corner details from slipping off when the corners were moved downwards. This means that a small component of the applied load was introduced as an inplane compressive force at the corners. This component decreases as the load – and thus the corner angle – increases.
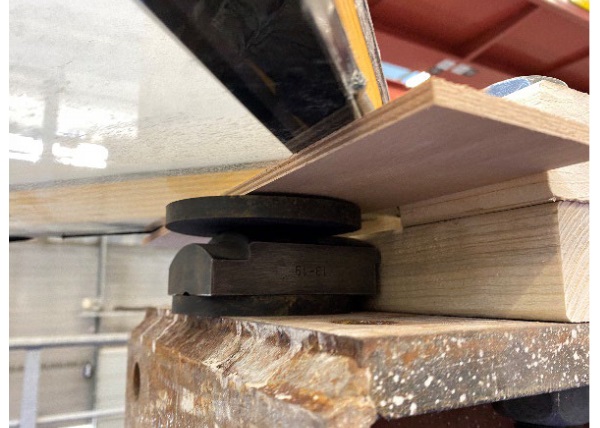
As shown Figure 10, the panel was supported on flexible but stiff supports made of rubber and wood to prevent stress concentrations and scratches.
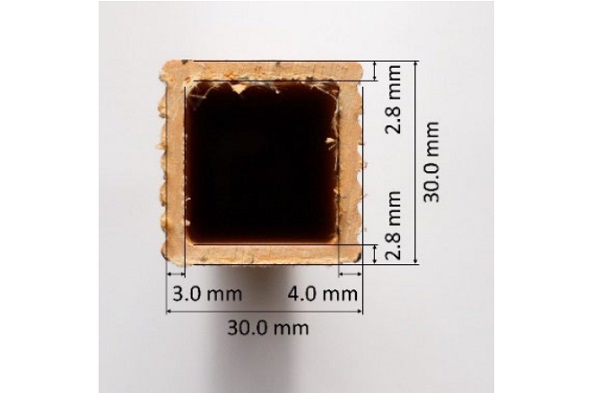
There were three panels constructed with 4 mm FT glass, and one with 1.1 mm CT glass. The frame consisted of GFRP square hollow profiles, the dimensions of which are shown in Figure 8. 6 mm thick spacer tape was used to ensure the correct thickness of the silicone adhesive joint. The glass-GFRP joint was made with Dow 993 Structural Glazing Sealant.
3.2. Measurements
The main quantities used to compare the numerical model to the physical experiments were the applied load and resulting deformations. The load was measured using load cells in the horizontal part of the cables, one on either side. The deformation was measured in several ways.
Linear variable differential transformers (LVDTs), were placed at the loaded corners. The sensors were placed next to the pulleys, and the gauge was attached to the corner detail. With this setup, the displacement of the corners could be measured in the direction of the cable.
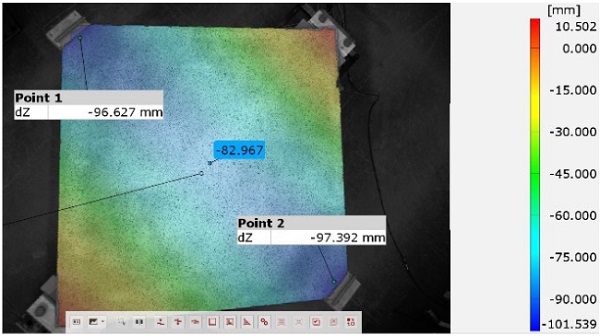
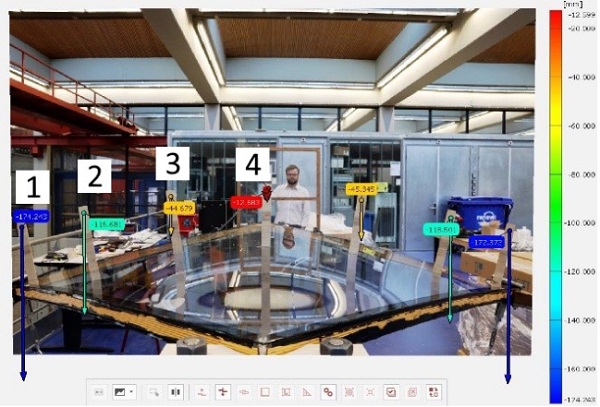
A 3D digital image correlation (DIC) system (GOM Aramis Adjustable camera) was used for one of the tests. With a speckle pattern applied to the top plate, a full 3D displacement field (Figure 11) could be measured with this system. For the other three tests a 2D DIC was used instead. This consisted of a standard DSLR camera for taking images of black-and-white dots placed on the glass. With these images, the displacement could be calculated (Figure 12). The photos were taken at specific time intervals, thereby allowing correlation of the displacements with the measured loads. No stresses and/or strains were measured in the experiments.
3.3 Results
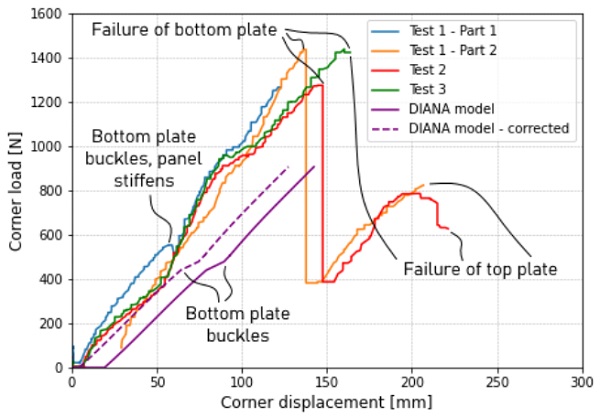
In the assessment of the model, the global stiffness was compared to that of the physical panel. This is shown in Figure 13, where the corner load is plotted against the corner displacement. Tests 1, 2 and 3 were performed with 4 mm panels, and are therefore plotted together. During the first test a sensor had to be removed. To remove the sensor, the load had to be reduced to (almost) its starting point.The load was then applied once more until fracture of the glass. The load-displacement curves in Figure 13 are therefore split into two parts for test 1.
In the load-displacement curves of the 4 mm panels, there are a few distinct phases. First, an almost linear stiffness in the initial loading phase. Then, when the bottom plate straightened (around 60 mm corner displacement in Figure 13), there is a sudden increase in the stiffness of the panel. This stiffness decreased over time while the panel was deforming. Where the top and bottom plates started touching (around 100 mm corner displacement), there was again a sudden increase in the stiffness. The final phase of the graph happens when the bottom plate broke.
In Figure 14, where the displacement of the top plate is plotted against the corner load, we can see similar phases. At 0 N, the panel is taken off the supports and the corners deflect downwards. Then, soon after the loading starts the center points start moving back up, indicating that the plate is straightening. When the bottom plate breaks, the deformations in the top plate show a jump in magnitude.
From this graph, it is evident that the panel never achieves a hypar shape. In a hypar, point 4 (the centre) would have exactly 50% of the displacement of the loaded corner (point 1). This is not the case, as the displacements of the centre points remain close to that of the corners, meaning that the deformation is mainly occurring in the direction of the supported diagonal.
The stiffness of the model is plotted together with the experimental results in Figure 13. The model’s displacement due to self-weight is too high, which is corrected in the graph. The model shows a similar linear first phase, but when the bottom plate of the model straightens, the plates start touching immediately, which differs from the experiments.
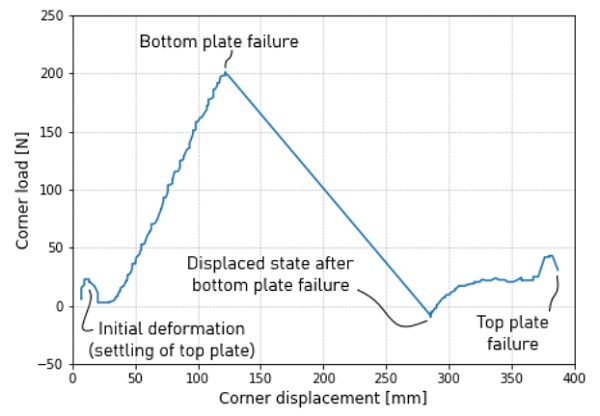
The load-displacement graph of the 1.1 mm panel is shown in Figure 15. There is an initial settling phase, after which the panel’s stiffness is linear. At a corner displacement of 120 mm, the bottom panel broke. This is lower than that of the 4 mm panels, while the 1.1 mm glass itself was a lot more flexible. It is likely that this was caused by the horizontal component of the load, which pushed the bottom plate upwards. Because it was restrained by the top plate, a strong curvature was formed around the corners, which likely lead to the early failure. After the bottom plate had failed, the top plate was still intact, but due to the sudden decrease in global stiffness, the panel dropped about 150 mm and the load decreased to zero. With the stiffer double curved bottom plate gone, the single curved top plate broke required little additional load to break.
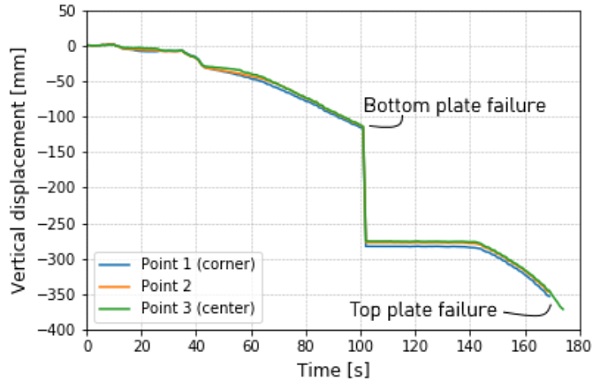
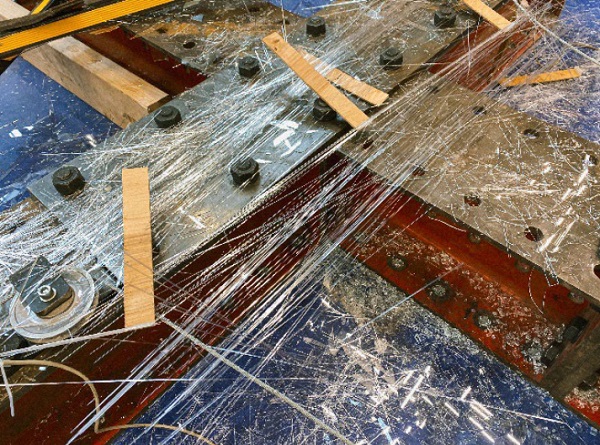
In Figure 16 we see the displacement of three points on the top plate. These points have almost the exact same displacement throughout the entire loading process, meaning the loaded diagonal was fully straight, and thus had no hypar is formed. All the deformation happening in the direction of the supported diagonal also meant that the principal stress occurred orthogonally to the loaded diagonal in the approximate area shown in Figure 17. This led to a remarkable failure pattern in that area (Figure 18), where – instead of the larger shards that are typical for CT glass – long, thin strands were formed in the direction of the loaded diagonal.
3.4. Discussion
As mentioned in the results paragraph, the model was not able to fully predict the behaviour of the physical panel. At the start of the cold bending the displacement due to self-weight was already overestimated. This is likely due to the way the boundary conditions were modelled, as the support and load blocks were modelled inaccurately, as they did not represent the actual positions of the physical supports and loads. The corner detail that was used to introduce the load to the panels may also have been a significant factor in the panel’s behaviour during loading. This was not investigated further due to constraints in time and computation power. The same goes for the modelling of the 1.1 mm panel, which was abandoned to focus on finishing the model of the 4 mm panel.
An issue that came while modelling the contact between the plates is that an implicit solver (i.e. DIANA FEA) was used to model the structural behaviour of the panel. When modelling contact with an implicit solver, the analysis can be numerically instable. To get to a solutions, the load steps around the point of contact should be sufficiently small to ensure convergence. This again requires more time and/or computation power, which may result in the contact of the plates being more accurately modelled.
Due to the panel being positioned horizontally, gravity had an effect on the shaping process. With a single plate cold-bent into a hypar, usually the diagonal between the lower two corners straightens due to gravity. However, in the experiments for this paper, the supported diagonal (i.e. the upper one) was often the one that straightened, likely due to the horizontal load in the cables. This is where the set-up could be improved.
4. Conclusions and recommendations
In this paper, the behaviour of a sandwich panel cold-bent into a hypar was investigated. A numerical model was set up to predict the behaviour, and experiments were used to verify the model.
The finite element model could accurately (within 5%) predict the global stiffness of a single plate with a GFRP frame. When the panel was expanded to a full sandwich panel, the stiffness of the initial loading phase of the 4 mm panel could be predicted with reasonable accuracy (within 15%). After that, the model does not provide a good fit for the experimental data, as the rate of the top plate’s displacement started decreasing first, after which the bottom plate straightened along the supported diagonal. However, the load and displacement at which this happened were approximately 20% too high.
From both the model and the experiments it could be concluded that with the dimensions used (i.e. 1.5x1.5 m), the 4 mm and especially the 1.1 mm were too thin to form a proper hypar. The glass of the 4 mm panels had some semblance to a hypar at the early loading stages, but the 1.1 mm panel was straight throughout the whole experiment. This implies that twisting is not likely to be a viable use for thin glass, but with thicker glass, it may be possible to form a stable hypar with a 1.5x1.5 m sandwich panel. Further modelling and experimentation are required to find the optimal glass thickness to create a stable hypar shape.
The model that was created in this study could form a base for future finite element analysis. Specific efforts could be made to improve the boundary conditions, which has a high potential of increasing the model’s accuracy. In future experiments, horizontal components in the load are to be avoided, which could be achieved by introducing the load from the top of the panel. The ratio of stiffness of the spacer to stiffness of the glass should also be increased. If the same panel size is used with thicker glass, the spacer stiffness should be increased, for example by using aluminium profiles. If the same glass thickness is used, but the panel size is decreased significantly, the same spacers could be used as the ones used in this study.
The contact between the plates occurred at relatively low displacements. The stiffness of the adhesive between the frame and the glass may affect at which point the contact occurs. A follow-up study could investigate the effect of adhesives with various stiffnesses, as well as the effect of stiffer or wider spacers.
Acknowledgements
Special thanks to Erwin ten Brincke (ABT) and Frans van der Meer (TU Delft) for their advice during this research. Thanks are also due you to AGC, Fiberline and Si-X for supplying the materials and infrastructure required for building the panels, and to Louis den Breejen and Giorgos Stamoulis for their assistance during the testing process.
References
Datsiou, K. G., Overend, M.: Behaviour of cold bent glass plates during the shaping process. Engineered Transparency conference (pp. 125-133) (2014).
Galuppi, L., Massimiani, S., Royer-Carfagni, G.: Buckling phenomena in double curved cold-bent glass. International Journal of Non-Linear Mechanics, 64, (pp. 70-84) (2014).
Nehring, G., Siebert, G.: Design concept for cold bent shell structures made of thin glass. ce/papers, 2(5-6), (pp. 43-56)(2014)..
Young, R.: Freeform buildings: The design of a cold bent glass panel system. (unpublished thesis) University of Cambridge(2019).
Zaccaria, M., Gillon, X: Scaling Thin Glass Use to the Architectural World. Świat Szkła, 24 (2019)..
Eekhout, M., Staaks, D.: Cold deformation of glass.In: Proceedings of International Symposium on the application of Architectural Glass (ISAAG) (2004).