Source: Glass Structures & Engineering
Author: Vlad-Alexandru Silvestru
DOI: https://doi.org/10.1007/s40940-025-00308-0
Abstract
Reuse and remanufacturing of glass products are, beside recycling, feasible circular economy solutions for flat glass. Currently, research addresses mostly the separation of materials in insulating glass units and laminated glass, as well as the condition assessment of end-of-life monolithic annealed glass panels. Still, end-of-life thermally tempered glass panels will also increasingly be available in the future. Such glass exhibits a residual stress state, which is advantageous from a structural point of view but impedes mechanical processing like cutting. This contribution focuses on applying thermal stress relief treatment to allow mechanical processing of recovered end-of-life thermally tempered glass. A furnace that allows temperature control was used to heat monolithic thermally tempered glass panels with different temperature curves. New glass panels were used to identify the most suitable temperature curve due to their easier availability in uniform size. End-of-life glass panels will be used later to assess the transferability of the results to aged glass. Thickness and residual stress measurements were conducted both before and after thermal treatment, allowing the evaluation of the degree of stress relief and eventual undesired geometry modifications for the different applied temperature curves. Finally, most samples were tested in four-point bending to analyse the tensile bending strength and the fracture pattern, while part of the samples was subjected to cutting processes. The results of the experimental study show that thermal stress relief treatment can be applied successfully to allow mechanical processing of previously thermally tempered glass panels, and provide the identified suitable temperature curve for achieving a full relief of existing residual stresses.
1 Introduction
Previous studies conducted by Carroll et al. (2021) and Hartwell and Overend (2019) indicated that the façade can contribute up to 25% to the total initial embodied carbon in the production and construction stages of buildings. Moreover, according to Dodd and Vinson (2022), the material glass can be associated with 26–60% of the embodied carbon footprint of a façade, depending on the façade system and the window-to-wall ratio. Enabling circular economy approaches for flat glass can contribute to reducing carbon dioxide emissions and the waste generated, as well as the raw materials consumed by the building sector, and especially by the façade industry. Considering the R-list concept as described in Potting et al. (2017) and Kirchherr et al. (2017), such approaches include (i) smarter product use and manufacture (refuse, rethink, reduce), (ii) extended lifespan of products and their parts (reuse, repair, refurbish, remanufacture, repurpose), and (iii) useful application of materials (recycle, recover). The potential for and the challenges of recycling glass have been addressed in the last few years by research and industry, and efforts are being undertaken to push this approach further (DeBrincat and Babic 2018; Hartwell et al. 2023; Rose et al. 2019). Recycling, however, only allows a low degree of circularity compared to approaches aiming at extending the lifespan of products and their parts. Whether the objective is recycling the glass, or reusing and remanufacturing glazing elements or their components, an important step is to enable reversing the supply chain, as described by Babic et al. (2021), as well as reversing certain glass production and glass processing steps.
In the last couple of years, increasing research and industry efforts were pointed towards reusing and remanufacturing aged glass and glazing products from facades that reached their end-of-life. Examples from industry include the insulating glass units produced by GSF Glasgroep in the Netherlands with glass panels from old insulating glass units (GSF Glasgroep 2024), the IG2Pieces machine for disassembling old insulating glass units developed by Hegla GmbH & Co. KG (Schoisswohl and Zaccaria 2023), or the RE-WIN association in Switzerland, which collects from facades that are to be demolished the old windows that are still in good condition, and sends them to Ukraine for reuse (RE-WIN 2025). In terms of research, several groups assessed the separability of old insulating glass units as well as the condition of the aged glass in terms of strength (Cupać et al. 2024; Rota et al. 2023; Teich et al. 2024). However, all research related to reuse or remanufacturing of glass focused on annealed glass. This is reasonable since a significant amount of the aged glass from windows that are reaching their end-of-life and are removed from facades are made from annealed glass. Moreover, for thermally tempered glass, mechanical processing like cutting in smaller pieces—as it would be mostly needed for remanufacturing—is considered not possible. Nevertheless, in the past decades more and more thermally tempered glass panels were used in larger window and façade elements. These elements will sooner or later also reach their end-of-life and their glass panels will be potentially available for reuse and remanufacturing.
This paper presents results from experimental investigations on using thermal treatment for stress relief in thermally tempered glass with the aim for allowing its mechanical processing at the end-of-life, and hereby its remanufacturing. Temperature plays a significant role in the production of flat glass and its further processing to different products. Soda lime silicate glass, the glass mostly used in architectural applications, has an annealing point of approximately 550 °C, a glass transition temperature of around 570 °C and a softening point of around 725 °C (Schneider et al. 2016b). In thermal tempering, annealed float glass is heated to about 100 °C above its glass transition temperature, reaching a viscoelastic state, and then rapidly quenched from both sides. This process creates a structurally advantageous residual stress distribution, which at the same time impedes subsequent mechanical processing as cutting or drilling. Depending on the quenching speed, fully tempered glass according to (EN 12150-1 2019) or heat strengthened glass according to (EN 1863-1 2011) are obtained.
To the best of the authors knowledge, there are only few previous studies in which thermal treatment was investigated for relief of residual stresses. Schneider et al. (2016a) analysed the stress relaxation in tempered glass caused by heat soak testing, showing that there is a minor reduction of the residual stress of around 5–10% after heat soaking at a typical temperature of around 290 °C. However, there exist several studies in which thermal treatment was applied for healing damages on glass surfaces (Schwind et al. 2020; Zaccaria and Overend 2016). Temperatures of up to around 550 °C were applied in these studies, which corresponds approximately to the annealing point of soda lime silicate glass. Parallel to the investigations presented in this paper, Möckel et al. (2025) analysed the stress relaxation in thermally tempered pre-stressed glass on a limited number of samples. Temperatures of 290 °C, 400 °C, and 525 °C were considered, and reductions of the compressive residual stress values were noticed, averaging 4%, 24%, and 95%, respectively.
2 Materials and methods
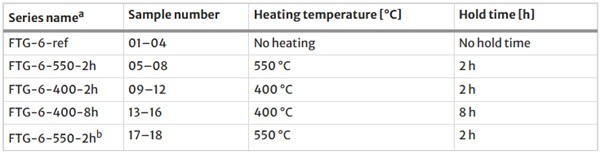
For the experimental investigations discussed in this paper, fully tempered soda lime silicate glass was used, as regulated in (EN 12150-1 2019). The panels had a nominal thickness of 6 mm, and nominal dimensions in length and width of 1100 mm and 360 mm, respectively. The length and width dimensions of the glass panels were chosen in agreement with the suggested dimensions in (EN 1288-3 2000) for determining the bending strength of glass based on four-point bending tests. The glass panel edges had a polished finishing. A total of eighteen glass panels were included in the investigations for assessing the influence of thermal treatment with different temperature curves on the residual stresses, the mechanical properties and the fracture patterns. The sample numbers of the different glass panels as well as the different applied thermal treatment conditions are shown in Table 1. A series without thermal treatment and three series with different thermal treatment conditions were analysed, each series consisting of four samples. Additionally, two samples (17 and 18) were thermally treated under the most suitable identified conditions, and subjected to mechanical processing operations (i.e., cutting).
Table 1 Overview of the different investigated glass panel series depending on the applied thermal treatment conditions - Full size table
For the thermal treatment conditions, the temperature of 550 °C was chosen to be in the range of the annealing point of soda lime silica glass. The lower temperature of 400 °C was chosen to investigate if a relief of residual stresses is also possible with lower temperatures. It was chosen to be situated between 550 and 300 °C, assuming that at 300 °C no or only a very limited relief of residual stresses would occur, since this temperature (~ 290 °C) is used in the heat soak test.
The following subsections describe the applied methods, including conducted thickness, width and residual stress measurements, performed thermal treatment, carried out four-point bending tests, and evaluated mechanical processing of the thermally tempered glass after stress relief.
2.1 Thickness, width and residual stress measurements
Thickness measurements and residual stress measurements were conducted both before and after subjecting the samples to thermal treatment. The thickness was measured with a digital touching calliper Mitutoyo Absolute AOS Digimatic (Model No. CD-15APX). Initially, also the measuring device GlassBuddy® Plus from Bohle AG was used; however, its accuracy was deemed insufficient for the purpose of the aimed strength calculations. The width was measured with a larger digital touching calliper Mitutoyo Absolute Digimatic (Model No. CD-60C) only after thermal treatment, since this dimension was necessary for the calculation of the bending strength. Both instruments are shown in Fig. 1a.
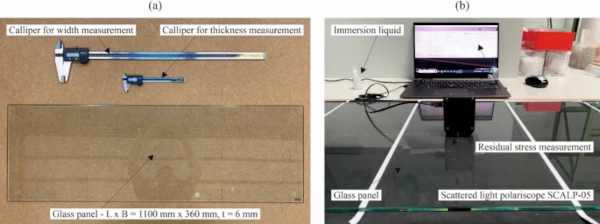
The residual stresses in the glass panels before and after thermal treatment were measured with a scattered light polariscope SCALP-05. This stress measurement device is depicted in Fig. 1b. For all specimens, the residual stress measurements were carried out both on the air side and on the tin side of the glass panels over a thickness of 5 mm. This was done to check whether the stress relief was uniform. One should know that the glass panels were positioned in the furnace with the air side upwards (see also Sect. 2.2 for details), while during the performed four-point bending tests, the air side was the one subjected to tensile stresses (see also Sect. 2.3 for details).
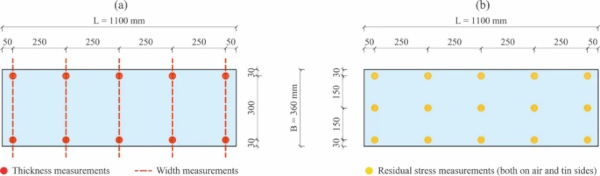
The thickness of the glass panels was measured at ten different positions near the longitudinal edges, while their width was measured at five different positions. The location of these positions is shown in Fig. 2a. The residual stresses over the thickness of the glass panels were measured at fifteen different positions for each sample, once from the air side and once from the tin side. The location of these positions is shown in Fig. 2b. For the first two investigated samples, residual stress measurements in both the longitudinal direction of the glass panels (x-direction) and the transversal direction of the glass panels (y-direction) were conducted at each of the fifteen positions. However, since no significant differences were noticed between the measurements in the two directions, only one measurement in the longitudinal direction was performed for the other samples at each of the fifteen positions. For the measurements with the SCALP-05 device the following parameters were used: a photoelastic constant C = 2.72 TPa⁻¹, a refraction index RI = 1.52, a local regression fit method with weighed polynomial splines, a fit closeness of 0.5, a polynomial order of 3, and normal background.
2.2 Thermal treatment
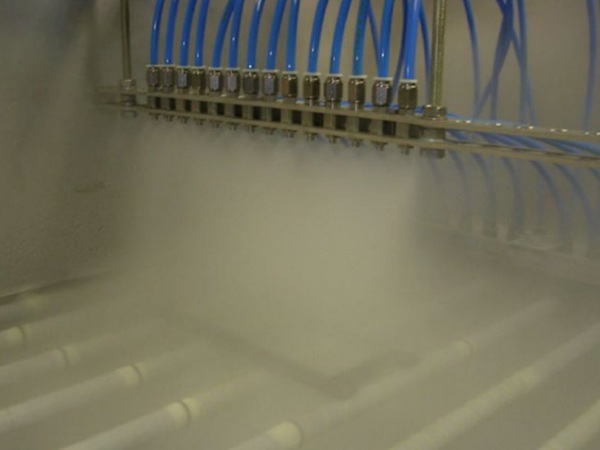
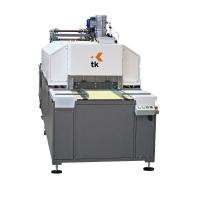
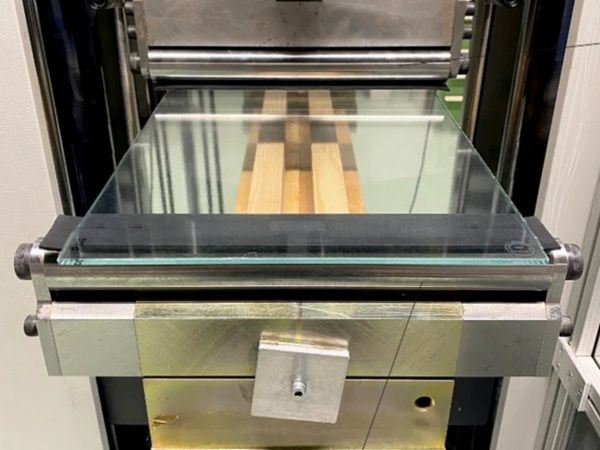
The thermal treatment of the fully tempered glass panels was conducted with a Nabertherm GF600 furnace, generally used for fusing glass as shown for example in Silvestru et al. (2023). This furnace can be used for temperatures up to 950 °C, and can host glass panels with dimensions of up to 1.0 m × 2.0 m. The furnace has heating elements only on the top side of its chamber and the thermocouple for temperature control is positioned in direct vicinity to these heating elements. Despite there are more suitable furnaces for thermal treatment of glass panels available on the market, this furnace, to which the author had access, was considered appropriate for assessing the feasibility of applying thermal treatment for stress relief in thermally tempered glass. The furnace could accommodate two glass samples at a time. The furnace with two glass samples installed for thermal treatment is illustrated in Fig. 3a. For the heating step, the nominal temperature in the furnace was increased with a speed of 10 °C per minute. For the cooling step, the furnace was left to cool down overnight, since a possibility for faster controlled cooling was not available for this study.
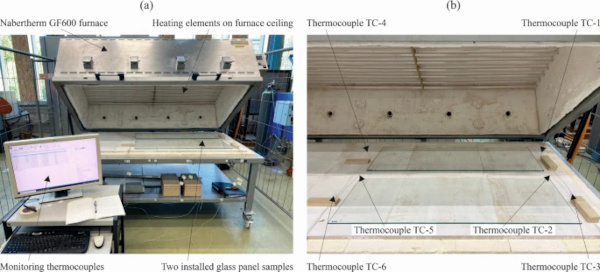
The glass panels were positioned in the furnace on the table, directly on the ceramic plates, being in contact with the plates all over their bottom surface. The glass panels had their tin surface oriented towards the ceramic plates and the air surface oriented towards the furnace chamber. The tin and air sides were determined with the measuring device TinCheck® from Bohle AG. A pilot test was conducted previously at 550 °C with one glass sample supported over its entire surface on the ceramic plates and one glass sample supported on five local ceramic rollers, while the rest of its bottom surface was surrounded by air. This pilot test showed that the two different support conditions had no influence on geometry changes of the glass samples or on the achieved stress relief. Because the furnace only had heating elements near its ceiling and the thermocouple for temperature control was positioned near the furnace ceiling, six additional thermocouples of type k were installed near the glass samples for monitoring the temperature development. Three thermocouples were positioned at each of the two ends of the glass samples in longitudinal direction, one clamped between the ceramic plates (TC-2 and TC-5) and the other two measuring the air temperature directly near the glass samples (TC-1 and TC-3 at one end, and TC-4 and TC-6 at the other). The location of these six thermocouples is shown in Fig. 3b.
In addition to the temperature development, the energy consumption was measured for the different applied thermal treatment conditions. A DIN rail mountable three phase energy meter Shelly Pro 3EM working through a wireless local area network was used for conducting the measurements and the Shelly Smart Control app (Shelly 2025) was used for reading and downloading the measurements. These measurements were done for monitoring purposes and to allow a comparison in terms of energy consumption between the different applied thermal treatment conditions.
2.3 Four-point bending tests
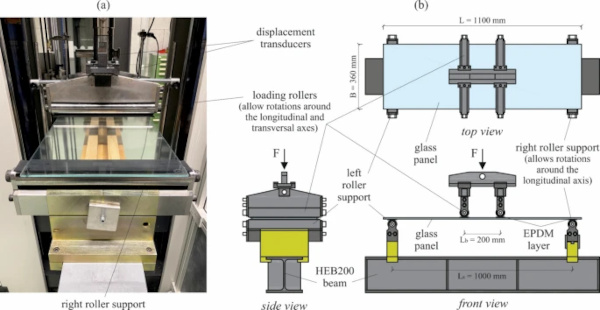
A total of sixteen glass panels (samples 01 to 16 from Table 1) were subjected to four-point bending tests to determine the structural performance and the fracture pattern of the samples that underwent thermal treatment for stress relief (samples 05 to 16) and to compare these results to those obtained for fully tempered glass without thermal treatment for stress relief (samples 01 to 04). The geometry of the test samples and the test setup were chosen according to (EN 1288-3 2000). An image of the test setup with its main components is shown in Fig. 4a, while a schematic illustration of the setup geometry with its main dimensions and a built-in glass panel is provided in Fig. 4b. The number of four samples per test series was not expected to allow a precise statistical evaluation of the bending strength, but rather to show the feasibility of applying thermal treatment for stress relief and to allow a comparison between the degree of stress relief achievable with the different applied thermal treatment conditions.
The glass panels with dimensions of 1100 mm × 360 mm and a nominal thickness of 6 mm were tested with the air side subjected to tension. However, similar results would be expected if the tin side would be subjected to tension based on the conducted residual stress measurements. Prior to testing, a 0.03 mm-thin polypropylene (PP) self-adhesive film was applied to the top side of each panel (the side under compression during testing) to facilitate the removal of broken samples and improve the assessment of failure patterns after the test.
The tests were conducted under load control using a Zwick universal testing machine. The load was applied at a rate of 20.5 N/s, which corresponds to a stress rate of 2 MPa/s for the given cross-section of the panels, as outlined in (EN 1288-3 2000). The glass panels were simply supported on rollers at both ends, with the distance between the supports being 1000 mm. The load was applied using rollers positioned 200 mm apart. To prevent stress concentrations, soft layers of 3 mm-thick ethylene-propylene-diene-monomer (EPDM) were placed between all steel rollers and the glass panels.
In addition to the applied force and the traverse displacement, the vertical deflection of the panels at midspan was measured near each of the two longitudinally bent edges using linear variable differential transformers (LVDTs), as depicted in Fig. 4a. Along with evaluating fracture patterns, the bending strength, σbB, was determined for the different samples using Eq. (1), in accordance with (EN 1288-3 2000).
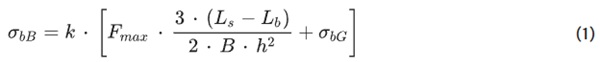
The factor k = 1.0 was applied, as both samples with fractures initiating on the surface and those with fractures starting at the edge were considered. Fmax represents the maximum force recorded by the load cell, while B and h denote the measured average width and thickness of the samples, respectively. The equivalent bending strength due to the self-weight of the glass panels, σbG, was calculated using Eq. (2). The density of glass, ρ = 2500 kg/m³, and the gravitational acceleration, g = 9.81 m/s², were used.

2.4 Mechanical processing of thermally tempered glass after stress relief
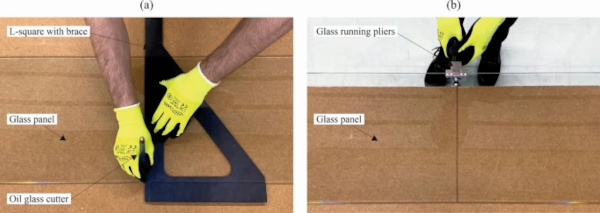
The main purpose for applying thermal treatment for stress relief in thermally tempered glass is to enable its mechanical processing. Therefore, two additional glass panels (samples 17 and 18 in Table 1) were thermally treated with the conditions identified as most promising for stress relief (at 550 °C for 2 h). These samples were subsequently used for testing mechanical processing operations on them. The glass panels were manually cut into smaller pieces by first scoring their surface with an oil glass cutter (see Fig. 5a) and then breaking them along the scoring line with glass running pliers (see Fig. 5b). The manual mechanical processing steps were conducted to illustrate that thermally tempered glass can be mechanically processed after relief of the residual stresses.
3 Results and discussion
In this section the results obtained in the different investigation steps with the applied methods are presented and discussed. First, the different thermal treatment processes are evaluated, and then their influence on the residual stress distribution, the mechanical properties of the treated glass panels subjected to four-point bending, and the resulting fracture patterns are analysed. Finally, the conducted cutting processes are discussed.
3.1 Temperature monitoring results and electricity consumption
The temperature was monitored with six additional thermocouples of type k for each of the three investigated thermal treatment conditions. This was done since the furnace had heating elements only near its ceiling and the in-built thermocouple for controlling the temperature was positioned near these heating elements. For each of the three investigated thermal treatment conditions, two heating processes were conducted, since only two samples fitted in the furnace at once. The temperatures recorded for the similar heating processes were consistent. The three diagrams in Fig. 6 show the nominal temperature curves applied for the different thermal treatment conditions along with the temperatures recorded by the six thermocouples for one of the two similar heating processes. The nominal temperature curves only include the heating and temperature holding steps, since the cooling was not performed at a controlled rate, but by letting the furnace cool down overnight.
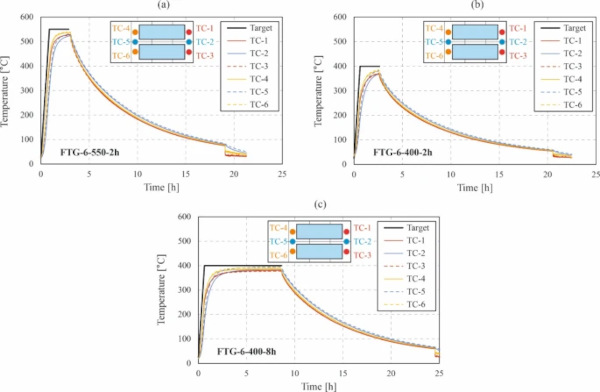
For all three thermal treatment conditions and all the thermocouples positioned near the glass panels, it can be noticed that the heating rate was slightly slower than the nominal rate and that the target temperature was not reached. The maximum reached temperatures for the series FTG-6-550-2h, FTG-6-400-2h and FTG-6-400-8h were 539 °C, 386 °C and 394 °C, respectively. By comparing the temperatures measured with the two thermocouples embedded between the ceramic plates (TC-2 and TC-5) with those measured with the other four thermocouples positioned in the air near the top glass surfaces (TC-1, TC-3, TC-4 and TC-6), it could be observed that the ceramic plates heated up and cooled down slightly slower than the air. This indicated a potential difference in heating and cooling of the bottom and top surfaces of the glass panels. Moreover, a comparison between the thermocouples at the two ends of the glass panels indicated that slightly lower maximum temperatures were reached at the right end (e.g., a maximum value of 529 °C was measured with TC-1 to TC-3 for FTG-6-550-2h) compared to the left one (e.g., a maximum value of 539 °C was measured with TC-4 to TC-6 for FTG-6-550-2h). These observed small discrepancies in temperature development within the furnace might have had an influence on the obtained residual stress relief for the samples treated at 400 °C. However, based on the results shown in Sect. 3.2, the influence on the obtained residual stress relief for the samples treated at 550 °C seemed negligible.
For the cooling step, the furnace was left closed overnight to cool down. This resulted in a non-linear temperature curve recorded with the thermocouples, as illustrated by the diagrams in Fig. 6. The furnace was opened the next morning for all series when the measured temperatures had values between 50 and 80 °C.
Despite the conducted investigations were experimental and the available furnace was not the most suitable one for these investigations and the size of the panels, the energy consumption was measured to allow a relative comparison between the different applied thermal treatment conditions. For the thermal treatment processes at 550 °C for 2 h, at 400 °C for 2 h, and at 400 °C for 8 h, the measured energy consumptions were 34.82 kWh, 22.03 kWh, and 43.03 kWh, respectively. Besides confirming that a higher heating temperature leads to a higher energy consumption, these numbers also show that holding a lower temperature constant for a longer duration might lead to a higher energy consumption as well.
3.2 Thickness and residual stress measurement results
Both the thickness of the glass panels and their residual stresses were measured before and after conducting the thermal treatment processes. Average values along with the coefficients of variations are provided in Table 2 for the thickness values as well as for the maximum compressive and tensile residual stresses measured before and after treatment for the four investigated test series. For the thickness values, ten measurement values per sample along the longitudinal edges were used to calculate the averages. For the residual stress values, the averages were calculated from a total of thirty measurements per sample, fifteen on the tin side and fifteen on the air side. In case of the thickness values, it can be noticed that none of the applied thermal treatment conditions led to modifications.
Table 2 Measured thickness and residual stress values for the different series provided as average values and coefficients of variation (as percentage in parentheses) - Full size table
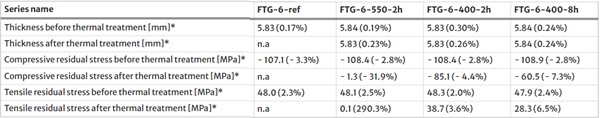
In case of the residual stresses, it can be observed that all samples exhibited a similar degree of tempering before conducting the thermal treatment for stress relief. The compressive residual stresses near the surfaces averaged around 108 MPa, while the tensile residual stresses in the core averaged around 48 MPa. This is also visible in the box plots from Fig. 7, which illustrate graphically the size and the variation of the compressive (Fig. 7a) and tensile (Fig. 7b) residual stresses. After subjecting the samples to the different thermal treatment conditions in the furnace, it can be noticed that for the series FTG-6-550-2h a full relief of the residual stresses was achieved. This was not the case for the other two series with different thermal treatment conditions—i.e., FTG-6–400-2h and FTG-6-400-8h, respectively. In these cases, only a partial relief of the residual stresses was achieved. In average, the compressive residual stresses were reduced by around 21% after holding samples at 400 °C for 2 h and by around 44% after holding samples at the same temperature for 8 h.
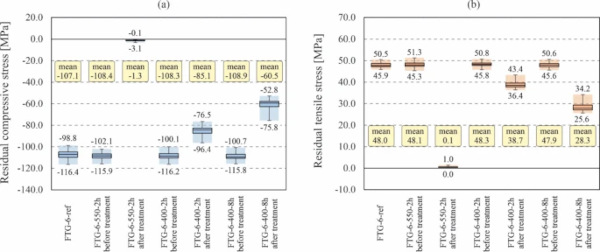
In addition, both from the coefficients of variation in Table 2 and from the box plots in Fig. 7 it can be noticed that the residual stresses measured after thermal treatment at 400 °C varied more than those measured before thermal treatment. The main reason for this is probably related to the discrepancies in temperature reached in the furnace during the thermal treatment, as shown in Sect. 3.1. Before thermal treatment, the highest absolute residual stress values were measured in the glass panel corners, while the lowest absolute values occurred in the middle of the glass panels. After thermal treatment at 400 °C, slightly lower absolute residual stress values were measured along the short edge at which slightly higher temperatures were reached in the furnace during thermal treatment (left edge in Figs. 3 and 6).
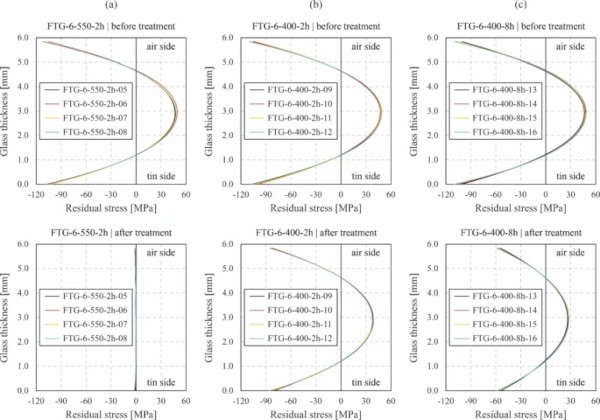
For better understanding the residual stress distribution in the glass panels over their thickness before and after thermal treatment, these distributions are plotted in Fig. 8 for the middle points of the different samples of the series FTG-6-550-2h (Fig. 8a), FTG-6-400-2h (Fig. 8b), and FTG-6-400-8h (Fig. 8c), respectively. By comparing the top diagrams (before thermal treatment) with the bottom ones (after thermal treatment), it can be noticed that after treatment at a temperature of 550 °C, the parabolic distribution was not recognisable anymore, while after treatment at a temperature of 400 °C, the distribution of the residual stresses still showed a parabolic shape, however with lower amplitude. The size of this amplitude after thermal treatment at 400 °C depended on the duration of holding the temperature constant, and decreased with longer duration.
The residual stresses measured after treatment under temperatures of 400 °C and 550 °C with a hold time of 2 h are in average slightly lower than those observed by Möckel et al. (2025) for the temperatures of 400 °C and 525 °C with a hold time of 30 min. This also indicates that the longer hold times lead to a higher degree of residual stress relief. This was confirmed as well by the two series with treatment under a temperature of 400 °C and hold times of 2 h and 8 h, respectively.
3.3 Four-point bending test results: mechanical properties
From the conducted four-point bending tests, the bending strength and the midspan deflections were first evaluated for the different test series. Figure 9 shows these results in the form of box plots, including the mean values and the minimum and maximum values (shown by the whiskers). The bending strength was calculated according to Eq. (1). The midspan deflection was determined as an average of the displacements measured with the two LVDTs visible in Fig. 4a. From the bending strength values in Fig. 9a, it is visible that the strength of the panels subjected to thermal treatment at 550 °C for 2 h is in average more than 50% lower than that of the reference panels for which no thermal treatment was applied. The panels for which a thermal treatment at 400 °C was applied for 2 h and for 8 h, respectively, show bending strength values between those reached by the reference panels and those treated at 550 °C.
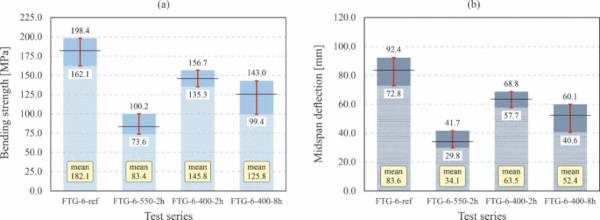
The reached strength values are in good agreement with the measured residual stress values after applying the different thermal treatment conditions. The treatment at 550 °C for 2 h resulted in a reduction of the residual stresses by ~ 99% and led to a reduction of the determined bending strength by 54% (in average 83.4 MPa compared to 182.1 MPa). When treating the glass panels at 400 °C, a reduction of the residual stresses by 21% was reached after 2 h and by 44% after 8 h, respectively. This translated into a reduction of the bending strength compared to the untreated glass samples by 20% after 2 h (in average 145.8 MPa compared to 182.1 MPa) and by 31% after 8 h (in average 125.8 MPa compared to 182.1 MPa).
For the measured midspan deflection values similar observations were made. The panels treated at 550 °C for 2 h showed deflections smaller than half of those reached by the reference panels. The panels of the two series subjected to thermal treatment at 400 °C reached deflection sizes between those of the reference series and the series with treatment at 550 °C. Smaller deflections were reached when the thermal treatment duration at 400 °C was 8 h compared to 2 h.
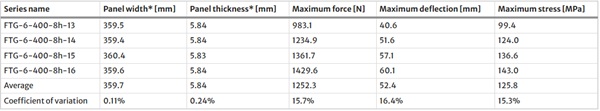
In addition to the values evaluated as box plots in Fig. 9 for the four test series, different mechanical properties measured and evaluated from the four-point bending tests are provided in Tables 3, 4, 5 and 6 for each glass panel along with its width and thickness. The maximum measured forces and deflections are included, as well as the maximum stresses calculated with Eq. (1). Besides the values for every glass panel, average values and coefficients of variation for each series are provided. It can be observed that the values determined from the four-point bending tests for the maximum force, the maximum midspan deflection and the maximum stress showed smaller scattering with coefficients of variation of around 8% to 10% for the reference series and for the series with panels subjected to thermal treatment at 400 °C for 2 h compared to coefficients of variations of around 14% to 16% for the series with panels subjected to thermal treatment at 400 °C for 8 h and at 550 °C for 2 h, respectively. This indicated that lower residual stresses result in a higher scattering of the bearable force, the reachable deflections and the bending strength.
Table 3 Measured cross-section dimensions and mechanical properties determined from the four-point-bending tests for the fully tempered glass panels without thermal treatment (FTG-6-ref) - Full size table
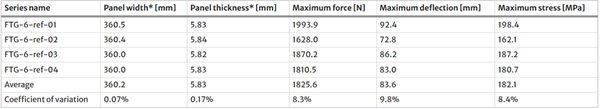
Table 4 Measured cross-section dimensions and mechanical properties determined from the four-point-bending tests for the fully tempered glass panels with thermal treatment at 550 °C for 2 h (FTG-6-550-2h) - Full size table
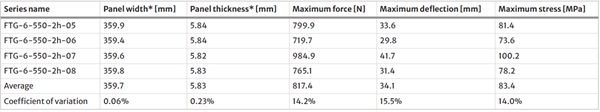
Table 5 Measured cross-section dimensions and mechanical properties determined from the four-point-bending tests for the fully tempered glass panels with thermal treatment at 400 °C for 2 h (FTG-6-400-2h) - Full size table
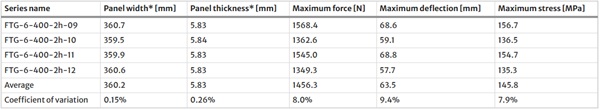
Table 6 Measured cross-section dimensions and mechanical properties determined from the four-point-bending tests for the fully tempered glass panels with thermal treatment at 400 °C for 8 h (FTG-6-400-8h) - Full size table
3.4 Four-point bending test results: fracture patterns
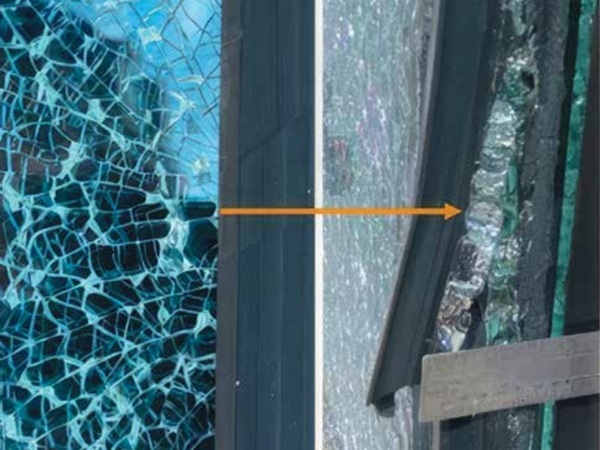
A good indicator whether a glass panel was thermally tempered or not is its fracture pattern. While annealed glass shows large fragments and radial cracks starting from the failure initiation point, fully tempered glass exhibits small dice-like fragments and net-like cracks extending over the entire glass panel surface. Heat strengthened glass, which has smaller tempering degrees compared to fully tempered glass, generally, shows fracture patterns with medium-to-large fragments and radial cracks, which are qualitatively closer to those of annealed glass than those of fully tempered glass. In this section, the fracture patterns of sixteen samples tested in four-point bending are presented and discussed, showing that they are in very good agreement with the previously discussed measurements of residual stresses and calculations of bending strengths.
Figure 10 shows the fracture patterns for the four samples of the reference series FTG-6-ref, which were not subjected to a thermal treatment for residual stress relief. All samples exhibited net-like cracks and very small dice-like shards, confirming the high degree of thermal tempering and the high measured residual stress values. It should also be mentioned that the failure was explosive and the reconstitution of the samples from their parts for photographing the fracture patterns was more difficult than for the other series, despite the applied PP self-adhesive films on the compressive side. Furthermore, the pictures in Fig. 10 show that the failure was initiated for all four samples in the area between the loading rollers, for two of them at the glass panel edge and for the other two on the glass panel surface.
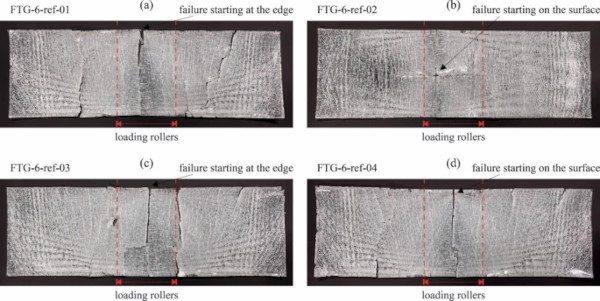
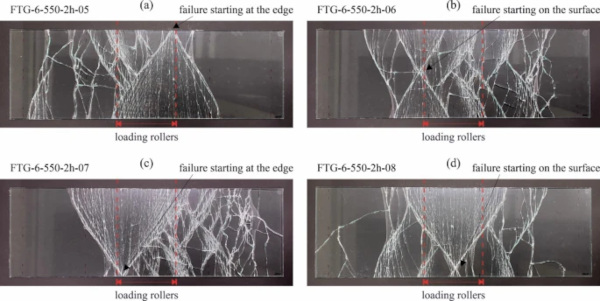
Figure 11 shows the fracture patterns for the four samples of the series FTG-6-550-2h, which were subjected to a thermal treatment at 550 °C for 2 h. All samples exhibited similar patterns, with radial cracks extending from the failure initiation points and relatively large shards. In addition, it can be noticed that there were large areas of the glass panels that remained without cracks. One should also know, that some of the cracks closer to the shorter glass panel edges resulted after the primary failure due to the impact of the sample with the timber parts positioned below it. The observed fracture patterns are very similar to that characteristic for annealed glass, confirming the full relief of residual stresses achieved with the applied thermal treatment conditions. The failures were initiated in the areas between the two loading rollers or in immediate vicinity outside the loading rollers (Fig. 11b). For two samples the failure was initiated at the glass panel edge, while for the other two the failure initiation points were on the glass panel surface.
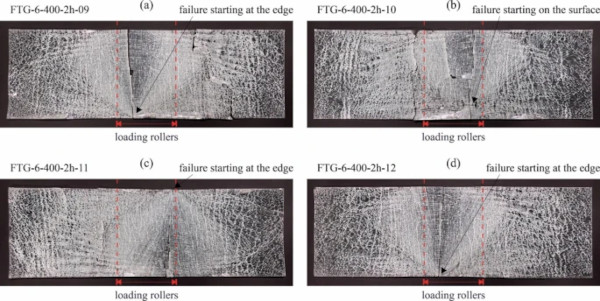
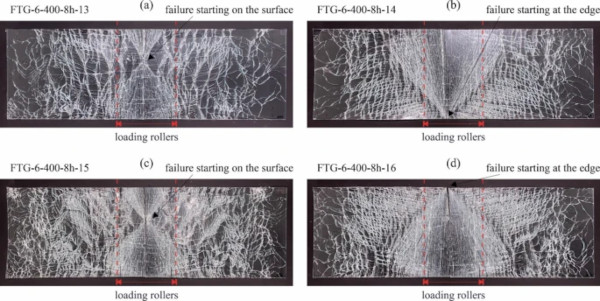
Figures 12 and 13 show the fracture patterns for the samples of the series subjected to thermal treatment at 400 °C for 2 h (FTG-6-400-2h) and for 8 h (FTG-6-400-8h), respectively. For both series, the observed fracture patterns can be qualitatively classified between those observed for the reference series (FTG-6-ref) and those noticed for the series subjected to thermal treatment at 550 °C (FTG-6-550-2h). The samples of the series FTG-6-400-2h shown in Fig. 12 exhibited relatively small fragments with net-like cracks distributed over the entire glass panel. However, a radial distribution starting at the failure initiation points could be observed on the net-like pattern. For all samples, the failure initiated in the area between the loading rollers, for three of them at the glass edge and for one on the glass surface. The samples of the series FTG-6-400-8h shown in Fig. 13 exhibited medium size fragments and radial cracks extending from the failure initiation points. These points were situated between the loading rollers for all samples, for two of them on the glass panel surfaces and for the other two at the glass panel edges. Other than for the samples of the series FTG-6-550-2h, no areas without cracks were noticed for the samples of the series FTG-6-400-8h. Based on the fracture patterns, the samples of the series FTG-6-400-8h could be classified as heat strengthened glass, while those of the series FTG-6-400-2h could almost be regarded as fully tempered glass.
3.5 Mechanical processing results
Based on the results obtained for the different investigated thermal treatment conditions, the most suitable for relief of residual stresses proved to be heating to 550 °C and holding this temperature constant for 2 h. Considering that this temperature is in the range of the annealing point of soda lime silicate glass, and that the lower temperature of 400 °C did only allow for a partial residual stress relief, it is not expected that significant further optimizations can be made in terms of reducing the temperature. Regarding the duration of 2 h used for holding the temperature constant, one reason for doing this was the delay observed between the control temperature of the furnace and the temperatures measured in the vicinity of the glass panels. With a furnace optimized for thermal treatment for residual stress relief, this duration could be reduced or eventually even completely avoided.
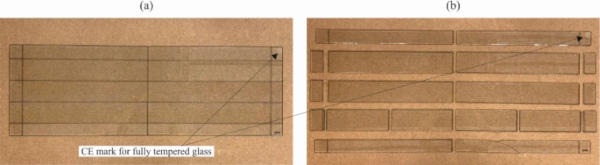
In addition to the panels subjected to four-point bending tests, two panels thermally treated at 550 °C for 2 h (samples 17 and 18) were used for assessing whether the fully tempered glass panels can be mechanically processed after thermal treatment for stress relief. These panels were manually cut in smaller pieces by scoring and breaking. One of the two panels is shown in Fig. 14 before cutting and after cutting. The sizes of the pieces after cutting were chosen to allow using them for assembling glass bricks as those investigated in Silvestru et al. (2024). In both pictures from Fig. 14, the fritted CE mark attesting fully tempered glass according to (EN 12150-1 2019) is visible in the top right corner of the panels. Figure 14b shows that cutting previously fully tempered glass is possible after relief of the residual stresses through thermal treatment. The one slightly failed cut recognisable for the pieces on the bottom right was due to a bad scoring line. Based on the successful outcome of the cutting process, it is expected that also industrial mechanical processing operations can be implemented.
4 Conclusions
The presented investigations addressed the possibility of applying thermal treatment for stress relief in thermally tempered glass with the objective of allowing its mechanical processing. This is of particular interest for future reuse and remanufacturing of such glass obtained from end-of-life façade elements, windows or interior glazing. The investigations led to the following main conclusions:
- The thermal treatment of the fully tempered glass panels at 550 °C for 2 h, followed by natural cooling overnight, allowed a full relief of the residual stresses (reduction by ~ 99%). Treating the glass panels under these conditions allowed to manually cut the panels into smaller pieces.
- The thermal treatment of the fully tempered glass panels at 400 °C, either for 2 h or for 8 h, followed by natural cooling overnight, allowed only a partial relief of the residual stresses. The treatment for a longer duration allowed a higher degree of stress relief (reduction by ~ 21% after 2 h and by ~ 44% after 8 h).
- The glass panels treated at 550 °C for 2 h exhibited a fracture pattern characteristic for annealed glass, while the glass panels treated at 400 °C exhibited fracture patterns similar to those of fully tempered glass or heat strengthened glass, depending on the treatment duration.
While the results obtained in lab conditions with the available equipment proved the feasibility of applying thermal treatment for residual stress relief in thermally tempered glass, further investigations are necessary. Two of the essential aspects to be addressed in next steps are the transferability of the findings to aged thermally tempered glass retrieved from end-of-life facades or windows, and developing an industrial implementation of the stress relief process.
Data availability
No datasets were generated or analysed during the current study.