Source: Glass Structures & Engineering
Authors: Lena Efferz, Christian Schuler & Geralt Siebert
DOI: https://doi.org/10.1007/s40940-025-00302-6
Abstract
Currently, the quality control of thermally toughened glass is carried out through destructive tests on standardized small-format glass panes to ensure fracture pattern and bending strength. However, these tests are costly and time-consuming. To reduce the need for such tests and enable non-destructive quality control of the residual stresses, photoelastic measurement methods for surface stress and edge stress offer a promising alternative. Previous studies have established correlations between photoelastic measurements and destructive tests, defining limits to ensure the mechanical properties of thermally toughened safety glass, but only for standard size format specimens. Therefore, experimental tests were carried out on 3,000 mm × 1,000 mm glass samples to determine surface stress, edge stress and fracture pattern. Particular attention was paid to comparing the photoelastic results of large-format specimens which were produced under the same cooling settings as the standardized small format specimens. The aim of this work is to verify limits from standards and literature on large-format specimens to evaluate whether non-destructive measurement methods can provide reliable results for quality control. By analyzing contingency tables, this study demonstrates that the limits of the standards poorly identify non-conforming thermally toughened glass, whereas the limit values from literature perform well in this regard but also reject some unnecessarily conforming glass. These findings provide insights into the suitability of photoelastic methods for sustainable and efficient quality control of large-format thermally tempered glass.
1 Introduction
To ensure the safety and performance of architectural glass in the situation of growing demands for larger formats and higher safety standards, it is essential to reliably assess its mechanical properties. These properties are currently controlled destructively on small-format panes. However, photoelastic measurements can also be utilized to evaluate the quality of thermally toughened glass non-destructively without being restricted to glass formats. The residual stresses that arise during the cooling of the tempering process of architectural glass define the toughening types in the European product standards for thermally toughened safety glass (EN 12150–1 2020) and heat-strengthened glass (EN 1863–1 2012). Compressive stresses form on the outer surfaces and edges of the glass pane, while tensile stresses prevail inside the glass pane. These compressive stresses counteract notch stresses at microcracks, so that thermal toughening increases the resistance of the glass to breakage due to bending loads. The thermally induced residual stresses also have a significant influence on the fracture behavior, which is of crucial importance for safety in various applications.
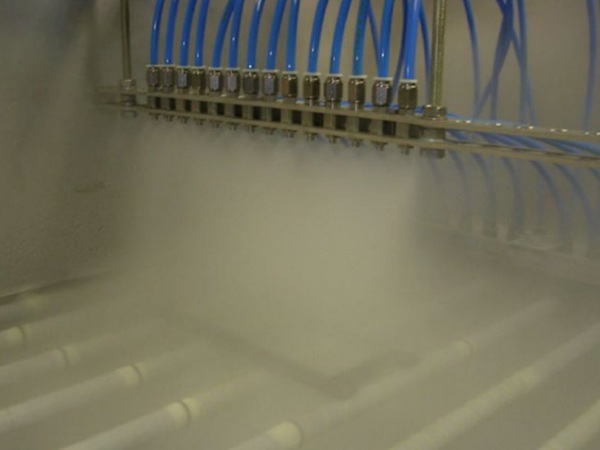
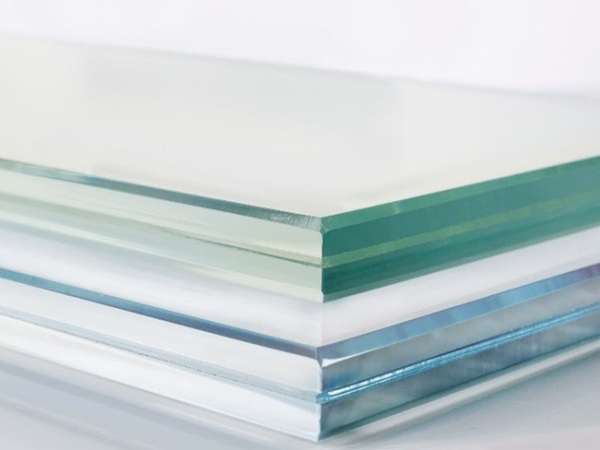
Some transparent materials exhibit a change in optical behavior under stress. Glass, for example, becomes birefringent due to thermally induced residual stresses, resulting in direction-dependent (anisotropic) optical properties. On the one hand, photoelastic measurements can be utilized to qualitatively visualize residual stresses. A method employed is the polariscope, which comprises polarizing filters and a light source. The polarized light waves in the thermally tempered glass undergo a splitting along the principal stress vectors σ1 and σ2, which leads to retardations of the light waves after they exit the glass. The retardations become visible as interference phenomena, for example in isochromatic images (see Fig. 1). Aben and Guillemet (1993); Ajovalasit et al. (2015); Ramesh and Sasikumar (2020) offer basic literature for photoelastic measurements.
On the other hand, the residual stresses in thermally toughened glass can also be measured quantitatively. In the undisturbed plate area, with sufficient distance to edges, holes and cut-outs, a parabolic stress curve is formed over the glass thickness after a homogeneous tempering process. The compressive stress on the surface is termed surface stress and can be measured using the scattered light method. Measurement methods and studies on surface stress can be found in Aben et al. (2008); Ramesh and Ramakrishnan (2016); Achintha (2021); Nielsen et al. (2021); Thiele et al. (2022), ASTM C 1279 (2023).
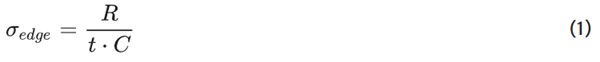
The compressive membrane residual stress in the rim area of the pane is known as edge stress. The retardation increases continuously in the edge area. With the maximum retardation R measured directly at the edge, the edge stress σedge is calculated on the basis of Wertheim’s law (Aben and Guillemet 1993) using the glass thickness t and the photoelastic constant C:
However, the measurement of the maximum retardation R on the edge of architectural glass presents certain challenges: The edge processing creates a chamfer, which is required for both types of pre-stressed glass in accordance with EN 12150–1 (2020) and EN 1863–1 (2012). The light waves of the measuring instruments utilized for measuring the retardation are reflected by the slanted surface of the chamfer, thereby leading to the inability to measure retardation values within this area. Consequently, the extrapolation of the retardation curve over the chamfer becomes essential to derive the maximum retardation R.
Despite the fact that the ASTM C 1279 (2023) standard delineates a methodology for measuring retardations at two fixed measuring points, which are employed for the purpose of determining the edge stress through linear extrapolation, this approach has been demonstrated by Efferz et al. (2024a) to be inadequate for measuring of edge stress of architectural glass. The measuring points of the standard are located within the wide chamfer. Efferz et al. (2024a) propose an alternative evaluation technique for determining the edge stress concluding a third-degree polynomial extrapolation over the chamfer using retardation measuring points which are acquired by the multiple wavelength photoelasticity method (Hidalgo and Elstner 2018, Softsolution GmbH 2023, Dix 2024).
Surface and edge stress are related to the properties of bending tensile strength and fracture pattern. Therefore, it would be advantageous if photoelastic measurement methods were used for quality assurance and optimization of the thermal tempering process for glass. Correlations between destructive tests and photoelastic measurements have already been demonstrated in earlier studies of (Barsom 1968; Mognato et al. 2011, 2017, 2018; Lee et al. 2012; Pourmoghaddam and Schneider 2018; Pourmoghaddam et al. 2019; Zaccaria and Overend 2020; Nielsen et al. 2022; Efferz et al. 2024b, 2025).
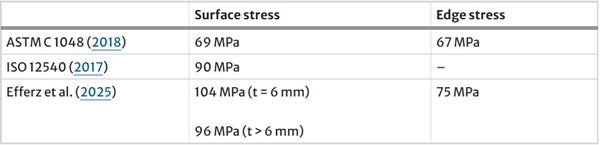
Currently, only the following standards provide limit values for photoelastic measurements for thermally toughened glass: ISO 12540 (2017) only specifies limit values for surface stress, which can replace both the destructive tests of bending tensile strength and the fracture pattern. The requirements of ISO 12540 (2017) for bending tensile strength and fracture pattern are identical to those for thermally toughened glass in accordance with EN 12150–1 (2020). ASTM C 1048 (2018) specifies limit values for edge and surface stress, but these only relate to the assessment of strength. ASTM C 1048 (2018) does not provide any information on the fracture pattern for the fully tempered glass type which is supposed to correspond to the European thermally toughened safety glass. European standards have not yet specified any photoelastic limits for assessing the properties of thermally toughened glass.
Efferz et al. (2025) defined photoelastic limits for edge and surface stress based on quantile regression models calculated with a quantile of 5%, which should sufficiently ensure the mechanical properties of fracture pattern and bending strength for thermally toughened safety glass. That scientific work provides a comprehensive statistical analysis of thermally toughened glass specimens of format 360 mm × 1,100 mm and different thicknesses (t = 6 mm, 8 mm, 10 mm and 12 mm). The analysis is based on photoelastic measurements of edge and surface stress, as well as destructive fracture and bending tests, as currently prescribed in EN 12150–1 (2020) for the factory production control of thermally toughened safety glass. The analysis yielded photoelastic limit values that are recommended to fulfil the requirements of EN 12150–1 (2020). The evaluation of the quantile regression models demonstrated that the thickness of the glass has a significant influence on the relationship between the number of fragments and surface stress: a minimum limit value of 104 MPa was obtained for the glass thickness of 6 mm, while the other glass thicknesses resulted in a minimum limit value of 96 MPa. A minimum limit value of 75 MPa was determined for the edge stress. Table 1 shows the comparison of photoelastic values of the surface and edge stress of the standards and of Efferz et al. (2025).
Table 1 Minimum photoelastic values of surface and edge stress for thermally toughened glass, t = glass thickness - Full size table
These and similar findings are mainly based on small-format test specimens. Photoelastic tests on the standard size panes of 360 mm × 1,100 mm have the advantage that the destructive tests of fracture pattern and bending tensile strength required by EN 12150–1 (2020) can also be carried out on these specimens. This allows a correlation between the tests to be analyzed. However, this standard format has no practical relevance. The transferability to large-format glass components, such as those used in façades, has not yet been sufficiently investigated.
The objective of this study is to evaluate the applicability of photoelastic measurement techniques for the non-destructive quality control of large-format thermally toughened safety glass. Specifically, the study investigates which existing limit values from Efferz et al. (2025), in addition to the standards of ASTM C 1048 (2018) and ISO 12540 (2017), can be transferred to larger glass formats. To this end, experimental investigations were conducted on large-format glass specimens, with dimensions of 3,000 mm × 1,000 mm. The experimental program included measuring the surface and edge stress using photoelastic methods, as well as destructive tests to analyze the fracture pattern. Based on the fracture pattern, the test specimens are assessed for conformity with EN 12150–1 (2020).
In addition to analyzing the test results, another focus is on the tempering process of large-format specimens in comparison to standard-size specimens. In one scenario, the test specimens were produced under the same cooling parameters as in the small format. In the other scenario, the cooling parameters of the air pressure in the quench were adapted to the larger dimensions of the test specimens. The objective of this investigation is to ascertain the disparities in fracture patterns and surface and edge stress results between these two scenarios and the influence of the specimen sizes.
As a final assessment, contingency tables and the metrics calculated from them are used to compare the different limit values from the ASTM C 1048 (2018) and ISO 12540 (2017) standards and from Efferz et al. (2025). On the one hand, it is assessed how accurately the limit values recognize the non-conform thermally toughened glass specimens and how many are falsely passed as conform. On the other hand, the percentage of conforming thermally toughened glass samples that are unnecessarily rejected due to the photoelastic limit will also be analyzed.
The following questions are addressed in this study:
- Which limit values for edge and surface stress derived from literature and standards can classify large-format thermally toughened safety glass?
- How does the specimen size affect the fracture behavior? How are these effects related to the measurements of edge and surface stress?
- Are photoelastic methods suitable for a sustainable and efficient quality control of large format thermally toughened glass?
2 Methods
2.1 Test procedure and specimens
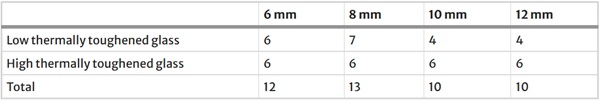
The analyzed test specimens measured 1,000 mm × 3,000 mm, were uncoated, and had glass thicknesses of 6 mm, 8 mm, 10 mm, and 12 mm. Each glass thickness was produced by two of the three participating manufacturers. All specimens had an edge processing of ground edges (KGN) and were tempered to produce thermally toughened safety glass (TTG) in accordance with the EN 12150–1 (2020) standard. To investigate the potential effects of the production parameters on the photoelastic measurements and the fracture pattern, two different levels of pre-stressing were created within the thermally toughened glass category by modifying the furnace processes: “low” and “high” thermally toughened glass. Table 2 shows the number of test specimens depending on the thickness and pre-stress level.
Table 2 Number of test specimens depending on glass thickness and pre-stress level - Full size table
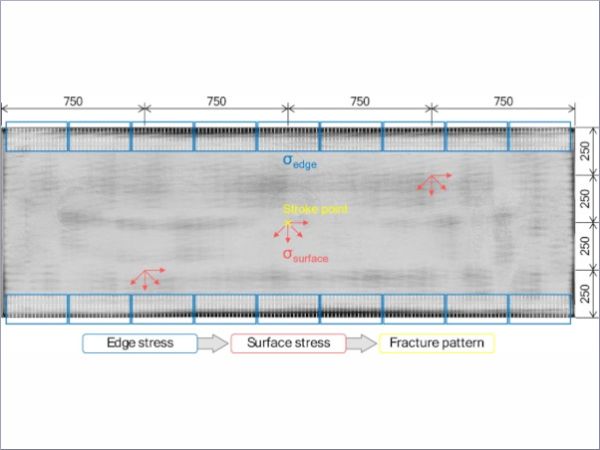
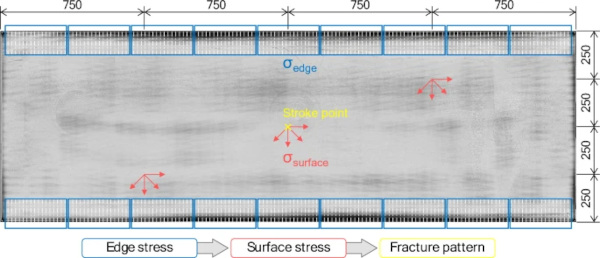
The 45 test specimens were analyzed as follows: The edge stress was determined by scanning the specimens with the Linescanner by Softsolution GmbH (2023), which generates three isochromatic images per specimen based on the multiple photoelasticity method (Hidalgo and Elstner 2018, Dix 2024). Figure 1 shows an exemplary isochromatic image of an 8 mm thermally toughened glass. The edge isochromatics, indicated as lines of intensity minima and maxima on these images, are counted automatically, corresponding to the respective fringe order of the wavelength of the isochromatic image (Schaaf et al. 2017). This methodology enables the determination of the retardation of the light at the points of the isochromatics. The maximum retardation at the edge is determined by extrapolation with a third-degree polynomial based on the positions of the isochromatics of all images of a specimen. The edge stress is then calculated from Eq. (1). The methodology is described in more detail in Efferz et al. (2024a). The edge stress of the large-format specimens was determined in nine evaluation regions along each longitudinal edge, as shown in Fig. 1. Each evaluation region in this study consisted of 16 cuts where the intensity progression of the isochromatics was analyzed collectively. The mean value of the evaluation regions was then calculated for each specimen, which was used as a control value for the evaluation with the photoelastic limit value.
In the second part of the photoelastic measurements, the surface stress was measured at three measuring points, with the SCALP-05 from GlasStress Ltd. (2013) being utilized as the measuring device which was configured with a fit closeness parameter of 0.5, using a local approximation method based on a third-degree polynomial. Measurements were taken at one measuring point in four directions in 45° steps to obtain the principal stresses σ1 and σ2 at the surface using the equations according to the manual of GlasStress Ltd. (2013). Although several authors (Nielsen 2009; Zaccaria and Overend 2020) have investigated how the accuracy of measuring the surface stress depends on the photoelastic constant for glass, this study applied the value of 2.72 TPa−1, based on recommendations in the SCALP-05 manual (GlasStress Ltd. 2013) and Ramakrishnan and Ramesh (2016) to ensure comparability with previous investigations. The mean value of the higher stress, σ1, was then calculated from the three measuring points to determine the photoelastic limit value.
For evaluation of the fracture pattern, the specimen was impacted with a center punch at the midpoint of the pane, and the fragments in the area of the coarsest fracture pattern were manually counted in a 50 mm × 50 mm square. Thereby, the area around the stroke point with a radius of 100 mm and the edge area of 25 mm wide stripes were excluded from the evaluation. The number of fragments was utilized as an evaluation criterion to ascertain whether the test specimens conformed to the glass type thermally toughened safety glass. The EN 12150–1 (2020) standard specifies a minimum of 40 fragments in the counted area for thermally toughened safety glass for glass thickness of 4–12 mm.
2.2 Classification methods
To assess and compare the reliability of different classification models, the method of frequency distribution tables can be employed, in which the binary categories predicted by the model are compared to the actual binary categories. In this study, the predicted categories consist of the assignment of conforming or non-conforming thermally toughened glass (TTG) by the evaluation of the fracture pattern according to EN 12150–1 (2020) and the predicted categories consist of the assignment based on the minimum limits of the photoelastic measurements of surface and edge stress. Contingency tables (Powers 2011) are created to analyze the model performance in detail.
Figure 2 shows the contingency table for the large-format specimens analyzed in the study. The abbreviations are described using the following terms:
- True Positives (TP): Specimens correctly classified as conforming TTG
- True Negatives (TN): Specimens correctly classified as non-conforming TTG
- False Positives (FP): Specimens incorrectly classified as conforming TTG
- False Negatives (FN): Specimens incorrectly classified as non-conforming TTG
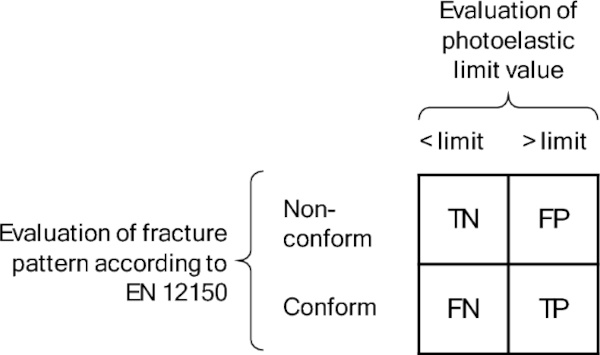
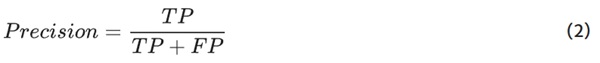
The elements of the contingency table can be utilized to ascertain additional measures (Powers 2011) that facilitate a comprehensive evaluation of the reliability of the model. This approach enables the quantification of both the uncertainty of the predictions and possible misclassifications, thereby contributing to the assessment of the test criterion, i.e. the photoelastic limit value in this study. The precision is defined as the proportion of correctly predicted conforming of all specimens that correctly and incorrectly exceed the limit:
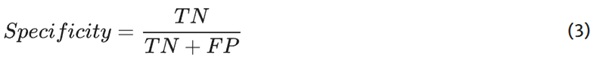
In the context of safety aspects quality control of thermally toughened glass, it is essential to minimize the number of false positives. The associated indicator is the specificity, which defines the rate at which a non-conforming specimen is correctly classified as such:
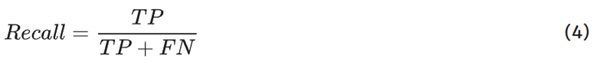
Simultaneously, however, the number of false negatives should also be minimal to avoid the unnecessary rejection of glass panes. The recall ratio is a statistical metric that indicates the proportion of correctly predicted positives to all actual conforming specimens:
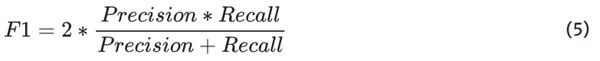
To obtain a balanced score between precision and recall, the F1 score can be calculated as:
The classification method based on contingency tables and class-specific metrics provides a clear and interpretable evaluation framework. However, in the case of an imbalanced data set, certain classes are underrepresented, which can lead to misleading metrics results. To mitigate this, the focus lies on class-specific values of precision and specificity, which better reflect performance in minority classes. Taking these aspects into account, the method is considered suitable for evaluating the various photoelastic limit values defined in standards and literature, regarding the test results from the thermally toughened large-format specimens.
3 Results
3.1 Destroying and photoelastic investigations on large-format specimens
This chapter is structured in such a way that the fracture pattern tests are first used to assess whether the test specimens are thermally toughened glass conform to EN 12150–1 (2020).
Figure 3 shows the number of fragments depending on the thickness of the glass. Three specimens with a glass thickness of 6 mm fall below the limit of 40 fragments that thermally toughened glass must reach in a square of 50 mm × 50 mm in the coarsest fracture pattern in accordance with EN 12150–1 (2020). The specimens exhibiting non-conforming fracture patterns are designated in red within the diagram. The remaining 42 test specimens exhibit a sufficiently fine fracture pattern, thereby conforming to the requirements of thermally toughened glass as specified in EN 12150–1 (2020).
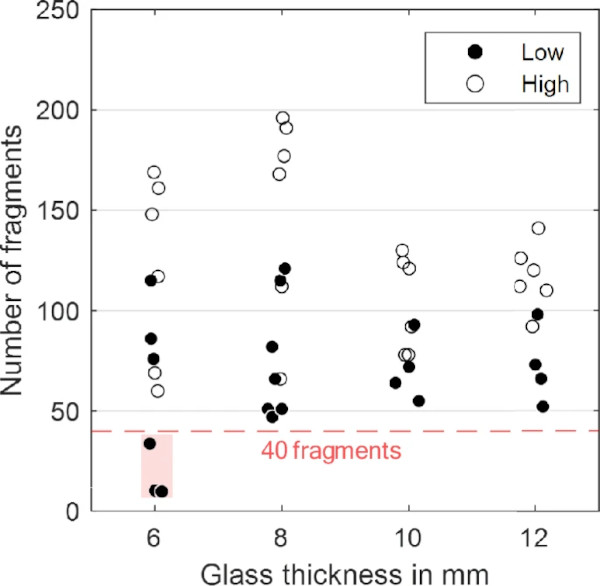
A comparison of the pre-stress levels shown in color reveals a clear difference between the low and high toughened specimens. As expected, the high toughened specimens exhibited a finer fracture pattern and resulted in a higher average number of fragments. This is in line with the expectation that a higher pre-stress level would lead to greater fragmentation at break. Nevertheless, there is an overlap between the “high” and “low” categories. Some specimens that were classified as high toughened exhibited number of fragments that were in the range of the low toughened specimens. This observation can be attributed to manufacturer-specific differences: Within the test series of a single manufacturer, the pre-stress levels were consistent and clearly distinguishable; only in comparison with the other manufacturer, the pre-stress levels can vary.
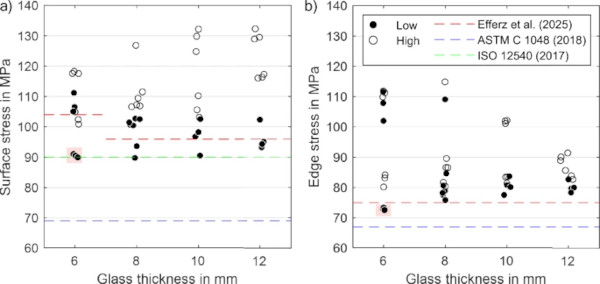
Figure 4 shows the results of the photoelastic measurements, i.e. the average values of the measuring points per specimens of surface stress (a) and edge stress (b). In both diagrams, the limits according to ASTM C 1048 (2018), ISO 12540 (2017) and Efferz et al. (2025) are indicated as lines. The non-conforming specimens that do not fulfil the fracture pattern required by EN 12150–1 (2020) are highlighted in red in the diagram. In both photoelastic measurements, these specimens exceed the minimum values of ASTM C 1048 (2018) of 69 MPa for surface stress and 67 MPa for edge stress. For comparison: the limit values for surface stress of 104 MPa for t = 6 mm and 96 MPa for t > 6 mm and for edge stress of 75 MPa from Efferz et al. (2025) sort out the non-conforming specimens as they do not reach the limit values. In addition, it can be observed in Fig. 4a that eight specimens fall below the limit values for surface stress, although they exhibit the fracture pattern required for thermally toughened glass. Surface stress values were measured in the range of 90–111 MPa on the conforming low toughened specimens and 101–132 MPa on the high toughened specimens. Edge stresses ranged from 76 to 111 MPa for the low toughened specimens and 80–115 MPa for the high toughened specimens. The noticeable overlap in these ranges can again be explained by manufacturer differences, but within the manufacturer, the pre-stress levels can be differentiated.
The contingency tables in Table 3 provide a detailed overview of the potential of the various limit criteria for surface and edge stress. This table shows the number of real positives and negatives depending on the fracture tests and the predicted positives and negatives based on the photoelastic measurements. For the contingency table of surface stress limit according to Efferz et al. (2025), the numerical values of the two limit values depending on the glass thicknesses were summarized to enable a more comprehensive analysis.
Table 3 Contingency tables for different limit values of surface stress and edge stress - Full size table
3.2 Relation between standard size and large-format tests
This chapter explores the influence of the dimensions of the specimens, specifically the small-format, standard size (360 mm × 1,100 mm) and large-format (1,000 mm × 3,000 mm) specimens. The results of the standard size specimens are derived from the research conducted by Efferz et al. (2024b) and (2025), where the toughening process was executed by the same manufacturers. The subsequent analysis distinguishes between 2 scenarios regarding the toughening process, to evaluate the relationship between standard size and large-format tests:
- Scenario I: Same cooling parameters
- Scenario II: Adapted cooling parameters
In scenario I, the manufacturers toughened the specimens of the standard size and large format in different time periods, but with the same cooling setting parameters for the air pressure in the quench for their respective glass thickness and pre-stress level of low and high toughened glass. Only the heating time was adjusted to the glass size and mass. In scenario II, the manufacturers adapted the tempering settings specifically to the large-format specimens, so that the furnace settings differ from those of the standard size specimens. This differentiation enables a systematic analysis of the effects of the sample size on the tempering process under controlled conditions.
Figure 5 shows the number of fragments for the same (a) and the adapted (b) cooling parameters of the standard size and large-format specimens depending on the pre-stress level of low and high toughening. For scenario I, it can be seen in Fig. 5a that the number of fragments decreases for the same cooling parameters for the 1,000 mm × 3,000 mm specimens at both pre-stress levels. The 6 mm low toughened specimens, which are highlighted in red in the diagram, even fall below the limit of 40 fragments, although the standard size specimens still exhibit the fracture pattern required for thermally toughened glass. For the specimens in Scenario II in Fig. 5b, which were produced with adapted cooling parameters, no uniform trend can be observed in the comparison of standard size to large format. In Scenario II, all specimens are in accordance with the properties of thermally toughened glass.
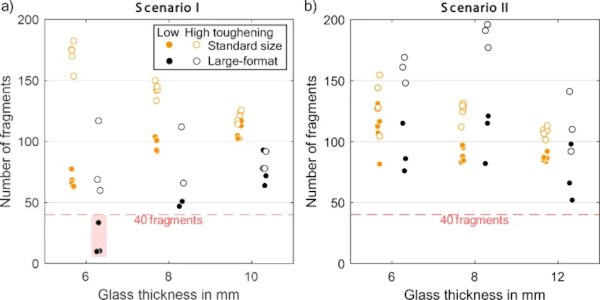
Figure 6 shows the results of the surface stress for the same (a) and the adapted (b) cooling parameters with the limits established by ASTM C 1048 (2018), ISO 12540 (2017) and Efferz et al. (2025). The three non-conforming specimens, as determined by fracture pattern analysis, are indicated in red. The decreasing behavior of the number of fragments in scenario I regarding the bigger specimen size in Fig. 5a can also be seen in the behavior of the surface stress in Fig. 6a. In Fig. 5b, the higher number of fragments observed for the high toughened large-format specimens of scenario II compared to the high toughened standard format specimens is not consistent with the results obtained from the surface stress analysis in Fig. 6b: here, the high toughened large-format specimens have lower surface stress values compared to the standard format.
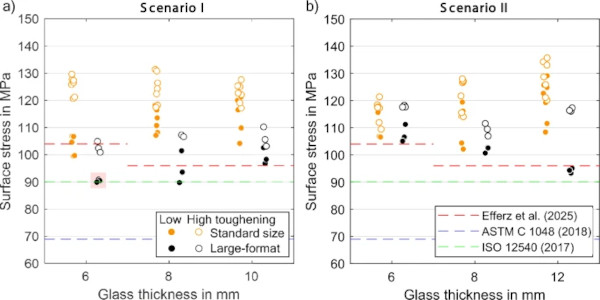
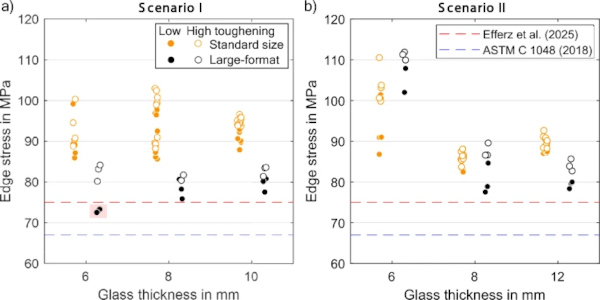
Figure 7 presents the edge stress of the standard size and large-format specimens with the limits established by ASTM C 1048 (2018), ISO 12540 (2017) and Efferz et al. (2025). Figure 7a also demonstrates the decreasing trend of the number of fragments regarding the specimen size in the edge stress measurements in scenario I. For the 6 mm and 8 mm high toughened, the large-format specimens have a higher edge stress than the standard size in Scenario II in Fig. 7b which aligns with the observations of the number of fragments in Fig. 5b. For both scenarios, the differences of edge stress values of the high and low toughened specimens are in a narrower range.
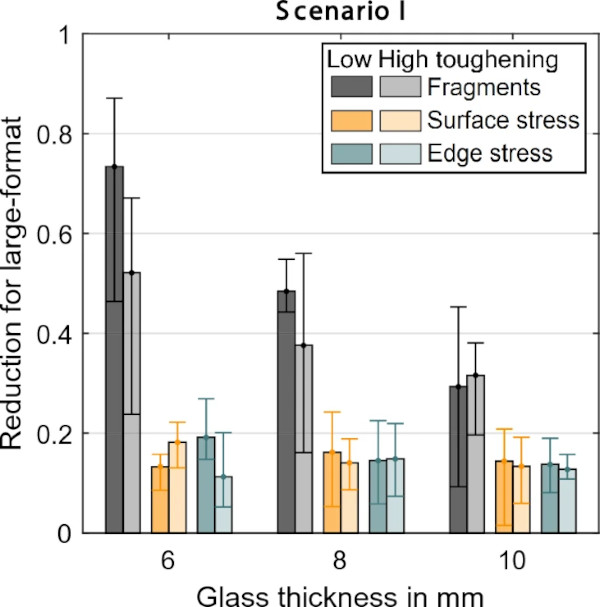
To analyze the changing effects of sample size on the test results in Scenario I with greater clarity, the mean value for the test results of large-format and standard size was calculated for each test series, separately for glass thickness and pre-stress level. As the ratio of small format to large format was less than 1 for all measurement methods, the reduction factor was calculated using the mean values:

Figure 8 shows the reduction factors of the large-format compared to the standard-format specimens, which were produced under the same cooling parameters (scenario I). It is not possible to calculate the factor of individual samples, as there is no direct pairing between specific large-format and standard size specimens. However, to reflect the variability within the changing effects, error bars indicating the minimum and maximum possible reduction factors are included in Fig. 8. The diagram illustrates the distinction in color between the measurement method and pre-stress level. The influence of specimen size has been found to be particularly apparent in fracture tests: the number of fragments from the large-format glass decreases by 73% in the 6 mm low toughened series. With increasing glass thickness, the reduction in the number of fragments diminishes to 31% for the 10 mm high toughened specimens. The strong reduction in the number of fragments in the large-format specimens in comparison to the standard size specimens does not correspond to the same extent with the photoelastic measurements. A maximum mean reduction factor of 18% in surface stress and up to 19% in edge stress has been observed. Furthermore, no trend is apparent in the photoelastic measurements in relation to the glass thickness.
4 Discussion
To compare and evaluate the different photoelastic limit values from ASTM C 1048 (2018), ISO 12540 (2017) and Efferz et al. (2025), the measures of precision, recall, F1 and specificity according to equations (2–5) were calculated for the photoelastic measurements based on the contingency tables in Table 3.
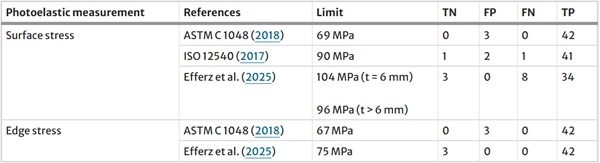
Table 4 shows the measures for surface stress. For the limit of ASTM C 1048 (2018), the recall is 100%, indicating that all conforming thermally toughened glass are accurately recognized, and no specimen is incorrectly rejected. However, the specificity rate is 0%, signifying that all real non-conforming specimens are incorrectly classified as conforming due to a low limit of 69 MPa. However, as ASTM C 1048 (2018) does not regulate the fracture pattern, but rather the strength of glass, this study shows that the limit value of 69 MPa is not suitable for the purpose of checking the fracture pattern of thermally toughened glass. ISO 12540 (2017) has the same requirements as EN 12150–1 (2020) for the fracture pattern and recognizes almost all real conforming thermally toughened glass correctly with a recall of 97.6%. But its specificity is deemed inadequate, with a rate of 33.3% for identifying non-conforming specimens. When controlling the quality of thermally toughened glass, too low a specificity can have serious consequences if the glass is accepted based on photoelastic measurements but does not show a fine enough fracture pattern.
Table 4 Measures for limits of surface stress measurement - Full size table
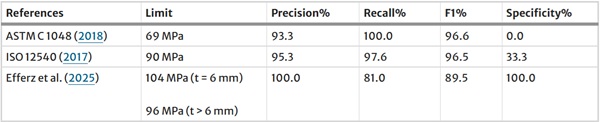
The limit values according to Efferz et al. (2025) correctly classify all true negatives, with a 100% specificity. However, the recall rate of 81% indicates that not all real conforming thermally toughened glass is recognized as such. This suggests that 19% of specimens would fulfill the fracture pattern of thermally toughened glass and consequently fail quality control due to surface stress. As the limit values for surface stress according to Efferz et al. (2025) are dependent on glass thickness, the recall is calculated separately: For the limit value of 104 MPa, the recall for the t = 6 mm specimens is 77.8%, while the specimens t > 6 mm with the limit value 96 MPa have a recall of 81.9%. The limit value of 104 MPa consequently erroneously disqualifies a slightly higher percentage of test specimens (22.2%) in comparison to the limit value of 96 MPa (18.1%).
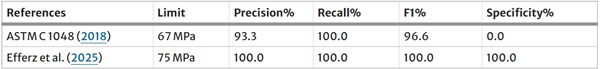
As illustrated in Table 5, the measures from the contingency tables for the classification based on the edge stress values demonstrate the clear superiority of the limit value of 75 MPa proposed by Efferz et al. (2025) over the limit value of 67 MPa defined in ASTM C 1048 (2018). This is evidenced by the measures of precision, recall value and specificity of 100% each. Conversely, the limit value of 67 MPa demonstrates an inability to accurately identify non-conforming specimens, as it erroneously classifies all specimens as conforming thermally toughened glass.
Table 5 Measures for limits of edge stress measurement - Full size table
The investigation of the size of the specimens in Sect. 3.2 demonstrated that the large-format specimens from scenario I, which were produced with the same cooling parameters, exhibited a lower pre-stress state. The reduction in fragments in the large-format specimens was also confirmed by the 2 photoelastic measurement methods of surface and edge stress.
EN 12150–1 (2020) specifies destructive tests on standard-size specimens measuring 360 mm × 1100 mm which must be toughened simultaneously with the real-sized panes of the same glass thickness used for installation. These tested specimens are assumed to be representative of all other formats in the production batch with the same thickness, and to comply with the finely crumbled fracture pattern specified for thermally toughened glass. However, evaluations in this study suggest that the residual stress state of these standard-size specimens is higher than that of the larger panes. While small-format panes with a higher stress state are assessed as part of quality control, they may not accurately represent the actual tempering quality of full-size panes. This could lead to an overestimation of their residual stress state.
Therefore, it is generally recommended to confirm the fragmentation pattern and adapting the tempering setting parameters when scaling up. Conversely, that indicates that the photoelastic limits for thermally toughened glass from Efferz et al. (2025) are on the safe side because the determination of the limits is based on higher initial values, and therefore more conservative limits were achieved. However, it should be noted that the low limit values specified by ASTM C 1048 (2018) for surface and edge stress are not adequate for the purpose of checking the fracture pattern. Furthermore, the classification method showed that the limit value of the ISO 12540 (2017) for the surface stress cannot recognize all the non-conform specimens. However, the specificity value is particularly important for the quality control of thermally toughened glass if this is to be carried out using photoelastic measurement methods.
5 Conclusion
To ascertain the quality of large-format glass elements of thermally toughened safety glass that are utilized in façades, it has been possible to carry out only destructive fracture pattern tests. A statement on strength in accordance with EN 12150–1 (2020) could previously only be made on small-format panes measuring 360 mm × 1,100 mm, also using destructive tests. Photoelastic measurements of edge and surface stress have the potential to replace destructive tests of fracture pattern and bending tensile strength, which are regulated by EN 12150–1 (2020) in the context of quality control for thermally toughened safety glass. However, the majority of photoelastic investigations to date have been conducted on this standard-sized glass. But practical, relevant formats used in the façade sector deviate from this format and have not yet been analyzed by photoelastic measurements.
To address this knowledge gap concerning the strength and fracture pattern of large-format glass elements, the photoelastic limit values obtained from small-format specimens in Efferz et al. (2025) were validated for large-format glass elements. This study therefore confirms the measurement methods and provided important findings on the transferability of photoelastic limit values from Efferz et al. (2025) to large-format thermally toughened glass. Therefore, experimental investigations were carried out on glass panes with dimensions of 3,000 mm × 1,000 mm. Firstly, the photoelastic properties were measured: The edge stress was determined from the isochromatic images using the Softsolution Linescanner (2023) by analyzing the edge isochromatics of nine measurement areas at the longitudinal edges. The surface stress was measured at three points with the SCALP-05 from GlasStress (2013). This was followed by the destroying test of fracture pattern, which is used to test conformity with EN 12150–1 (2020) for thermally toughened safety glass.
In the comparison between small and large format test specimens, two different tempering scenarios were considered: In Scenario I, same and in Scenario II, adapted cooling settings during the pre-stress process were applied to the specimens. In Scenario II, the standard-size and large-format specimens attained comparable pre-stress states, as the tempering conditions were adapted to the respective format. Scenario I revealed clear differences in the results, especially in the fracture tests. For the 6 mm large-format specimens, the number of fragments was reduced by up to 73% compared to the standard format. While the standard-format specimens still exhibit the required fracture pattern in accordance with EN 12150–1 (2020) under the same cooling settings, the large-format specimens no longer achieve the minimum number of 40 fragments. The reduction in the pre-stress state of the large format compared to standard size specimens is not observed to the same extent in photoelastic measurements: The photoelastic measurements also experience reductions, but only to a maximum a mean of 20%. This emphasizes the necessity to adapt production parameters specifically for large-format glass to achieve the safety-relevant properties. At the same time, this also means that the reference panes, which are tempered alongside the large-format panes, exhibit a higher stress state. While this higher stress state is currently tested as part of quality control, it does not accurately reflect the actual tempering quality of the full-size panes.
The classification using contingency tables and the measures derived from them enabled a differentiated assessment of the various photoelastic limit values from Efferz et al. (2025), the ASTM C 1048 (2018) and ISO 12540 (2017) standards. The limit values for photoelastic measurements from Efferz et al. (2025) proved to be effective on the large-format specimens. Notably, the three 6 mm specimens, which did not conform to the fracture pattern characteristic of thermally toughened glass, were accurately classified as non-conforming, exhibiting a specificity ratio of 100%. Conversely, the ASTM C 1048 (2018) limits demonstrated a detection rate for the non-conforming specimens of 0%. The ISO 12540 (2017) limit recognized the true negatives correctly with 33.3%. The limit values from Efferz et al. (2025) for surface stress incorrectly sorted out 19% of the large-format specimens examined, despite these specimens showing the conforming fracture pattern of thermally toughened glass. Nevertheless, the authors consider the rate of specificity to be more crucial than the recall when supplementing quality control with photoelastic measurements. It can thus be concluded that the limits defined by Efferz et al. (2025) can be used as conservative but valid assessment criteria, thus ensuring that no glass panes are approved that fulfil neither the required fracture pattern nor the required strength.
In conclusion, it can be stated that photoelastic methods, particularly the measurement of edge stress in the online production process, offer promising potential for sustainable and efficient quality control of large-format thermally toughened glass.
The authors acknowledge that the photoelastic limit values from Efferz et al. (2025) can currently solely be utilized to verify the tempering type of thermally toughened safety glass in accordance with EN 12150–1 (2020). Further investigation is required to determine whether the photoelastic measurements are suitable for differentiating between thermally toughened and heat-strengthened glass. To this end, it is essential to establish limit values for heat-strengthened glass in accordance with EN 1863–1 (2012), which would control both the strength of at least 70 MPa and the characteristic fracture pattern. The findings have the potential to advance digital inspection techniques for tempered glass in online production quality control thereby minimizing resource consumption by decreasing the need for destructive testing.