Authors: Jinju Zhang, Xinjian Wang, Liqiong Wang & Pengchong Su
Source: Shock and Vibration, vol. 2020, Article ID 4257191, 6 pages, 2020. https://doi.org/10.1155/2020/4257191
Abstract
Building glass fragment in a blast-related environment is the main cause of casualties. In order to analyze the explosion-proof performance of insulated glass quantitatively in conventional buildings, the explosion experiment under different shock wave loads was carried out on the insulated glass, the pressure sensor was used to collect the overpressure value of the explosion shock wave, and the high-speed camera was used to record the breaking process of glass. The broken state of the insulated glass and the critical overpressure value of the broken state under different working conditions were obtained.
And the theoretical calculation method based on the equivalent static load was used to verify the critical overpressure value of the insulated glass. The research showed that the fragments scattered toward the center of the explosion source when the layer of the insulated glass face to the explosion wave front was broken, and the fragments mainly scattered in the direction of the shock wave propagation when it was completely broken. The theoretical calculation method based on the equivalent static load could be used to evaluate the explosion-proof performance of the insulated glass.
1. Introduction
The statistics of previous explosion events show that more than 70% of casualties are caused by splashed glass fragments in the area affected by the explosion [1–3]. Therefore, it is of practical significance to carry out research on the fracture characteristics of building glass and its explosion-proof performance under blast loading. Young et al. [4] established a scattering model of glass fragments by conducting biorealistic experiments and developed a glass fragment penetration program to analyze the damage caused by the scattering of glass fragments quantitatively. Stewart and Netherton [5] estimated the probability of glass safety performance under impact loading by using a single-degree-of-freedom simplified model. Oswald and Baker [6] established a vulnerability assessment model for the occupants in the building by using the data of human injury in the Oklahoma explosion and the data obtained from the earthquake disaster and by combining with the damage level of the building.
The impact of building glass breakage on personnel injury was considered in this model. Besides, several numerical simulations with various models have been conducted to investigate the behaviour of laminated glass under blast loading, including parametric analyses [7–10]. Larcher et al. [11] made a review on the abilities of numerical simulations to assess blast-loaded laminated glass and presented the first idea of standardization in this field. Meanwhile, many researchers combine experimental and simulation methods to study the performance of glass under blast loading. For instance, Zhang et al. [12, 13] established the pressure-impulse (P-I) diagrams for PVB laminated glass to provide correlations between dynamic responses of laminated glass and blast loadings by numerical simulation and analyzed the glass fragment velocity and mass of single-layer tempered glass under explosion load by field experiment.
Accordingly, in order to reduce the threat from shattered glass, mitigation and retrofit methods have also been explored in the several decades. Norville and Conrath [14] proved that the insulated glass composed of two laminated glass had better explosion-proof performance. Li, Zhang and Chen et al. [15–18] proposed the explosion-proof design method of glass curtain wall by studying the dynamic response of glass curtain wall under the action of explosion load. Le [19] compared the explosion test of domestic explosion-proof glass with ordinary glass, which showed that increasing the thickness of the glass panel and the number of layers of the substrate could improve the ability of the combined glass to resist the explosion shock wave effectively. Zhang and Bedon [20] discussed the current methods and trends for mitigating blast-related hazards on glass windows, including interlayer anchors, catching systems, and sliding supporting systems.
It can be seen that the research on the glass under blast loading mainly focuses on the laminated glass with good explosion-proof performance and the design of explosion-proof glass structure, but the explosion-proof performance of the insulated glass used as the conventional glass for civil buildings has not been researched. Therefore, the conventional insulated tempered glass in civil buildings was selected as the research object in this paper.
The explosion-proof performance of the insulated glass was analyzed quantitatively by the experimental research on the fracture characteristics and the critical overpressure threshold of the insulated glass under different blast loadings. And the experimental results were verified by using the theoretical analysis method, which could provide a reliable theoretical evaluation method for the explosion-proof performance of insulated glass and then provide theoretical support for the explosion-proof design of architectural glass.
2. Test of Explosion-Proof Performance of Insulated Glass
2.1. Experimental Design
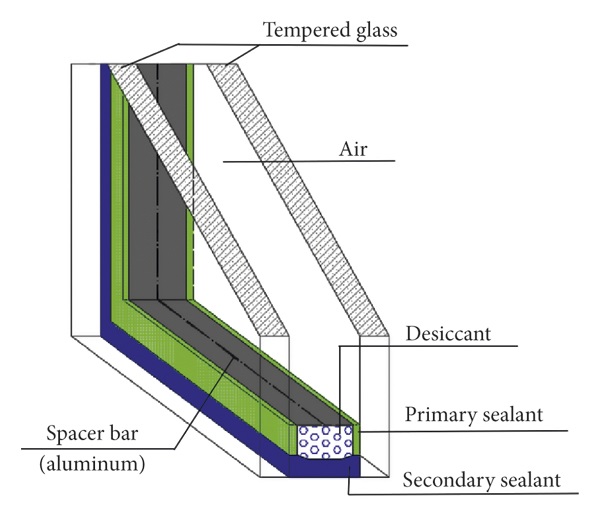
This experiment is designed to analyze the explosion-proof performance of the insulated glass, especially to explore the critical overpressure value of the broken glass. The size of the insulated glass selected in this experiment is 600 mm × 600 mm, and the structure is 6 mm tempered +12 mm air +6 mm tempered. The structural drawing of the insulated glass is shown in Figure 1. A total of 20 specimens are prepared.
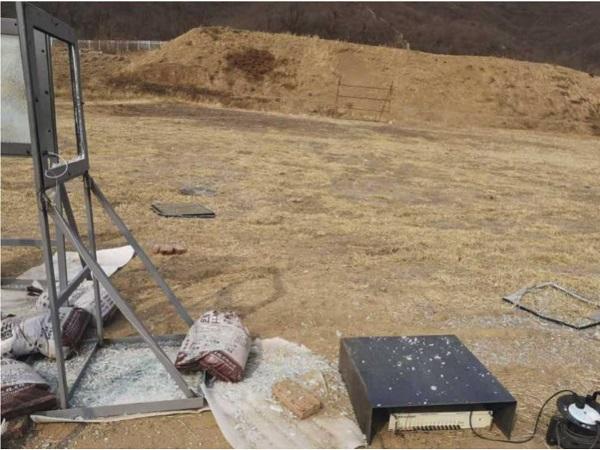
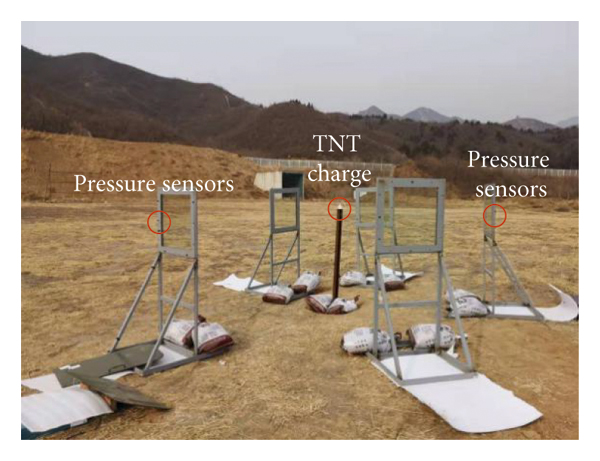
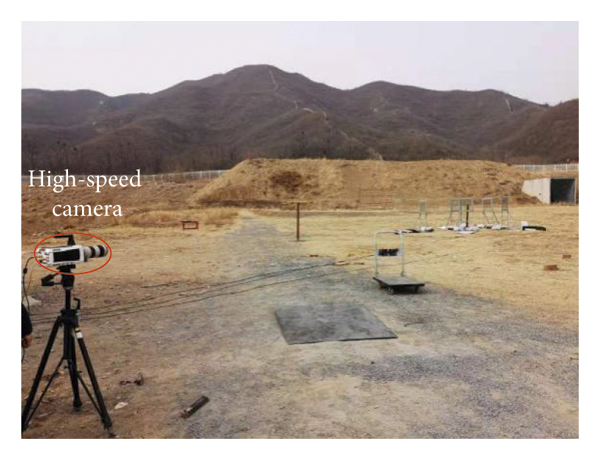
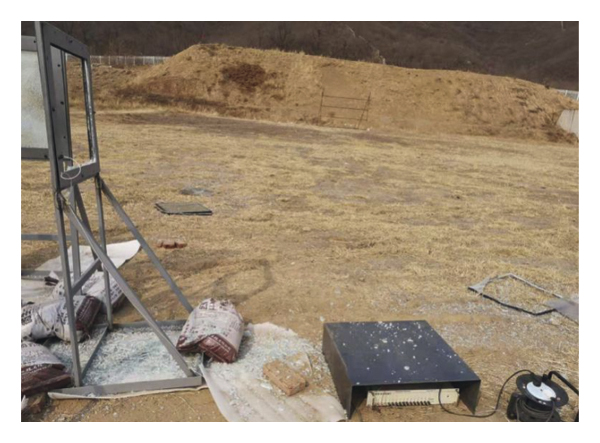
In the experiment, PCB pressure sensors are used to measure the value of shock wave overpressure, and a high-speed camera is used to record the breaking process of glass under different explosion loads. The explosive source used in the experiment is cylindrical TNT charge, each of which has a mass of 0.1 kg, and it is detonated by a detonator. First, the insulated glass is fixed on the glass support frame, and each piece of glass is marked, then the glass is placed around the explosion source with different distances and the distance from the explosion source for the next experiment will be adjusted according to the experimental results until the critical explosion distance for the completely broken state of the insulated glass is found. The overall layout of the experimental site is shown in Figure 2; the center of the glass has the same height as the explosion source; two pressure sensor probes are installed on different glass support frames, and a high-speed camera is placed at a certain distance from the explosion source to take pictures of the breaking process of one piece of glass.
2.2. Experimental Results and Analysis
2.2.1. Broken State of Insulated Glass and Its Flying Characteristics
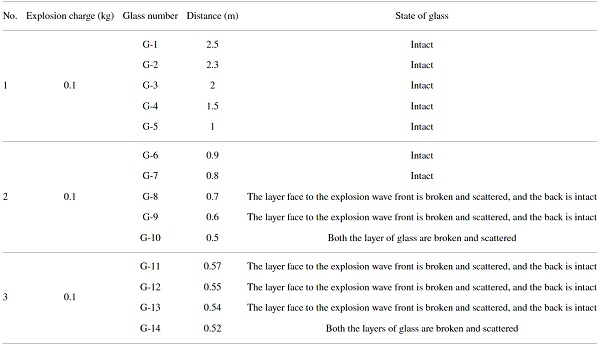
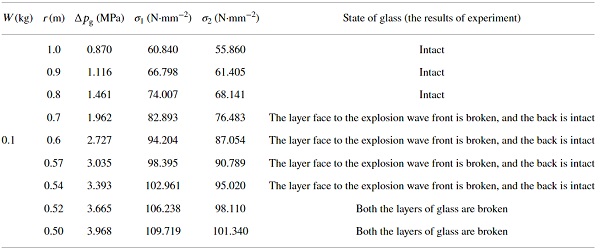
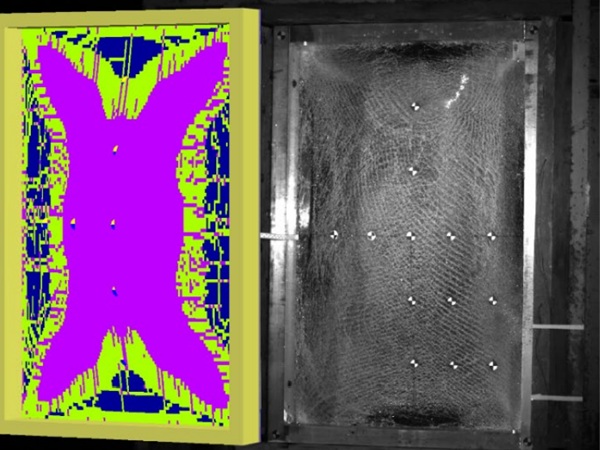
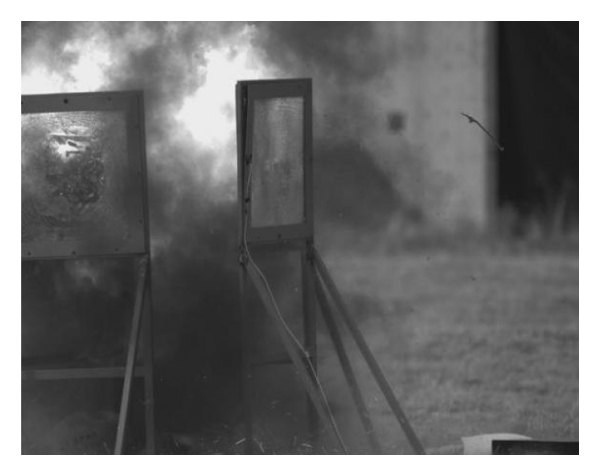
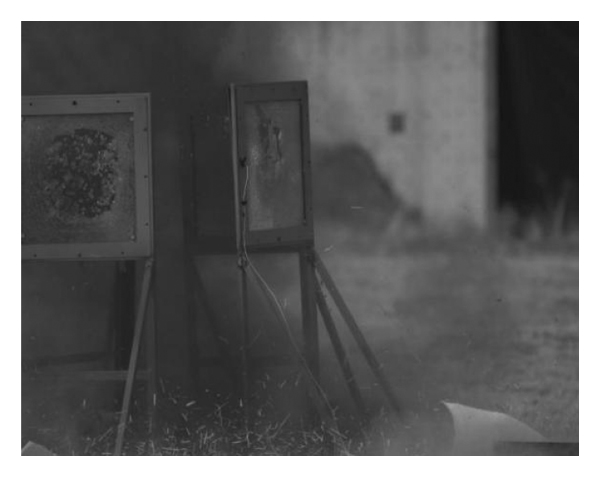
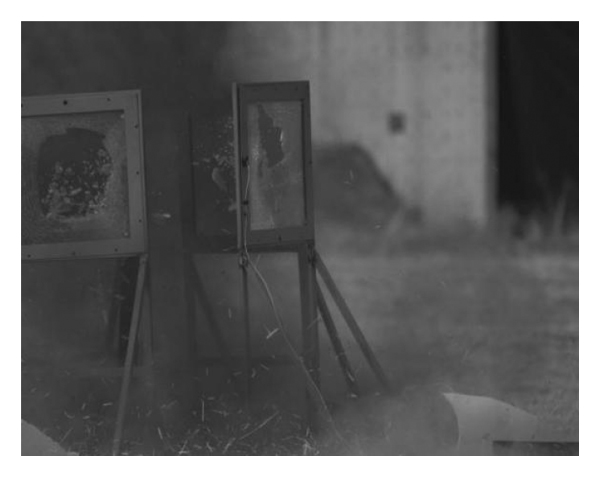
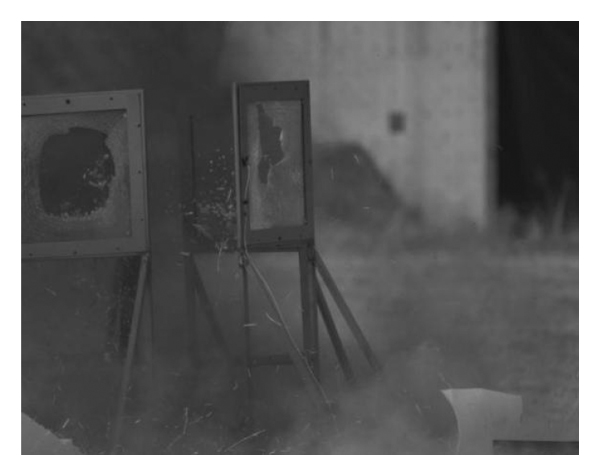
A total of three explosion tests are conducted according to the above experimental scheme. The specific test conditions and the corresponding broken states of glass are shown in Table 1. It can be seen from Table 1 that as the distance from the explosion source decreases, the layer of the insulated glass face to the explosion wave front breaks first and the layer back to the explosion wave front remains intact. The glass fragments scatter toward the center of the explosion source, as shown in Figure 3.
The reason is that when the blast wave load acting on the layer of the insulated glass face to the explosion wave reaches the tensile strength of the glass, the layer will break. When the shock wave passes through the crack from the first layer and reaches the second layer of the insulated glass, the reflection wave will be generated, which will push the fragments on the first layer to fly to the center of the explosion source. When the distance from the explosion source is reduced to 0.52 m, both of the front and back layers of the insulated glass are broken and the glass fragments fly outward along the direction of shock wave propagation, as shown in Figure 4.
Table 1. Test conditions and the broken state of glass. - Full size table
2.2.2. Explosion Shock Wave Overpressure Value
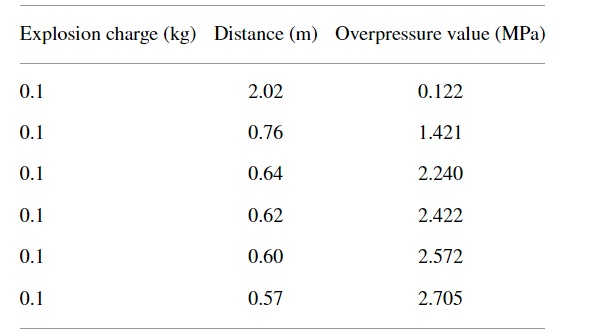
A total of six effective shock wave overpressure values are recorded in this experiment, as shown in Table 2. The following shock wave overpressure values are fitted, and the calculation formula of the actual overpressure peak value at the glass center under different working conditions in this experiment is obtained, as shown in formula (1) where ΔPg is the overpressure peak value on glass, MPa; W is the explosion charge (TNT equivalent), kg; and r is the distance from the explosion source, m.
Table 2. The test value of shock wave overpressure. - Full size table

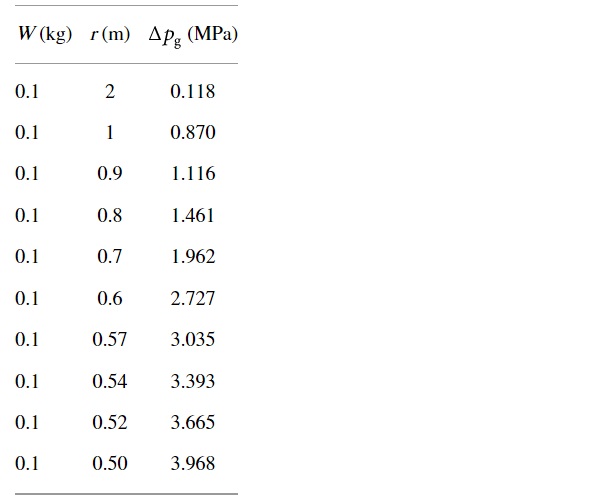
The fitting correlation coefficient is 0.99299. By this fitting formula, the shock wave overpressure value at the center of the insulated glass under different working conditions can be calculated, as shown in Table 3.
Table 3. The shock wave overpressure value at the center of the glass. - Full size table
3. Theoretical Verification of the Critical Overpressure Threshold of Insulated Glass
It can be seen from Table 1 that, when the TNT equivalent is 0.1 kg, the distance from the explosion source is between 0.7 m∼0.8 m for the single-layer face to the explosion wave front of the insulated glass breaking and the distance from the explosion source for complete breaking is between 0.52 m∼0.54 m. According to the overpressure value calculated by the fitting formula in Table 3, it can be determined that the critical overpressure value of the fracture of the layer face to explosion wave front of the insulated glass used in this experiment is between 1.461 MPa∼1.962 MPa, while the critical overpressure value of the complete fracture is between 3.393 MPa∼3.665 MPa.
The critical overpressure threshold of glass fracture is related to the structure, thickness, area, aspect ratio, and boundary conditions of the glass [21]. In order to verify the critical overpressure threshold of the insulated glass, the equivalent static load method is used to analyze the structural dynamic response of the insulated glass under the explosion load, and the elastic working stage of the glass is calculated according to the single-degree-of-freedom system.
The equivalent static load of insulated glass can be calculated according to the following formula [22, 23]:
![]()
where qₑ is the equivalent static load, N/mm², and Kd is the dynamic coefficient of the structural member.
When the waveform of the explosive dynamic load is simplified to a triangle without boost time, the dynamic coefficient of the structural member is calculated as follows:

where ω is the self-vibrating circle frequency of the equivalent single-degree-of-freedom system structural member, 1/s; t₀ is the equivalent action time of the dynamic load, s; and [µ] is the allowable ductility ratio of the structure or component, where the glass is taken as 1.
The equivalent action time of dynamic load t₀ on the insulated glass can be calculated as follows:

where if is the reflected shock wave impulse, Pa S, and it is calculated according to the empirical formula [24]. i⁺ is the positive phase impulse of shock wave, Pa S.
The self-vibrating circle frequency of glass can be calculated according to the self-vibration circle frequency of the flexure type of two-way wall (board):

where Ω is the frequency coefficient, which is 19.74 according to the installation method of insulated glass in this experiment. lₓ is the span of the wall (board), m. And it was taken as 0.6 m in this experiment. γ is the unit weight of the wall (board), kg/m³. The unit weight of tempered glass is 2500 kg/m³. h is the thickness of the wall (board), m.g is the gravity acceleration, m/s². D is the bending stiffness of the wall (board), N mm.
The bending stiffness of a single glass is calculated according to the following formula [25]:

where E is the modulus of elasticity, N/mm². The modulus of elasticity of the tempered glass is 7.2 × 10⁴ N/mm². ν is Poisson’s ratio of glass, and Poisson’s ratio of tempered glass is 0.20.
The equivalent thickness method [26] should be used when calculating the bending stiffness of insulated glass, and the equivalent thickness of insulated glass is derived from the assumption of equal deflection of the upper and lower layers of insulated glass [25, 27], that is,

Here, the reduction factor of 0.95 is taken for considering the existence of an air layer in the insulated glass; hₑq is the equivalent thickness of the insulated glass, m; and h₁ and h₂ are the thickness of the upper and lower layers of the insulated glass, respectively. The equivalent thickness of the insulated glass is 7.182 mm, calculated from formula (8).
The equivalent static load on the insulated glass can be obtained by using formula (2)∼(8), and the equivalent static load and the maximum stress distributed to two layers of glass are calculated, respectively, as follows:
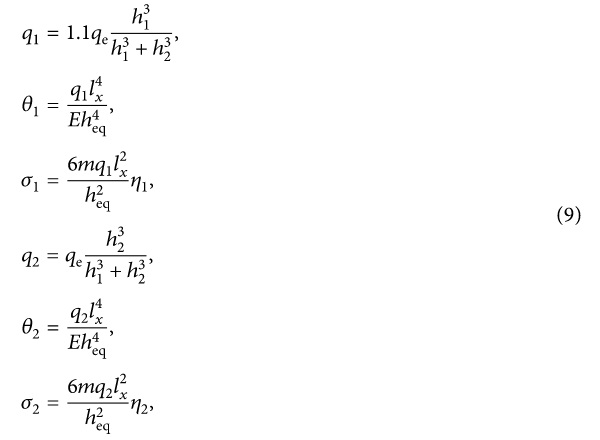
where q₁ is the equivalent static load on the layer of the glass face to the explosion wave front, while q₂ is on the layer of the glass back to the explosion wave front, N/mm². θ₁ and θ₂ are the parameters; m is the bending moment coefficient. When the ratio of the long side to the short side of the glass is 1, m is 0.0442 according to the table of bending moment coefficient in [25]; η₁ and η₂ are the reduction coefficients, which are determined by the table of reduction coefficient in [25], respectively.
According to the above calculation method, the maximum stress on the upper and lower layers of insulated glass at different distances from the explosion source under the explosion of 0.1 kg TNT equivalent explosive is calculated, which are compared with the experiment results of glass’s broken state. The results are shown in Table 4.
Table 4. Maximum stress on insulated glass under different working conditions. - Full size table
According to the design code (JCJ102-2003), the design tensile strength of tempered glass is 84 N/mm2 [25]. And the failure criterion of glass is that when the maximum dynamic stress on glass exceeds the design value of strength, the glass will break. However, the strength of the glass material itself is highly discrete [28], so the glass breakage often occurs within a certain range of the design value of strength. It can be seen from Table 4 that the experiment results of glass’s broken state are in good agreement with the theoretical calculation results.
4. Conclusion
When the single layer of the insulated glass face to the explosion wave front is broken, the fragments will fly to the center of the explosion source, and when it is completely broken, the fragments will mainly fly in the direction of shock wave propagation.
The critical overpressure value for the broken state of the layer face to the explosion wave front of the insulated glass is between 1.461 MPa∼1.962 MPa, while the critical overpressure value for the completely broken state is between 3.393 MPa∼3.665 MPa.
The theoretical calculation method based on the equivalent static load is used to verify the critical overpressure value of the insulated glass. The calculation results are in good agreement with the experiment results, which shows that the theoretical calculation method adopted in this paper can be used to evaluate the explosion-proof performance of the insulated glass. As a part of an ongoing research activity, the experimental results will be validated by numerical simulation, to further verify the feasibility of the theoretical calculation method.
Data Availability
All data included in this study are available from the corresponding author upon request.
Conflicts of Interest
The authors declare that there are no conflicts of interest regarding the publication of this paper.
Acknowledgments
This work was supported by the National Key Research and Development Program of China (No. 2018YFC0824005-2) and the Fundamental Research Funds for the Central Universities (No. 2020JKF311). Special thanks are given to professorate senior engineer Qingliang Shao for his helpful consultation in accomplishing this paper.

