
Date: 25 June 2026
But one result only tells you what one insulating glass unit contains at one point in time. What if you could see what your entire production line has been doing over the past week, month, or quarter?
That is exactly what the Sparklike Handheld Nova™ web application is designed for.
Beyond the Device Display
The Handheld Nova™ stores over 30,000 measurements onboard. The web application at nova.sparklike.com connects to the device over a wireless connection, downloads that stored data into your browser, and turns it into actionable production intelligence — with no installation required.
Once connected, five views give you a complete picture of your gas fill quality.
Check the differences between Sparklike Handheld 3.0 and Sparklike Handheld NOVA.
See the Trend, Not Just the Number
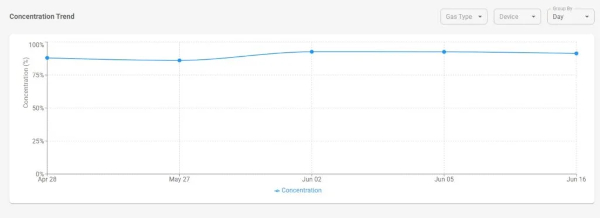
The Concentration Trend chart plots average gas fill percentage over time, grouped by hour, day, or week. This makes it easy to spot patterns that would be invisible when reading individual results: a gradual downward drift in fill level, a batch of units that consistently fell below specification, or a specific shift where results were more variable than usual.
For production managers and quality teams, this kind of visibility turns measurement data into a genuine quality control tool rather than a compliance checkbox.
Understand Your Distribution
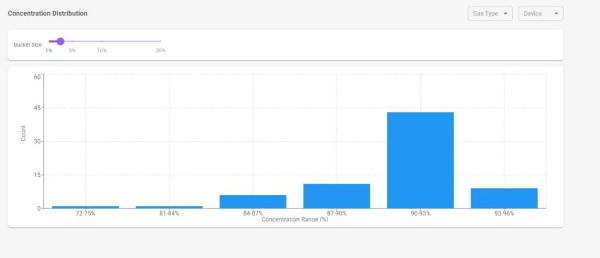
The Histogram view shows how your results are distributed across concentration ranges. Are the majority of your units clustered tightly around 92%? Or is there a wide spread from 80% to 95%? The bucket size is adjustable, so you can zoom in on fine detail or get a broad overview depending on what you need.
Systematic under-filling — even when no individual measurement triggers an alarm — becomes visible here before it becomes a warranty or energy performance issue.
Track Daily Measurement Activity
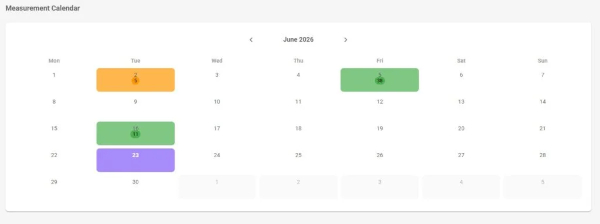
The Measurement Calendar gives you a month-by-month view of how many measurements were taken each day. If your production process requires a minimum daily measurement count for quality documentation, this is where you verify it at a glance. Colour-coded tiles make days with lower-than-expected activity immediately apparent.
Drill Down When You Need To
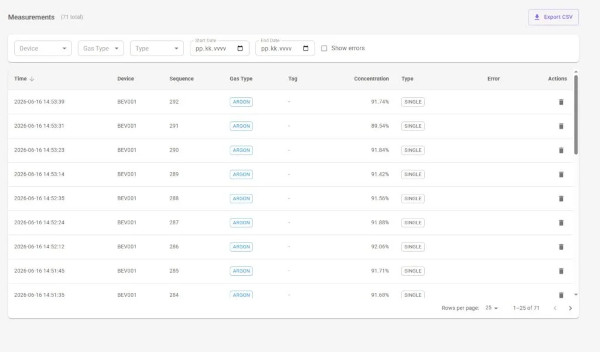
The Measurements table gives you the full record: timestamp, device serial number, gas type, concentration result, any errors, and barcode or QR tag information if your units carry traceability codes — for a closer look at how QR-based traceability fits into quality documentation, see Integrating Gas Measurement into Quality Documentation Systems.
The measurement type column indicates whether each result is a single reading of an individual insulating glass unit or an averaged result from multiple samples taken across the same unit — for a full explanation of how these modes work in practice, see Sparklike Handheld NOVA™ Measurement Features: Single and Multisample Modes Explained.
Filters let you narrow by device, gas type, date range, or errors only. When you need to share or archive the data, a single click exports everything to CSV.
One Application, Multiple Devices
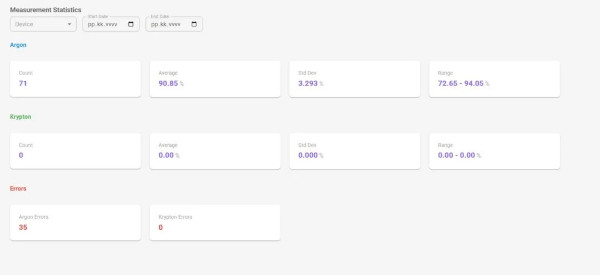
If you operate several Handheld Nova™ devices across a production line or multiple sites, the web application handles all of them. Data from each device is downloaded into the same browser and can be viewed together or filtered by device serial number. The Statistics section summarises count, average, standard deviation, and range for Argon and Krypton separately — giving you a fast overview of production quality across your entire fleet.
Putting It into Practice
The shift from “we measure gas fill” to “we understand our gas fill trends” is a meaningful one. It supports more informed decisions about filling equipment calibration, production process adjustments, and quality documentation, and it gives you the evidence base to act early rather than reactively.
The Sparklike Handheld Nova™ web application is available at nova.sparklike.com and works directly in Google Chrome or Microsoft Edge with no software to install.
For results to be meaningful at the trend level, they first need to be collected consistently. Read Sparklike Handheld NOVA™ Measurement Features: Single and Multisample Modes Explained for guidance on building a repeatable measurement process.
Discover Sparklike Handheld Nova
Ready to learn more about Sparklike Handheld Nova™?
Visit the Sparklike Handheld Nova™ product page for full technical specifications and capabilities, or download the brochure to share with your team.
 600450


")


Add new comment