
Authors: Linus Andersson, Marcin Kozłowski, Peter Persson, Per-Erik Austrell & Kent Persson
Source: Engineering Structures 256 (2022) 113988 | DOI: https://doi.org/10.1016/j.engstruct.2022.113988
Highlights
- Reduced modeling of soft-body impact on glass panels using dynamic substructuring.
- Nonlinear SDOF model proposed for modeling the EN 12600 standardized impactor.
- Experimental methodology for estimating the impactor damping presented.
- Validation of reduced models by detailed finite element model and experimental data.
- Efficient and accurate models for predicting pre-failure elastic response developed.
Abstract
In the paper, strategies for reduced order modeling of glass panels subjected to soft-body impact are developed by means of dynamic substructuring. The aim is to obtain accurate and computationally efficient models for prediction of the pre-failure elastic response. More specifically, a reduction basis for the subsystem representing the glass panel is established using correction modes, being fixed-interface component modes that considers loading on the substructure boundary. The soft-body impactor is effectively modeled by a nonlinear single-degree-of-freedom system, calibrated by experimental data. Furthermore, a simplified and computationally efficient modeling approach is proposed for the contact interaction between the glass panel and the impact body.
An experimental campaign was carried out to validate the developed models. In particular, the glass strain was measured on simply supported monolithic glass panels subjected to soft-body impact. Additional impact tests were performed to determine the dynamic characteristics of the impactor. Moreover, a detailed numerical reference model was developed to evaluate the discrepancy between the experimental tests and the results provided by the reduced order models. The developed models show good agreement with the experimental results. For the studied load cases, it is shown that an accurate prediction of the pre-failure glass strain can be obtained by systems including only a few generalized degrees-of-freedom.
1. Introduction
During the last few decades, glass has become an increasingly common building material in modern architecture. Glass is not only used for building enclosures and translucent facades allowing sunlight into the building, but also in load-bearing structures and glazed barriers, such as full-height façades and parapets for balconies or interior level changes.
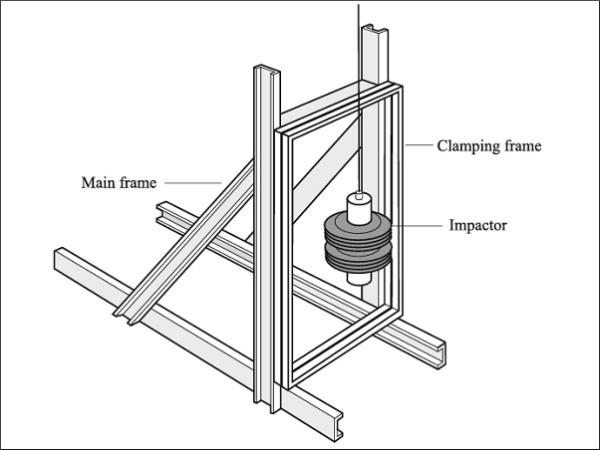
If the glass barrier constitutes a safety risk for building occupants, building regulations in most countries prescribes that the glazing must be designed to withstand accidental impact of humans. A dynamic verification is then required, usually performed by experimental testing using the standardized soft-body pendulum for glass classification according to the European Standard EN 12600 [1]. The test arrangement used for glass classification, shown in Fig. 1, consists of a glass panel fixed in a steel frame and a soft impact body on a pendulum, representing a human body falling towards the glass panel. Hence, a soft-body impact is considered, where the impact body is deformed under impact and thus redistribute the impact load.
Impact tests can be very costly, especially for large and complex glass structures. Furthermore, it can be difficult to set-up a test arrangement that accurately capture the structural behavior of the underlying load-bearing structure. Moreover, a structural verification using tests applied to the real structure can be both costly and requires a re-design of the existing structure if the load-bearing capacity turns out to be inadequate. Therefore, it can be preferable to instead perform the verification by means of dynamic calculation methods.
Beside a reduced cost and the possibility to easily evaluate different design concepts, numerical analyzes enable an increased insight into the structural behavior and additional control of e.g. structural and material parameters. In a physical impact test, however, the material parameters can vary depending on the specific glass specimen, why several tests are needed to adequately account for statistical variations. The validity of using numerical simulations for strength evaluation of glass structures have been shown by several researchers, see e.g. [2], [3], [4], [5].
Static load cases are often verified by means of a commercial finite element (FE) software. For this purpose, a specialized FE tool ClearSight [6] has been developed at the Department of Construction Science, Lund University, being streamlined for an interactive and efficient verification of glass panels subjected to static load cases. However, using an FE analysis to calculate the dynamic response due to impact can be time-consuming and computationally expensive. In general, a nonlinear transient response analysis is required, and the FE model should include the glass panel and its fixings, the impactor, and a suitable description of the contact interaction between the impactor and the glass structure. To set up and perform such an analysis can be time-consuming and often requires a relatively advanced FE software and extensive user knowledge.
To enable a more time-efficient and straightforward approach for evaluating dynamic load cases, reduced modeling techniques specialized for glass panels subjected to impact loading have been proposed by several researchers, see e.g. [7], [8], [9], [10], [11], [12], [13], [14]. For instance, in [7], reduction bases were successfully constructed using predefined load patterns, employed for reduced modeling of glass panels in a Rayleigh–Ritz fashion. In [8], various reduced models of unsupported glass panels subjected to low-velocity impact were investigated. For example, a three degree-of-freedom (DOF) spring–mass model was proposed, constructed by calibrating the system matrices to the strain energies and eigenfrequencies of the fundamental flexural modes of a glass panel in free–free conditions. Thus, the mode shapes are used implicitly for identifying eigenfrequencies and energies, which are then employed in a second stage for calibrating the lumped-mass systems.
Furthermore, a lumped mass model based on Hertz contact law (see e.g. [15]) was proposed for modeling the impactor. However, the low-velocity impacts studied in [8] were generated using a specialized spherical impactor, particularly suitable for approximation using Hertz law. Further, the reduced models were successfully validated by experimental studies, suggesting that the importance of higher order modes increases for larger glass panels and a stiffer impactor. In [10], a nonlinear SDOF model was proposed for modeling the impactor with a spring force expressed in terms of a quadratic polynomial. Further, the contact between the impactor tires and the glass panel was modeled by assuming a uniform contact stress applied on a contact area having a predefined elliptical shape, with a variable size governed by the impactor spring displacement.
This impactor model has also been implemented in the commercial finite element package SJ Mepla [16], where it is typically assembled with a glass structure represented by shell elements considering large deflection theory. A reduction on the glass substructure level is, however, not possible. In [11], a simplified engineering model based on equivalent static loads is presented, which enables a very quick and straightforward verification of impact loading. However, because the response of higher order modes is neglected, it is only applicable for two- and four-sided rectangular, continuously supported glass panels within a limited range of dimensions.
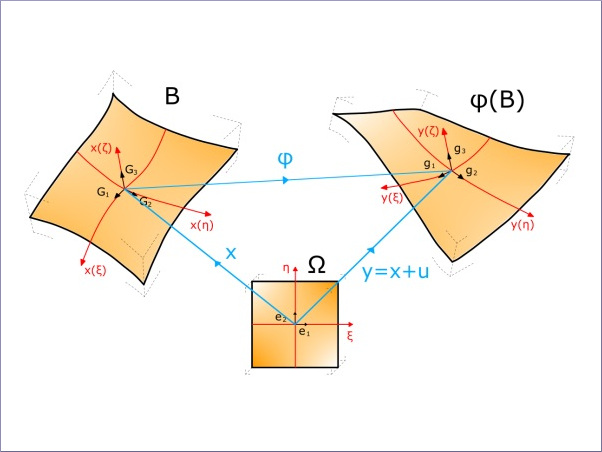
In the present paper, strategies for reduced order modeling of soft-body impact on glass panels are developed by means of dynamic substructuring (DS). The aim is to achieve an accurate prediction of the pre-failure elastic response while significantly reducing the computational cost. More specifically, a reduction basis for the subsystem representing the glass panel is established using correction modes, being fixed-interface component modes that considers loading on the substructure boundary [17], [18]. Because information related to the loading pattern is considered in the derivation, all the generated correction modes will, by definition, be excited by the applied load. In contrast, a reduced basis established using eigenmodes may include redundant modes, e.g. anti-symmetric modes that cannot be excited by a centric impact. The soft impact body is effectively modeled by a nonlinear viscous single-degree-of-freedom (SDOF) system, calibrated by experimental data.
Furthermore, a simplified and computationally efficient modeling approach, assuming a constant contact area, is employed for modeling the contact interaction between the glass panel and the impact body. The developed reduced order models are intended for analyzing glass panels with various support configurations. However, because a linear response is assumed for the glass substructure, second order effects (e.g. due to membrane action) is not considered. Thus, the proposed models are suitable for analyzing glass panels where the response is mildly influenced by second order effects or where an assumed linear response of the glass structure yields a reasonably conservative design.
![Fig. 1. Test frame with impactor according to the European Standard EN 12600 [1].](/sites/default/files/inline-images/Fig1_242.jpg)
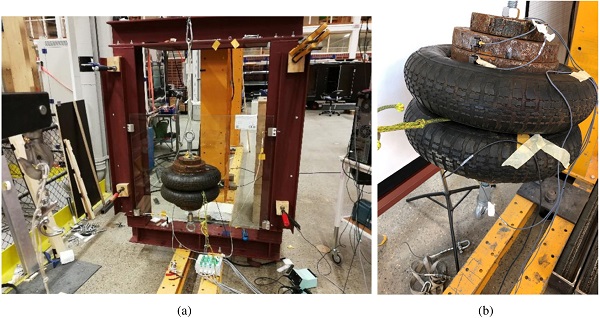
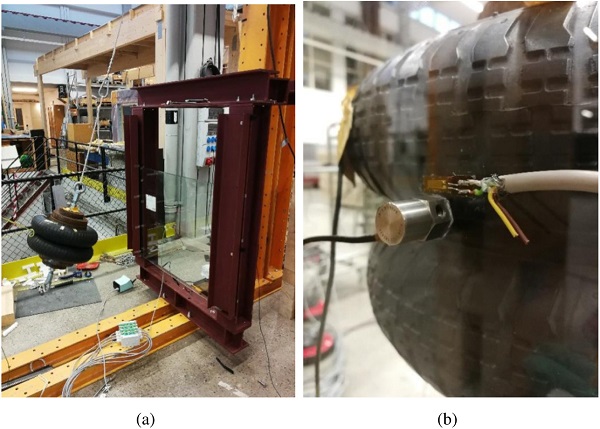
An experimental campaign was carried out to validate the developed models. In particular, the glass strain was measured on simply supported monolithic glass panels subjected to impact loading. The test arrangement was similar to the standardized impact test for glass classification described in EN 12600 [1]—the glass panels were mounted in a steel frame and impact loads were generated by releasing the standardized EN 12600 impactor from various drop heights. Additional impact tests on a very stiff steel column (which was considered rigid) were also performed to determine the dynamic characteristics of the impactor. The test arrangement and the standardized impactor employed in the experimental campaign are shown in Fig. 2.
To evaluate the differences between the measured glass strain and the strain provided by the reduced models, a detailed FE model, herein referred to as the reference model, was established using the commercial FE software Abaqus [19]. The reference model includes a penalty contact formulation to consider the interaction between the impactor and the glass panel, geometric nonlinearity, hyperelastic constitutive models for rubber, and a sophisticated modeling of the tire air pressure, aiming to mimic the impact tests. Evaluating the deviation between the response computed with the reduced models, the reference model and the experimental tests makes it possible to distinguish between errors related to modeling abstractions and simplifications employed in the reduced models and other, unknown error-sources.
To summarize, the aim of the paper is to:
- develop accurate reduced order models for computation of the pre-failure glass strain, suitable for implementation in user-friendly design tools,
- validate the developed models by experimental data,
- set up a detailed numerical reference model to get further insight into the structural behavior and to evaluate the discrepancy between measurements and the response computed with the reduced order models.
The paper is structured as follows. In Section 2, reduced modeling concepts for simulating soft-body impact are presented, including techniques for reduced modeling of the impactor, the glass panel, and the contact interaction. In Section 3, a detailed FE model of the standardized impactor is presented, herein referred to as the reference model, being used for calibration as well as validation of the reduced models. Experimental tests are presented and discussed in Section 4—both experiments involving testing of glass panels subjected to soft-body impact as well as tests to characterize the dynamic properties of the impactor. In Section 5, calibrations of the impactor models as well as a validation of the assembled reduced models are presented, both by comparison to experimental results and the response computed with the numerical reference model. Finally, the results are discussed in Section 6 and conclusions are presented in Section 7.
2. Reduced order models for analysis of soft-body impact on glass panels
Upon impact, contact is established between the glass panel and the impactor. Hence, a coupled system is formed consisting of the glass structure and the impacting body. Glass is a brittle material that is essentially linear elastic before failure [20]. Hence, if neglecting geometric nonlinearity, the pre-failure structural response of monolithic glass panels can be accurately represented by a linear model. It should be noted, however, that in some applications the influence of second order effects can be of considerable importance. For such cases, a nonlinear model representing the glass substructure is required for an accurate prediction of the glass strain. For example, the investigation presented in [7] shows that the influence of second order effects (i.e. membrane action) are significant for four-sided, continuously supported glass panels.
Moreover, the investigations suggest that the glass strain is overestimated if second order effects are neglected. A linear representation of the glass panel can thus be suitable if the response is only mildly influenced by second order effects or, arguably, in applications where an assumed linear response yields a reasonably conservative design. However, a nonlinear model may still be required to properly describe the contact interaction between the soft impact body and the glass panel, as well as the nonlinear behavior of the pneumatic tires. For such models, the coupled system can be reduced by means of DS, allowing for a reduction of the linear glass substructure while retaining the physical DOFs interacting with the soft impact body.
Several DS methods have been developed since the late 1960s, extensive reviews can be found in [21], [22], [23]. We base our approach on the Craig–Bampton (C-B) method [24], which preserves the physical boundary DOFs of the substructures. However, instead of using the fixed-interface normal modes, employed in the standard C-B method, a reduction basis for the glass substructure is established using correction modes that considers loading on the substructure boundary, see further Section 2.1. Furthermore, the impactor is effectively modeled as a nonlinear single-degree-of-freedom (SDOF) system, see Section 2.2.
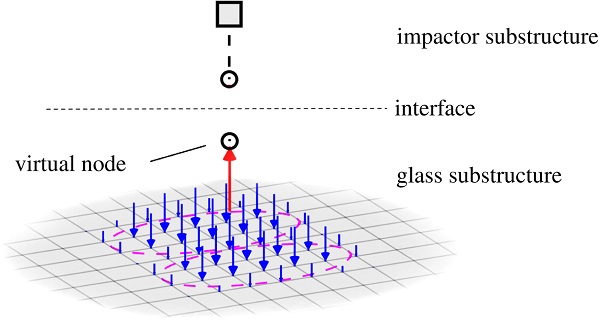
The subdivision of the coupled glass–impactor system into substructures is illustrated in Fig. 3. Interface reduction is applied, as further discussed in Section 2.3, such that only one virtual boundary DOF is retained for the glass substructure, corresponding to a weighted mean vertical displacement of a group of nodes considered to be in contact with the impactor tires (see Fig. 3). The reduced substructures are assembled in a standard manner to form a reduced model of the coupled system. Strategies for computing the dynamic response of the assembled system is further discussed in Section 2.4.
2.1. Reduced order modeling of glass panels
A reduction of a system including local nonlinearities, such as the coupled glass–impactor system, necessitates a DS technique that preserves the physical boundary DOFs. For example, the standard C-B method [24] or the MacNeal/Rubin approaches [25], [26], which uses the fixed- and free-interface normal modes, respectively, are suitable methods. The preferred method can be due to both accuracy and computational efficiency, which in turn considers both the computational cost of establishing the reduction basis and the number of variables required in the final system.
In the present study, a DS method that uses fixed-interface correction modes is employed for reducing the glass panel, an approach first proposed in [17] and later extended in [18] to enable a mixed usage of normal modes and correction modes (this method was also employed in [27] for establishing reduced models of concrete frame structures, where plastic joints were treated as local nonlinearities). For the glass–impactor system, this type of reduction basis turns out to be favorable both regarding the system size and the computational cost related to the computation of the reduction basis vectors. As shown in the derivation below, the correction modes are generated by a sequence of matrix–vector multiplications, whereas the fixed- or free-interface normal modes are computed by solving an eigenvalue problem.
Furthermore, information related to loading on the substructure boundary DOFs is considered in the derivation of the correction modes and, consequently, redundant modes that cannot be excited by loads applied on the substructure boundary are automatically excluded. Reduction bases including correction modes, also referred to as block-Krylov subspaces, can be derived in several ways. Following Rixen in [18], but excluding the fixed-interface normal modes in the reduction basis, the derivation is as follows.
Neglecting damping, the equation of motion for the glass substructure in partitioned form can be written as:

where the subscripts i and b denotes the interior and interface boundary DOFs, respectively (the number of interior and boundary DOFs is henceforth denoted ni and nb, respectively, and the total number of DOFs is thus n=ni+nb). Notice that, in this case, the virtual DOF interacting with the impactor model is selected as the interface DOF (cf. Fig. 3). Furthermore, if the external forces on the interior DOFs are zero, the top row of Eq. (1) can be rewritten as:
![]()
Hence, the substructure can be considered excited by imposed displacements on its boundary. Further, the internal displacements can be split into a static part and a dynamic correction
![]()
where ui, stat = −Kii⁻¹Kibub is the quasi-static solution, obtained from Eq. (2) assuming üi and üb are zero. The dynamic part, y, is added to the quasi-static solution to provide the dynamic response. Further, by inserting Eq. (3) into Eq. (2) and rearranging the terms, the dynamic response of y can be expressed as
![]()
where Y=MiiKii⁻¹Kib−Mib can be interpreted as inertia forces associated to static modes [18]. Thus, the acceleration of the boundary DOFs, the mode shapes and the mass distribution determines the forces applied in Eq. (4). This procedure can be continued by replacing y with a quasi-static solution and a dynamic correction z:
![]()
where ystat=Kii⁻¹Yüb is the static solution obtained from Eq. (4), assuming ÿ is zero. By inserting Eq. (5) into Eq. (4), and rearranging the terms, the dynamic response of z can be expressed as
![]()
Thus, the response of the interior displacements is given by a sequence of quasi-static solutions:
![]()
where, in a similar manner,
![]()
is the quasi-static solution of Eq. (6). Hence, a recursive procedure is obtained, indicating that the dynamic response can be approximated as
![]()
where l is the number of static corrections. Furthermore, the higher order derivatives
![]()
can be treated as separate DOFs. Hence, instead of computing a sequence of static corrections, a dynamic response analysis is conducted by means of generalized coordinates representing the amplitudes of the correction modes. The set of jth order correction modes are then given by:
![]()
where xcor,j is a ni×nb matrix, containing the correction modes generated in iteration j. Notice that each correction mode is associated to a boundary DOF. Consequently, a large number of boundary DOFs result in a large number of correction modes being generated in each iteration, why this method is best used in combination with an interface reduction technique (see further Section 2.3).
To avoid numerical round-off errors, the correction modes are generated using the modified Gram–Schmidt orthogonalization procedure [28], [29]. Furthermore, the static correction modes are not mutually mass- and stiffness orthogonal. This can e.g. be achieved by solving a small eigenvalue problem:
![]()
where Xik,cor=xcor,₁xcor,₂…xcor,l is the ni×k correction mode matrix, Λ is a diagonal matrix containing pseudo-frequencies and Z contains the corresponding eigenvectors, which are normalized such that
![]() .
.
An orthonormal basis of the correction modes is then provided by
![]() ,
,
and the relation between the substructure physical DOFs and the generalized coordinates q is given by

where qk is the amplitudes of the (orthonormal) correction modes and Ψib=− Kii⁻¹Kib is the internal part of the constraint modes, corresponding to the static displacement of a unit displacement on a boundary node while the other boundary nodes are held fixed. Using the transformation given by Eq. (11), the reduced system equations for the glass substructure is obtained by means of subspace projection in a standard fashion (see e.g. [23]), i.e.
![]()
where
![]()
Here, M, C and K are the un-reduced n×n system matrices and f is a n×1 external force vector. Further, for this procedure to be meaningful, the reduction basis should be established using a reduced set of generalized coordinates, i.e. k≪n.
Notice that the generated correction modes are in fact forming a Krylov sequence [28], why these are also referred to as Krylov modes. As indicated by Eq. (9), the modes can be generated by matrix–vector multiplications. Furthermore, the generated modes, as derived above, are force dependent in the sense that the substructure is considered loaded by imposed displacements on its boundary.
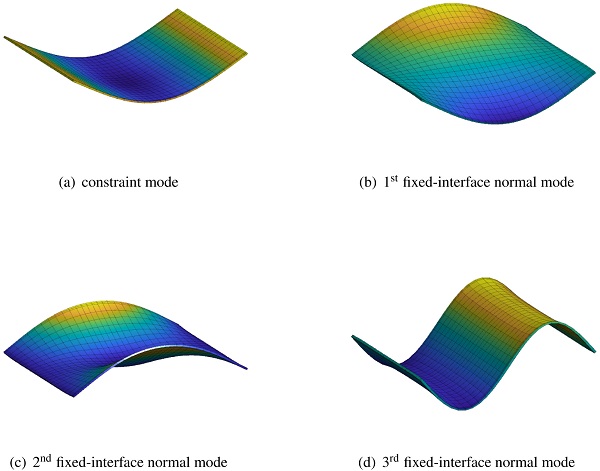
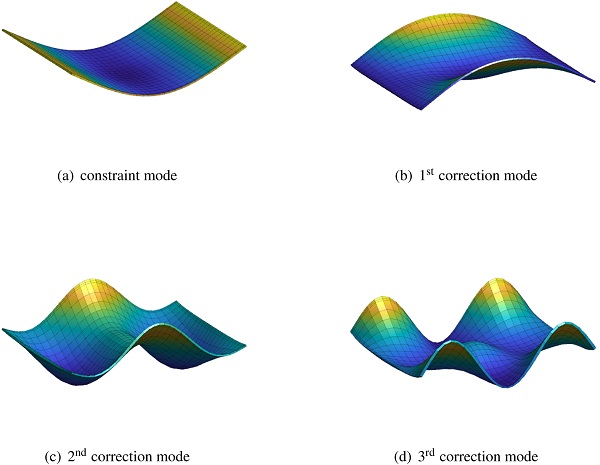
An example is presented in Fig. 4 showing the constraint mode and the first three fixed-interface normal modes for a simply supported 1000 mm × 800 mm glass panel. Further, Fig. 5 shows the constraint mode and the first three correction modes. One boundary DOF is considered, corresponding to the out-of-plane direction for the virtual node shown in Fig. 3. As shown in Fig. 4, two of the fixed-interface normal modes are anti-symmetric and cannot be excited by a vertical force applied at the center of the panel. On the contrary, all the correction modes will, by definition, be excited.
2.2. Reduced order modeling of the impactor
The standardized impactor, described in EN 12600 [1], consist of two pneumatic rubber tires and steel weights, as shown in Fig. 2b. The impactor mass is almost entirely concentrated to two rigid solids (i.e. the steel weights), positioned symmetrically around the impactor centroid. Consequently, the impactor can, when in contact with the glass panel, be well-represented by a generalized SDOF system. Hence, the impactor mass is lumped to a single DOF. However, due to the contact interaction between the tire and the glass panel, and the behavior of the pneumatic tires, the SDOF model can be expected to be nonlinear.
With inspiration from Hertz contact law [15], a nonlinear load–displacement relation of the following form was assumed:
![]()
Hence, an SDOF model consisting of a linear spring in parallel with a nonlinear spring. Furthermore, a stiffness-proportional viscous damping model was adopted, such that the damping force fd is proportional to the secant stiffness, i.e.
![]()
where β₀ and β₁ are factors that determines the amount of damping (i.e. a nonlinear Rayleigh β-damping). The damping factors and the unknown factors k₀, k₁, and α were calibrated using experimental data as well as results provided by the numerical reference model, see further Sections 4 Experimental testing, 5 Model validation. A similar nonlinear SDOF model was proposed in [10] which, however, is undamped and calibrated based on a polynomial expression (further, in [10], a reduction of the glass substructure was not considered).
Note that a linear dashpot model, independent of the displacement, result in an unrealistic damping force having its peak value just upon impact, when the impactor mass velocity has its peak value. Nonetheless, it is of interest to investigate the accuracy of a linear approximate model for the impactor, which enables the use of computationally efficient analysis techniques. Approximate linear models representing the impactor are further discussed in Section 5.1.
2.3. Coupling procedures and interface reduction
The impactor is modeled by an SDOF system, thus, only one DOF is to be connected to the glass panel substructure. Furthermore, the nonlinearity introduced due to contact between the impactor and the glass panel is partly integrated in the nonlinear impactor model, as described in Section 2.2. However, the distribution of the contact stresses determines which DOFs on the glass panel that should be included in the coupling.
Upon impact, contact is established and a small contact area is formed which gradually increases when the impactor kinetic energy is transformed into strain energy (and damping energy dissipation). Consequently, the contact area varies significantly during impact. Nonetheless, an approximate modeling approach assuming a constant contact area can be reasonably accurate, as e.g. demonstrated by the investigations presented in [7], [11]. Hence, instead of including a full description of the contact interaction the contact stress distribution θ(x,y) is assumed constant while the total contact force Fc(t) varies through time, i.e.
![]()
where σc is the contact stress and ∫θ(x,y)dA=1.
Furthermore, it is reasonable to assume that an approximation that underestimates the contact area in general overestimates the peak-strain in the glass panel, since the contact pressure can then be expected to be larger. Accordingly, a more realistic peak-strain can be obtained if a somewhat larger “best-estimate” contact area is chosen, assuming that the peak-strain occur at a point in time when the contact area is relatively large.
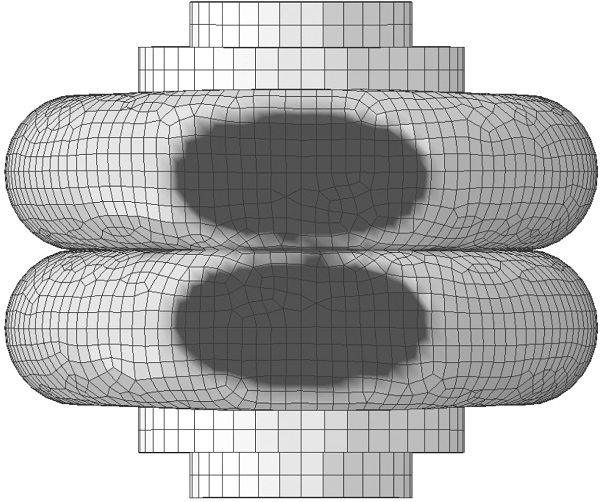
An example of the shape and size of the contact area computed with the numerical reference model (see further Section 3.1) is shown as dark-gray colored elliptical area in Fig. 6. Based on the results provided by the reference model, the contact area in the reduced models is assumed to have the shape of two ellipses, shown with purple dashed lines in Fig. 7. The major and minor radius of the ellipses are set to 90 mm and 50 mm, respectively. These values are assumed to correspond to the contact area developed when the glass strain reaches a peak value. However, the contact area varies both in time and for different load cases, thus, the specified values should only be regarded as rough estimations. Furthermore, a uniform contact stress is assumed within the predefined contact area. In [10], the contact interaction is modeled using a similar approach. In particular, a uniform contact stress and elliptical contact surfaces are assumed. However, in [10], the glass panel physical DOFs are retained in the final system, while such an approach is more computationally expensive it allows for an update of the contact area size in a direct time-stepping scheme.
The simplified modeling approach described above was implemented by means of a multi-point constraint (MPC) where the interface forces between a master DOF and a group of slave DOFs are controlled using weight factors. This type of constraint can e.g. be found in Abaqus [19], where it is referred to as a distributed coupling. However, because no detailed information describing the implementation have been found, a proposal of how to enforce such a MPC constraint is presented herein. For simplicity, and the fact that only one master DOF is present, a one-dimensional MPC is considered (i.e. only interface forces perpendicular to the glass panel are considered). The MPC constraint, as described below, was implemented in Matlab.
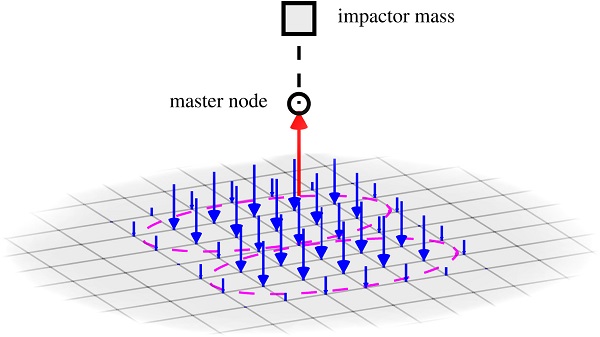
The basis in the MPC method is the requirement that the sum of the interface forces acting on the slave DOFs is equal to the interface force acting on the master DOF, cf. Fig. 7. This requirement is not that restrictive and can in principle be fulfilled by any interface force distribution, as long as equilibrium is maintained. As shown further below, this is also why this method allows for customized interface force distributions.
Assume that a set of weight factors wi, related to the MPC slave DOFs, are normalized such that
![]()
where p is the number of slave DOFs. Further, the constraint is enforced so that the displacement of the master DOF is the weighted mean value of the slave DOFs [19], i.e.
![]()
which implies that the displacement associated to slave DOF i can be expressed as:
![]()
Hence, one DOF is redundant and can be calculated based on the displacements of the other DOFs included in the MPC. Further, Eq. (18) can be expressed in matrix form
![]()
where B is a vector containing the normalized weight factors ŵi at entries corresponding to slave DOFs, a negative one at the entry corresponding to the master DOF and zeros in the remaining entries. The size of B is 1×ñ, where ñ=n+1 (thus, one master DOF is added to the glass panel substructure having n DOFs).
The displacement can be partitioned in a set of unique uu and redundant ur DOFs [21]. If slave DOF p is chosen as the redundant DOF, then ur=up⁽ˢ⁾ and uu = 0 u⁽ᵐ⁾ u₁⁽ˢ⁾ … uₚ₋₁⁽ˢ⁾. Hence,

where Bu= [0 −1 ŵ₁ … ŵₚ₋₁] and Br=ŵₚ. By rewriting Eq. (20), the redundant displacement can be expressed as
![]()
Thus, the displacement vector can be expressed in terms of the unique displacements,
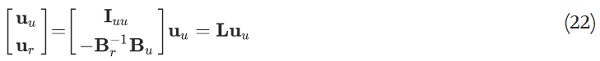
where L is a ñ×n transformation matrix.
The equation of motion for a linear system, including the redundant DOFs, can be written as:
![]()
where M, C and K are the ñ×ñ mass, damping and stiffness matrix, u is the ñ×1 displacement vector, f is the ñ×1 external force vector and g is a ñ×1 interface force vector, which is included due to the presence of MPCs. Now, inserting the transformation according to Eq. (22) in Eq. (23) and pre-multiplying with L⊤ yields:
![]()
thus,
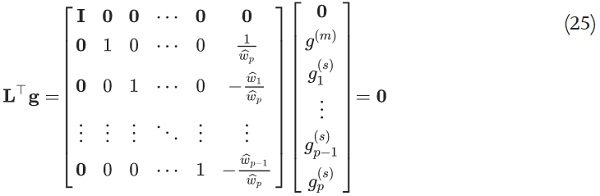
where we use that
![]()
As indicated by Eq. (25), the weight factors control the distribution of the interface forces acting on the slave DOFs. For example, Eq. (25) implies that
![]()
and, in general,
![]()
Further, according to Eq. (16), the weight factors are normalized, which implies that
![]()
Hence, equilibrium is maintained. Moreover, it should be noted that the above formulation allows for arbitrary weight factors, e.g. to consider a non-uniform interface force distribution or a non-uniform element mesh.
2.4. Dynamic response analysis
In the experimental tests, the pendulum impactor is released from a specific drop height and starts a swing motion until, at its lowest point, impact with the glass panel. The numerical analyzes are initiated just upon impact. Thus, the dynamic response of the glass–impactor system is obtained by solving an initial value problem—the external forces are zero and an initial velocity is prescribed to the impactor. The initial velocity v₀,imp is computed based on the pendulum drop height:
![]()
where g is the gravitational acceleration and h is the drop height. Using this approach, the impactor angular velocity is assumed negligible which is reasonable considering that the length of the pendulum employed in the experimental campaign was approximately 2 m. (If assuming rigid body motion it follows that the ratio between the linear and rotational kinetic energy upon impact is given by Eω₀/Ev₀=I/(mL²) < 1%, where m and I are the impactor mass and moment of inertia, respectively, and L is the distance between the impactor center of mass and the pendulum fixed point.)
Solution methods for both linear and nonlinear systems are investigated. Furthermore, only the first phase, when there is contact between the impactor and the glass panel, is considered.
2.4.1. Linear systems with nonclassical damping
If the coupled impactor–glass structure is approximated using a linear model with classical damping, a closed-form solution is straightforward to obtain by means of modal expansion techniques applied to the assembled system [29]. However, this approach is in general not feasible for systems with non-classical (also referred to as non-proportional) damping since a projection of the system equations onto a modal basis would then not result in a diagonal damping matrix. According to Section 5.1, the damping ratio of a linear impactor model can be estimated to be about 5%, whereas the damping ratio of the simply supported glass panels is approximately 1.7%, as discussed further in Section 4. Thus, the damping of the assembled system is indeed non-proportional and, consequently, a traditional modal analysis cannot be utilized.
Nonetheless, a closed-form solution can be achieved. For example, by means of the complex damped eigenmodes using a state-space formulation (see e.g. [30]) or by use of the so-called modal strain energy (MSE) method, which is an approximate method to account for non-proportional damping [31], [32]. An advantage using the MSE method compared to a state-space formulation is that the number of system variables are halved and that imaginary variables can be avoided. Furthermore, the numerical investigations presented in [32] suggests that the MSE method is accurate for systems with damping less than approximately 20%, thus, it can be assumed sufficiently accurate for the studied glass–impactor system.
The damping ratio of an SDOF system representing a modal coordinate can be expressed as:
![]()
where ED is the one-cycle modal energy loss due to viscous damping and ES is the modal strain energy amplitude, given by:
![]()
where Kˆ is the mˆ×mˆ global stiffness matrix, representing the coupled impactor–glass system, and ϕⱼ is the eigenvector for mode j, obtained by solving the generalized eigenvalue problem:
![]()
where ωⱼ is the corresponding eigenfrequency. Notice that the elements of the eigenvectors includes physical as well as generalized DOFs.
In accordance with the MSE method, the modal energy loss is computed as:
![]()
where ωⱼ is the eigenfrequency for mode j and Cˆ is the mˆ×mˆ global damping matrix, containing the damping submatrices related to the glass and impactor, respectively. It follows that the modal damping ratio for mode j can be computed as:

where Mˆ is the mˆ×mˆ global mass matrix.
As in a traditional modal decomposition applied to systems expressed in terms of physical DOFs, a linear system reduced by means of DS can be expressed in modal coordinates:
![]()
where ηⱼ is the modal coordinate for mode j.
If neglecting damping, the system equations can be diagonalized by projecting the system onto the modal basis:
![]()
where Φ = [ϕ₁ ϕ₂ … ϕmˆ] is the modal matrix and η = [η₁ η₂ … ηmˆ]ᵀ is the modal amplitudes. Hence, a set of mˆ uncoupled differential equations, which can be solved independently, is obtained.
Now, by introducing the modal damping ratios determined by means of the MSE method, and assuming that the external force is zero, each modal response is given by:
![]()
where ζⱼ is the damping ratio for mode j and ωⱼD=ωⱼ√1−ζⱼ² is the jth natural frequency with damping [29]. In contrast to a traditional modal response analysis, which commonly uses a truncated modal basis, it is in this case reasonable to include all mˆ modes in the modal basis because a reduction has already been performed on the substructure level. Hence, the modal analysis is primarily employed for diagonalizing the system matrices, not for reducing the system size.
In a standard modal analysis, the modal damping matrix is in general constructed directly in the modal domain by means of modal damping ratios, e.g. provided by experimental tests. However, using the MSE method, the global damping matrix Cˆ, containing the damping submatrices, is required. The SDOF model representing the impactor uses stiffness-proportional damping, as discussed in Section 2.2. Hence, if considering a linear impactor model, viscous damping is modeled by a ordinary dashpot. The damping matrix related to the glass panel is constructed by means of Rayleigh-damping, i.e.
![]()
where α and β are the Rayleigh damping parameters [29]. The glass panel damping is further investigated in Section 4 and the calibration of the Rayleigh parameters is discussed in Section 5.
By using the above methodology, a closed-form solution is obtained for initial value problems of linear systems even though non-proportional damping is present. Notice, however, that the above procedure is indeed an approximation due to that possible off-diagonal terms is not considered in the modal damping matrix given by ΦᵀCˆΦ.
2.4.2. Direct time-integration of nonlinear systems
The dynamic response of the nonlinear systems is solved using implicit direct time-integration. For the reduced models, direct time-integration is performed using Newmark’s method [29]. The Newmark parameters are set to β=1/4 and γ=1/2 resulting in a unconditionally stable system, which is convenient when solving a nonlinear system. Further, force equilibrium in each time increment is established by means of Newton–Raphson iterations [29].
3. Numerical reference model
A detailed FE model of the impactor was established using the commercial FE analysis software Abaqus [19]. The response computed with the reference model complements the experimental results in a validation of the reduced models (see further Section 5.3). Furthermore, the FE model provides insight into the impactor structural behavior and its interaction with the glass panel, which is vital knowledge in the process of deriving and evaluating a reduced model.
Furthermore, a FE model of the glass panel was developed, employed both in the Abaqus analyzes including the impactor reference model and for generating system matrices, being necessary in the process of establishing reduced models representing the glass panel. The FE model of the glass panel was modeled in Abaqus. However, to get full access to the FE procedures a separate, but in practice equivalent, FE model was made using Matlab.
3.1. Impactor
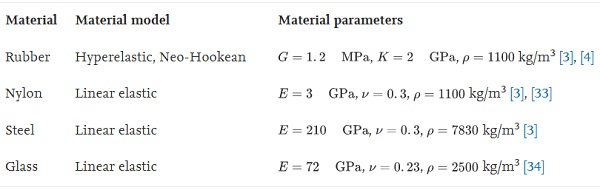
The impactor rubber tires are pneumatic bias-ply tires which consist of rubber reinforced by nylon ply-cords, usually in an angle ± 30°–40°from the direction of travel, with each additional ply positioned in opposite direction [4].
In Abaqus, the nearly incompressible rubber material was modeled using a hyperelastic model. The strains in the rubber turns out to be relatively small (< 20%), why a Neo-Hookean model, with parameters according to Table 1, is judged to be sufficiently accurate. The rubber tires were modeled by four-node shell elements and the nylon cords were modeled using so-called rebar layers, a feature in Abaqus that allows for specifying orthogonal or skew reinforcement embedded in shell or membrane elements. Hence, the nylon cords are not modeled by separate elements, but is rather modeled as a smeared rebar layer positioned at the shell element reference surface. The cords diameter was set to 0.45 mm with spacing 1.6 mm, in accordance with [3]. By an optical investigation of a cut of a tire, the thickness of the rubber was estimated to 5 mm.
An accurate model of the stiffness distribution of the nylon ply-cords is important for a realistic behavior of the tire model. The pressure exerted by the contained air is mainly balanced by tensile stresses in the nylon cords having a stiffness several order of magnitude larger than the rubber (even when considering the difference in cross-section area). Therefore, the stiffness of the inflated tires is primarily due to prestressing of the nylon ply-cords and, consequently, the angle of the nylon cords have a relatively large effect on the structural behavior. However, data for the nylon cord angle for the specific tires used in this study were not available. Instead, the angle was determined by comparison of the deformed shape of the actual tire, when inflated and non-inflated, with the deformed shape given by a quasi-static analysis of the tire inflation. Based on this comparison, the angle was estimated to be 40°.
The tire air pressure was modeled using a feature in Abaqus denoted fluid cavity, which considers the coupling between the deformation of the tire structure and the pressure exerted by the contained air. Using this modeling approach, only the quasi-static air pressure is considered, whereas the dynamic pressure is ignored. An overpressure of 4.07 bar was prescribed in the undeformed configuration to obtain an air pressure of 3.5 bar in the deformed configuration.
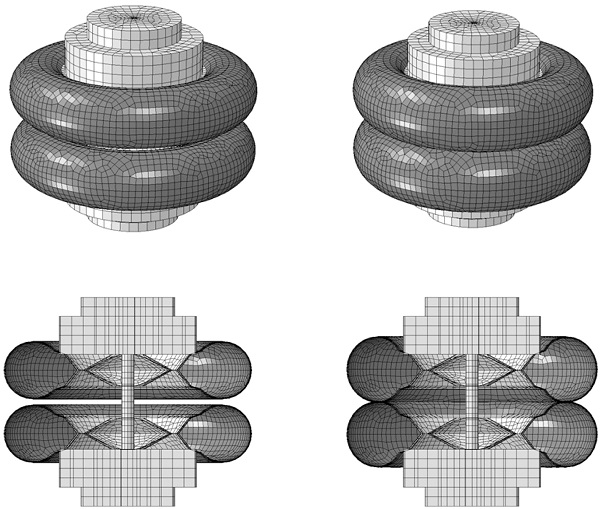
The steel weights, rims, and the screw spindle (the axis connecting the two weights) were modeled using linear elastic material properties according to Table 1. In principle, the weights can be modeled as rigid bodies since these are much stiffer than the tires. However, the deformation of the rim and the screw spindle might not be negligible. Also, the off-center location of the weights causes the screw spindle to bend, which in turn effects the deformation of the tires. To consider a possible influence of these effects the steel weights and the screw spindle were modeled by eight-node solid elements, whereas the rim was modeled with four-node shell elements. The impactor model mesh, for both the undeformed and inflated configuration, is shown in Fig. 8.
A viscous stiffness-proportional damping was calibrated to the energy loss measured in the impact tests, as discussed in Sections 4 Experimental testing, 5.1 Calibration of impactor models. Moreover, a contact interaction was prescribed between the tires, with a friction coefficient of μ=0.7 in accordance with [4].
Table 1. Material models employed in the reference model.
3.2. Glass panel
The glass panel was modeled with solid shell elements, which uses an assumed strain distribution for an enhanced modeling of bending [35]. An advantage using these elements compared to conventional shell elements is that no special treatment is needed to consider offsets of loads or prescribed boundary conditions. An evaluation of using solid shells for modeling glass panels is e.g. presented in [36].
The supporting steel frame was assumed rigid and the EPDM rubber strips positioned between the glass and the steel were modeled by linear elastic spring beds. In the experimental set-up, the rubber along the supports were prestressed due to bolting of the glass panels, which affect the rubber stiffness. Therefore, the stiffness of the spring beds were calibrated based on the fundamental frequencies as measured for the 8, 10 and 12 mm, respectively, simply supported glass panels. Using this approach, the stiffness of the rubber strips, modeled with a thickness of 10 mm and a width of 15 mm, was estimated to 10 MPa (the glass geometry, density, and stiffness, which also affect the fundamental periods, are thus regarded as relatively well-known parameters). The in-plane stiffness of the rubber strips was modeled in a similar manner using elastic springs.
In accordance with the measurements discussed in Section 4, a damping ratio of 1.7% was assumed for the glass panels being modeled by means of Rayleigh α- and β-damping. The derivation of the Rayleigh parameters is further discussed in Section 5.
4. Experimental testing
Experimental tests were performed to validate the reduced models. In particular, the strain was measured on simply supported monolithic glass panels with dimensions 1000 mm × 800 mm, made of regular soda-lime silicate toughened glass. The glass panel impact tests were part of an experimental campaign summarized in [37], [38], which includes additional tests of glass panels mounted with various fixing methods, such as linear clamps, local clamp fixings and point fixings. Moreover, glass with different heat treatment as well as glass laminated with different materials were also tested.
Additional measurements were performed to identify the dynamic characteristics of the impactor. The dynamic properties of the impactor, such as the dynamic stiffness and damping turn out to have a large impact on the dynamic behavior of the coupled impactor–glass system. Also, an increased insight into the structural behavior is essential in the process of developing reduced models, to ensure that no significant characteristics of the system are lost in the reduction process.
4.1. Dynamic characteristics of impactor
The impactor design is described in [1], where the impactor parts are specified in detail. The tires should be of the type 3.50-R8 4PR (by Vredestein) or tires that are demonstrated equivalent. In the present study, two Michelin 3.50-S83 tires were used (see Fig. 9b), which were also used in the experimental tests presented in [3]. The inflation pressure is 3.5 bar and the total weight of the impactor is 50 kg.
The impactor damping and stiffness were evaluated based on impact with a very stiff steel column, which can be considered rigid. The impactor acceleration was measured at several locations on the impactor weights, as shown in Fig. 2b. Similar tests were also performed in [3]. However, the tests performed in the present study also included an estimation of the impactor damping. More specifically, the difference between the maximum height of the impactor after impact h₁ and the initial drop height h₀ was measured. Hence, the energy loss during impact (ΔE) was estimated as
![]()
The measurement of the impactor position was performed by recording the impact sequence on video at a frame rate of 240 frames per second, sufficiently high to enable a smooth slow-motion video. Before the impact tests were performed, a physical measurement-grid was positioned in the plane of the pendulum, filmed at the same angle and position as the impact tests. This measurement grid was then used to calibrate the measurements performed directly in the slow-motion videos. Tests were preformed with an impactor drop height of 100, 200, 300, 450 and 700 mm, respectively.
Table 2. Impactor rigid impact energy loss.
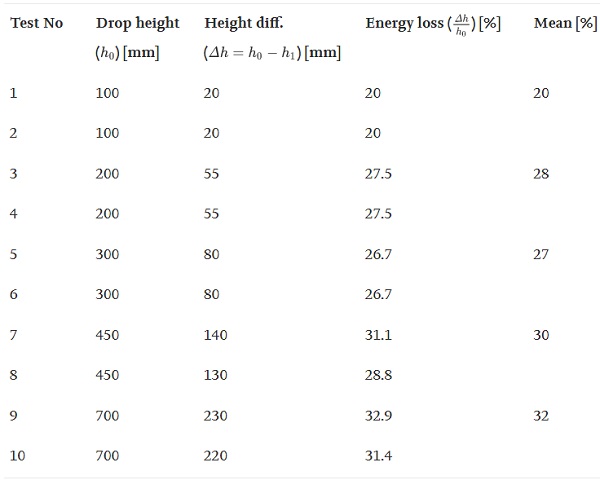
The experimental results and the estimated energy loss, which in turn determines the damping, is presented in Table 2. Note that the experimental methodology implies that the mass of the impactor weights can be assumed sufficiently large such that the system can be well-represented by an SDOF system when in contact with the rigid wall and a rigid mass floating in space when contact is not established. Furthermore, the kinetic energy related to the impactor angular velocity is assumed negligible being reasonable given that the pendulum length is approximately 2 m.
4.2. Soft-body impact on glass panels
Experimental results from impact tests of two-sided simply supported glass panels, as shown in Fig. 9a, was used for validation of the reduced order models. The glass panels consist of toughened monolithic glass with nominal thickness 8, 10 and 12 mm, respectively. As described in [38], the horizontal strain was measured by a strain gauge bonded at the rear side (tensile side) of the glass panels at the point of impact, see Fig. 9b. Impact tests were conducted with a drop height of 100, 200, 300, 400 and 500 mm, respectively.
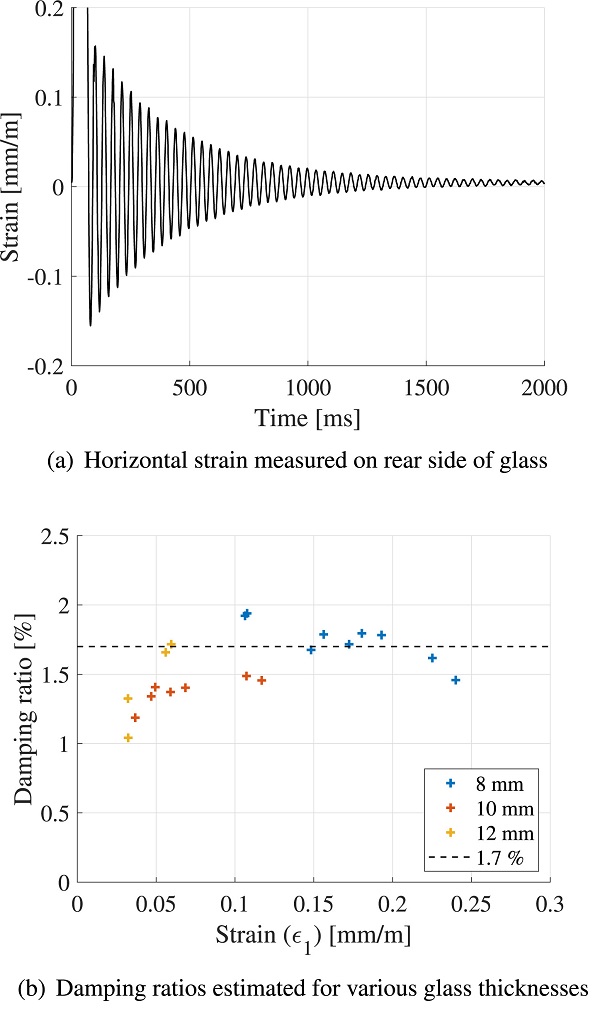
The signal from the strain gauge was logged at a frequency of 600 Hz for a few seconds. However, the impactor contact time is typically less than 80 ms. Hence, the logged strain data includes the decay of motion after impact, which was utilized for estimating the damping of the glass panels and its fixings. An example of the logged strain data is shown in Fig. 10a. Further, the logarithmic decrement is given by:

where uᵢ is the amplitude measured at cycle i, n is the number of cycles between the measured amplitudes and ζ is the damping ratio. If assuming linear elasticity, the displacement amplitudes in Eq. (38) can be replaced by the measured strain amplitude. The estimated damping for some of the tests is presented in Fig. 10b. The horizontal axis denotes the strain amplitude measured at cycle i, corresponding to uᵢ in Eq. (38). As shown in the figure, the damping ratio does not vary much with neither the glass thickness nor the amplitude. However, it should be noted that the strain amplitude is fairly low in all the measurements, i.e. less than 0.25 mm/m. Based on the data from the impact tests, the damping ratio of the glass and its fixings was estimated to 1.7%. This is slightly larger than the damping ratios reported in e.g. [39], [40] where, however, different test arrangements were used.
In addition to the estimation of the glass panel damping ratio, the measured strain due to free vibration after impact was used for estimation of the fundamental periods of the simply supported glass panels. Note that the glass strain, which is measured in the center of the glass panel, is mainly due to vibration of the fundamental mode. For glass panels with thickness 8, 10 and 12 mm, respectively, the fundamental period was estimated to 46, 37 and 31 ms, respectively.
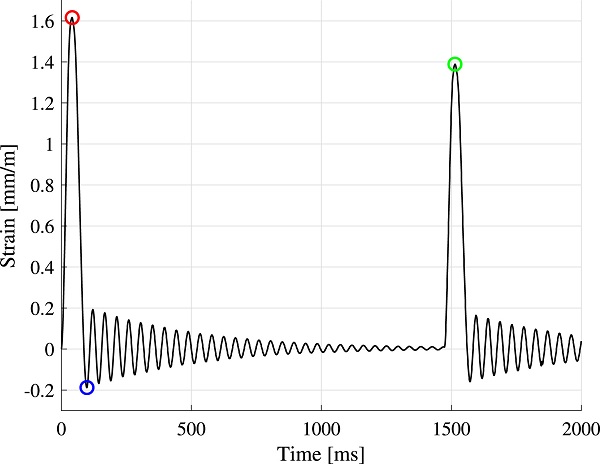
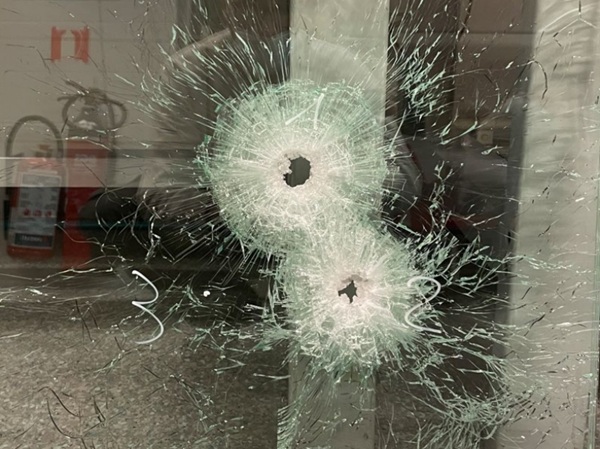
Finally, the strain was measured in a double impact test, as shown in Fig. 11. More specifically, the soft-body pendulum was released and the glass strain was measured during the first as well as the second impact, by letting the pendulum move freely after the first impact until a second impact was initiated. Using this procedure, the impact energy in the second impact approximately corresponds to the impactor kinetic energy after the first impact. This test was done for one impact test: the 8 mm glass panel subjected to an impact corresponding to a drop height of 200 mm. The measured strain was exploited to implicitly estimate the energy loss during impact for the whole system. This includes energy dissipation due to deformation of the impactor (e.g. frictional or viscous damping), through frictional effects due to contact, and deformation of the glass panel and its fixings.
If assuming linear elastic behavior, the response can be obtained by solving an initial value problem of a linear system. As implied by Eqs. (33), (35), the displacements of such a system is linearly dependent on the initial velocity. Accordingly, the displacements are quadratically dependent on the initial kinetic energy of the impact body EK,0, given by
![]()
It follows that the square of the ratio between the peak strain in the first and second impact is proportional to the ratio between the kinetic energies induced in the system upon the first and second impact, respectively. Hence,
![]()
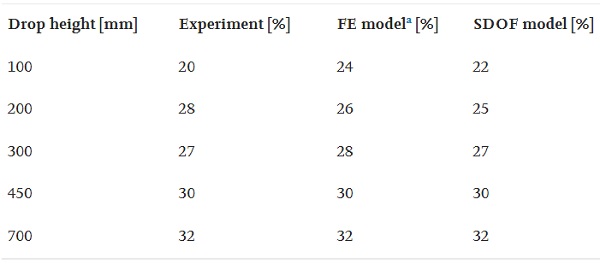
where ε⁽¹⁾ and ε⁽²⁾ are the strains measured for the first and second impact, and EK,0⁽¹⁾ and EK,0⁽²⁾ are the kinetic energy just before the first and second impact, respectively. From the measured peak strains according to Fig. 11 (red and green circle), the ratio between the kinetic energy in the first and second impact can be estimated to (1.386/1.616)²=0.74. Thus, the energy induced in the system upon the second impact is 74% of the impact energy in the first impact and, accordingly, the energy loss is approximately 26%. This is fairly close to the energy loss measured in the rigid impact tests, shown in Table 3, which may indicate that the energy dissipation related to the deformation of the glass panel is fairly small.
However, it should be noted that the energy loss computed from a double impact test using the above procedure is in principle only valid for linear systems, why it should only be regarded as a rough estimate. Moreover, some of the induced energy is not dissipated during the impact but instead causes the glass panel to oscillate after impact. The glass panel strain energy is related to the square of the glass strain. Accordingly, a strain energy ratio can be estimated based on the peak strain during impact and the peak strain after impact. Using the measured strains according to Fig. 11 for the first impact (red and blue circle), the strain energy ratio is (0.1925/1.616)²=1%, which principally is negligible.
5. Model validation
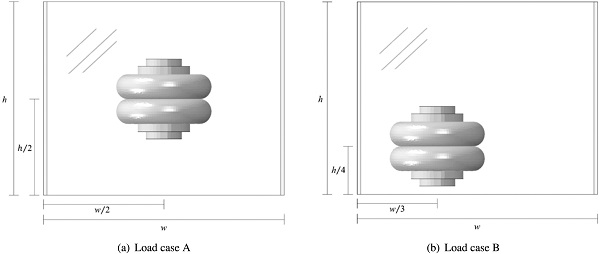
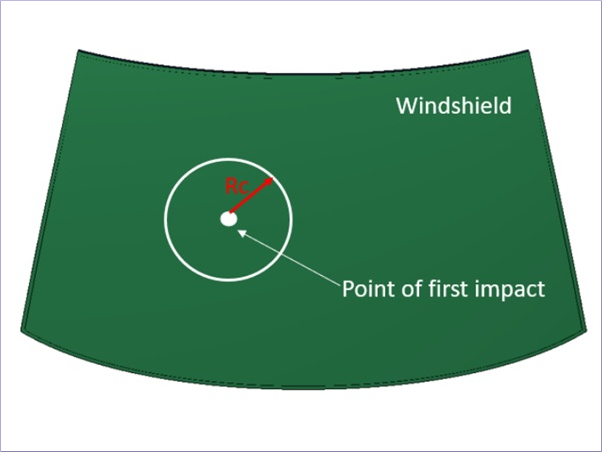
In order to validate the reduced models, the computed response is compared to both experimental results and the response provided by the reference model. Two load cases are evaluated where the point of impact is centric (load case A) and eccentric (load case B), respectively. In both load cases impact loading of a two-sided continuously supported monolithic glass panel, with width 1000 mm and height 800 mm, is studied. The position of the impactor for load cases A and B, respectively, is shown in Fig. 12.
Calibrations of the impactor reference model and the developed SDOF models, representing the impactor, are presented in Section 5.1. In Section 5.2, the response computed with the reference model and the reduced models are compared and evaluated based on load cases A and B. Furthermore, in Section 5.3, a validation based on experimental results is presented for load case A.
5.1. Calibration of impactor models
A calibration of the numerical reference Abaqus model of the impactor was conducted based on the rigid impact tests discussed in Section 4. Numerical analyzes of impact with a rigid surface was performed to simulate the experimental tests. The analyzes were initiated just upon impact by prescribing an initial velocity to the impactor. The model was calibrated in the sense that a stiffness-proportional viscous damping was prescribed to match the energy loss obtained in the experimental tests, see Table 3. Based on this calibration, a damping parameter of β=0.022 was prescribed to the rubber, proportional to the strain-free elastic stiffness. The other material parameters were set according to Table 1.
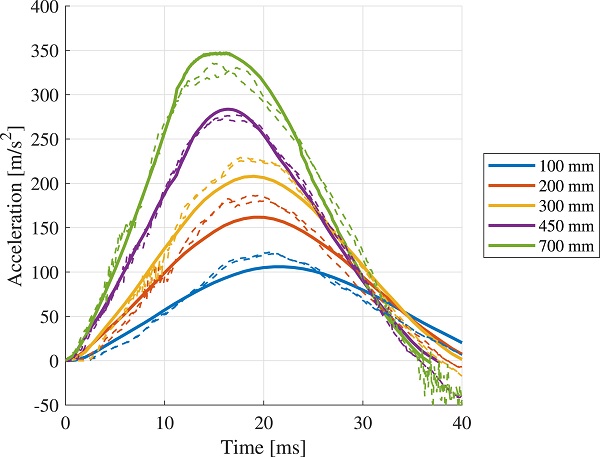
The impactor acceleration is shown in Fig. 13 for a drop height of 100, 200, 300, 450 and 700 mm, respectively. The dashed lines are the accelerations measured in the impact tests and the solid lines are the accelerations provided by the numerical simulations, extracted from a node close to the position of the accelerometer in the experimental tests. As shown in the figure, the computed accelerations show good agreement with the experimental results for drop heights 450 and 700 mm. However, the measured peak acceleration is higher, and the measured pulse time is shorter for drop heights 100, 200 and 300 mm.
It may be that some of the discrepancy is due to that the damping of the impactor is in fact frictional rather than viscous for lower amplitudes; a Coulomb type damping would result in an unsymmetrical and shorter acceleration pulse with a larger peak acceleration. Notice that even though friction is considered in the contact interactions in the reference model, this has a small impact on the total energy dissipation, which is mainly due to viscous damping. Moreover, the rotational motion of the impactor upon impact is not considered in the analysis, which may be another reason for the discrepancy between the calculated and measured accelerations.
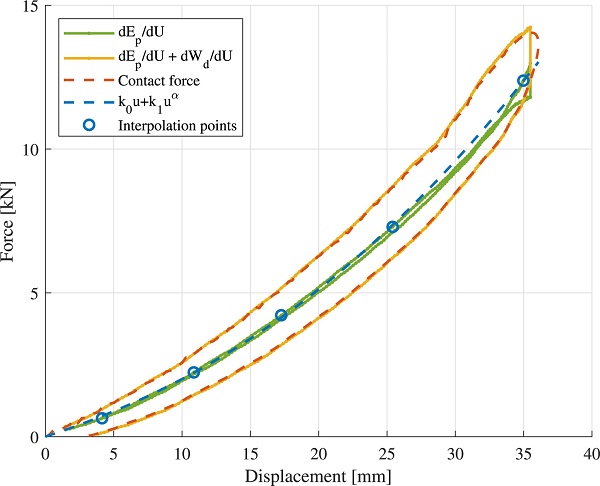
The nonlinear SDOF model, presented in Section 2.2, was calibrated to the impactor reference model. More specifically, a hysteresis loop, representing the behavior of a generalized SDOF system, was obtained from the reference model by plotting the movement of the impactor mass centroid and the total contact force between the impactor and the rigid surface. The total contact force is equal (but with opposite sign) to the sum of the impactor damping force and elastic force. To distinguish the total elastic force from the total internal force, the elastic force was approximated as the derivative of the total strain energy with respect to the displacement of the impactor mass centroid, as shown by the green curve in Fig. 14.
In a similar manner, the damping force was estimated as the derivative of the viscous dissipation. Hence, the sum of the derivatives, shown by the yellow curve in Fig. 14, represent the total internal force, which is very close to the total contact force shown by the dashed red curve. The unknown stiffness factors in the generalized SDOF model (i.e. k₀, k₁ and α in Eq. (13)) were then computed from the load–displacement curve in a least-square sense. More specifically, the factors k₀, k₁ were determined by a least-squares problem for a given α value. By traversing a sequence of α values, a best estimate was obtained. For instance, the blue dashed curve in Fig. 14 correspond to the nonlinear SDOF model calibrated to the data pairs marked by blue circles. Note that the derivatives are ill-conditioned close to the peak displacement, why these are only computed for displacements less than approximately 35 mm.
Table 3. Impactor energy loss due to impact with rigid beam.
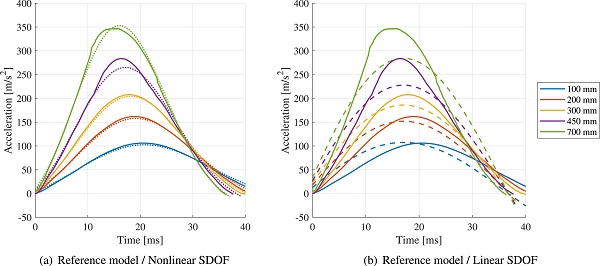
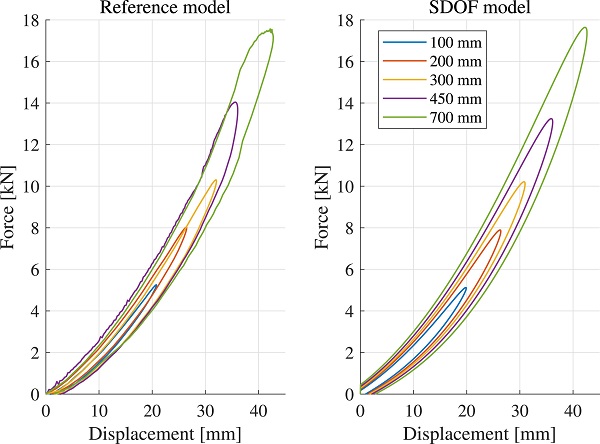
The acceleration given by the nonlinear SDOF model, with factors calibrated to k₀=1.59⋅10⁵, k₁=1.25⋅10⁷, and α=2.242, respectively, is shown for various drop heights in Fig. 15a. The damping parameters in Eq. (14) were calibrated to β₀=8⋅10⁻⁴ and β₁=4⋅10⁻³, respectively, based on the shape of the hysteresis loop provided by the reference model and the measured energy loss, presented in Table 3. The hysteresis loop for various drop heights are shown in Fig. 16, computed with the reference model and the nonlinear SDOF system, respectively.
As discussed in Section 2.4, a linear system can be solved using modal expansion techniques and, in particular, a closed-form solution can be achieved for initial value problems. A linear model of the assemble system implies the use of a linear impactor model. However, as shown in Fig. 13, the pulse time vary with the impact energy, which is expected for a nonlinear system. The system appears stiffer, i.e. the pulse time is shorter, for an increasing drop height, which is also consistent with the nonlinear system discussed above. Nonetheless, a simplified approximate model can be derived using the measured pulse time.
When contact is established, the movement of the impactor mass centroid can be represented by an SDOF system subjected to free vibration. It then follows that the pulse time, which corresponds to half the natural period of the system, can be employed for estimating a linear stiffness. Using this approach, a pulse time of 38 ms was considered for estimating an approximate stiffness, which is close to the pulse time measured for a drop height of 450 mm. Hence, the natural period of the system can be approximated as T = 2⋅38 = 76 ms, corresponding to an angular frequency of ω= 82.7 rad/s.
Accordingly, the stiffness is given by k = mω² = 342 kN/m. Similar to the nonlinear system, a stiffness-proportional damping was considered (i.e. a ordinary dashpot) with a damping coefficient calibrated to c = 445 N s/m (corresponding to a damping ratio of ζ = 5.4%). The acceleration computed with the linear SDOF model is shown in Fig. 15b. Notice that there is an instantaneous acceleration in the acceleration curves, which is a consequence of the initial damping force being linearly proportional to the prescribed initial velocity. Also, the computed pulse time is, as expected for a linear system, not dependent on the impact energy.
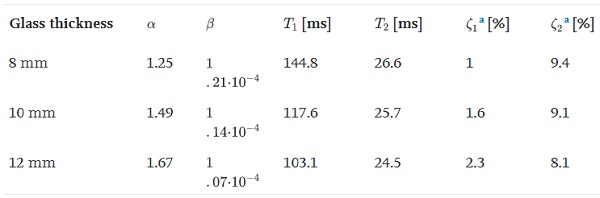
Table 4. Rayleigh parameters for the glass panel substructure and natural periods and damping ratios for the assembled system.
5.2. Evaluation of reduced order models
One of the benefits of the reduced linear model is the possibility to perform a modal decomposition of the coupled system. Beside the possibility to perform computationally efficient modal analyzes, the eigenfrequencies, eigenmodes, and modal responses can be investigating to get further insight into the structural behavior. Moreover, the eigenfrequencies of the global system can be used for calibrating the Rayleigh damping model employed for constructing a damping matrix for the glass panel substructure. The Rayleigh damping parameters can then be utilized in the linear as well as the nonlinear analyzes.
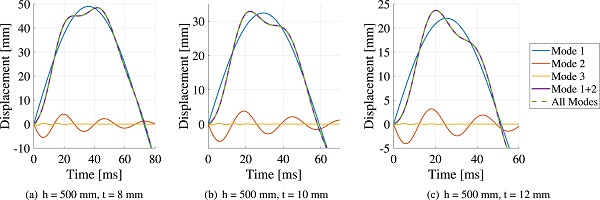
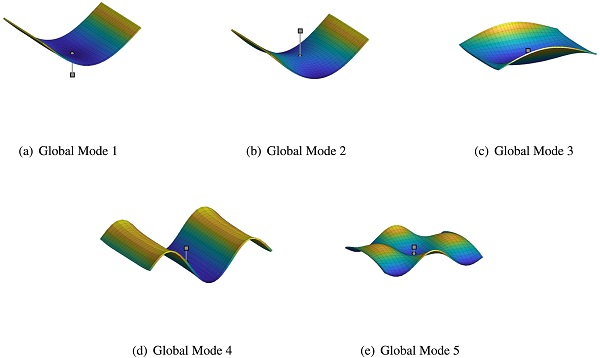
Fig. 17 shows the glass panel mid-point displacement provided by the linear reduced order model, including six component modes in the glass panel reduction basis. Furthermore, the mid-point displacement has been decomposed into the contributions from the first three global modes, shown by separate curves in the figure. As shown, the response can be almost entirely represented by the first two modes, this is true for all the thicknesses studied. In the fundamental global mode, the displacement of the impactor DOF and the glass panel have the same sign, i.e. they are oscillating in-phase as shown in Fig. 19.
The second mode, however, is an “out-of-phase”-mode, where the displacement of the impactor and the glass panel have opposite signs. For higher order modes, it turns out that the impactor deformation is very small. This is due to that the impactor mass is large compared to the effective mass in the out-of-plane direction for higher order modes—for anti-symmetric modes the effective mass is zero, and for symmetric modes the effective mass decreases rapidly with the mode order.
The Rayleigh damping parameters for the glass panel were calibrated to match a “best-estimate” damping of 1.7% (c.f. Section 4) for the eigenfrequency of the first and second global mode, respectively [29]. The damping parameters, the corresponding natural periods, and the modal damping ratios are presented in Table 4. Notice that the modal damping ratios for the assembled system, computed by means of the MSE method, considers both the Rayleigh-damping prescribed to the glass panel substructure as well as the viscous damping model employed in the impactor SDOF model, which is linearly proportional to the frequency. Consequently, the computed global damping ratios will be frequency dependent, as shown in Table 4.
As discussed in Section 4, the energy loss of the glass–impactor system was estimated to be around 26% for a glass panel thickness of 8 mm and a drop height of 200 mm. The corresponding energy loss provided by the linear model is approximately 18%, indicating that the damping prescribed to the assembled system is somewhat low. However, as discussed in Section 4, the energy loss estimated based on a double impact test should be regarded as a rough estimation due to limitations in the experimental methodology; for example, energy loss related to the motion of the pendulum is not considered, and a linear elastic behavior is assumed.
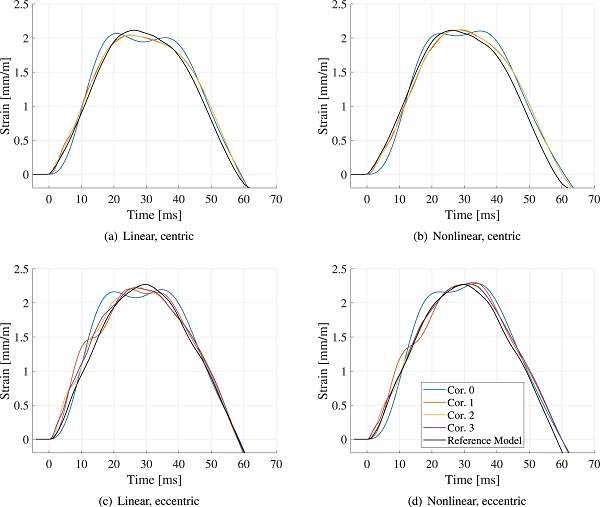
Fig. 18 shows the horizontal strain on the rear side of the glass panel at the point of impact for various reduction bases applied to the glass substructure. As shown in the figure, the peak-strain is similar for all the models. However, a refined reduction basis is required for the glass substructure to capture the shape of the strain curve, in particular for the eccentric load case. Notice that the reduction basis employed for reducing the glass substructure should be sufficiently large so that the deformed shape of the glass panel for the important global modes can be resolved. Hence, the number of component modes required may be larger than the number of global modes needed for an accurate representation of the global response.
5.3. Validation of numerical models using experimental data
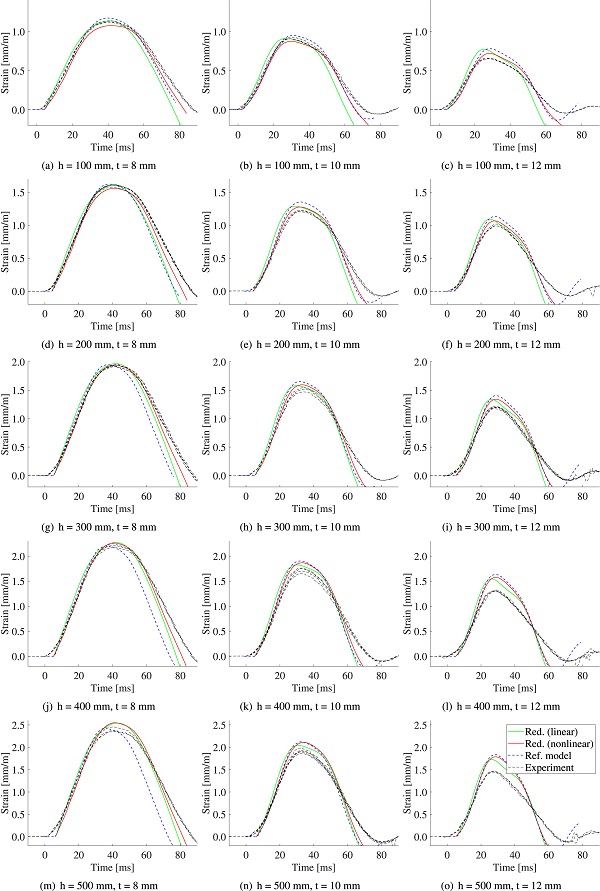
The measured horizontal strain on the rear side of the glass panels are shown for various drop heights and glass thicknesses in Fig. 20, together with the corresponding strain given by the reference model and the reduced linear and nonlinear model, respectively. In the reduced models, the glass panel was reduced using six component modes (i.e. five fixed-interface correction modes and a constraint mode). As shown in the figure, the strain computed with the reference model and the reduced nonlinear model corresponds well to the measured strains for impact tests with a drop height 100 mm.
However, the differences are amplified for impact tests with an increasing drop height. The deviation is especially pronounced for the glass panels with thickness 12 mm. Furthermore, it is of interest to evaluate not only the peak strain (even though this, in general, is the governing parameter in a design calculation) but also the shape of the strain curves indicating how well the models capture the structural behavior. As shown in the figure, the shape of the strain curves is relatively close for glass panels with thickness 8 mm, whereas the shape of the computed strain curves somewhat differ for glass panels with larger thickness.
The strain provided by the linear model is very close to the response computed with the nonlinear reduced model for the cases with a drop height of 500 mm. This is due to that the stiffness prescribed to the linear model fits better for larger amplitudes, as manifested by the acceleration curves in Fig. 15. Accordingly, the pulse time is slightly underestimated by the linear model for lower drop heights.
To further corroborate the results, the calculated and measured data can be evaluated based on the reference diagrams presented in [11], which are also included in DIN 18008-4 [41]. The reference diagrams result from experimental data and numerical simulations and provide the pendulum acceleration as well as the peak principal stress for a reference plate, having width 1000 mm and height 700 mm. Both results for all-sided and two-sided (supported at the short ends), continuously supported plates are presented, the latter being comparable to the glass plates studied herein.
Further, the reference diagrams consider a pendulum drop height of 200 mm and 450 mm, respectively. In particular, the principal peak stress for impact with drop height 200 mm against the center of the two-sided reference plate is approximately 140 MPa. The corresponding stress given by the Abaqus reference analysis is 131 MPa (the peak strain shown in Fig. 20 is thus given by εxx=(σxx−νσyy)/E, where the vertical stress according to the analysis is σyy=59 MPa). It should be noted, however, that the height of the glass plate studied herein is 800 mm. Thus, a slightly lower stress is expected.
According to the reference diagrams, the pendulum peak acceleration during impact with a rigid body is approximately 170 m/s² and 265 m/s² for drop heights 200 mm and 450 mm, respectively. As shown in Fig. 13, this is in good agreement with the computed and measured accelerations.
6. Discussion
When verifying the load-bearing capacity of glass structures subjected to impact loading, time efficient and user-friendly design tools can be of great utility, allowing for an interactive design process where alternative designs may be tested. In the present study, an approach using DS have been employed for developing reduced order models that are computationally efficient while providing an accurate prediction of the pre-failure elastic response. For the studied load cases, the coupled glass–impactor system can be well-represented by only two global modes. However, it should be noted that the influence of higher order modes might not be negligible for larger glass panels or panels with other boundary conditions. Moreover, it was shown that up to four component modes may be required to resolve the displacement of the glass panel in the global modes.
A reduction basis for the glass panel was constructed using correction modes, as further discussed in Section 2.1. An alternative could be to construct a reduction basis by means of the traditional C-B or Rubin approaches, that uses the fixed- and free-interface normal modes, respectively. However, not much would be gained if these methods were applied to linear systems, i.e. where linear subsystems are used for modeling the glass panel as well as the impactor. The assembled system includes m + 1 DOFs, i.e. the glass panel has a total of m DOFs and an additional DOF is added representing the displacement of the lumped impactor mass.
Clearly, the computational cost for generating a set of component normal modes or global eigenmodes is in practice identical. On the contrary, an approach using correction modes replaces the eigenvalue problem by a number of matrix–vector multiplications. Furthermore, the set of correction modes, by definition, excludes redundant modes, which cannot be excited by loading on the substructure boundary. Accordingly, there are no anti-symmetric mode shapes in the global modal basis, as shown in Fig. 19.
As discussed in Section 2.4, linear systems can be solved by means of modal dynamics, which in turn enables a closed-form solution for initial value problems. However, a time discretization is required for identifying the peak glass strain during impact. Moreover, the generalized coordinates must be transformed to physical displacements in each time increment, which in turn can be used for computing the glass strain. Consequently, the post-processing of the dynamic response can become computationally expensive.
An approach using modal summation techniques can be employed to overcome this problem. For example, a conservative evaluation can be made by means of an absolute summation of the modal responses. Since only one set of data needs to be evaluated in the physical domain the computational effort in the post-processing stage is reduced significantly. However, it should be noted that the modal phase information is lost in a modal summation, why an absolute summation may be too conservative in some applications.
In general, the developed models show good agreement with the experimental results. However, there are some discrepancies, which are especially pronounced for glass panels with a nominal thickness of 12 mm (see Fig. 20). The deviation can be due to errors/imperfections in the experimental set-up and/or inadequate modeling abstractions, such as the assumption of a constant contact area, neglection of geometric nonlinearity (i.e. membrane action), and an assumed viscous damping model.
Notice, however, that the glass strain curves provided by the reduced models and the numerical reference model are very similar, suggesting that the deviations are due to simplifications made in both models. Recall that both the reduced models and the numerical reference model uses a viscous damping model (in contrast to e.g. a frictional modal) and, furthermore, ignores the dynamic air pressure in the impactor tires. One can thereby assume that these simplifications, or other unknown errors, are the reason for the deviations.
The damping matrix of the glass substructure was constructed by means of Rayleigh-damping, using both mass- and stiffness-proportional damping. This damping model is convenient since it can be utilized in the physical as well as the modal domain. It should be noted, however, that a damping model being proportional to the structure mass is clearly unphysical (see e.g. [29]). A more refined damping model may be developed. Moreover, by means of further experimental studies, the frequency dependency of the glass panel as well as the impactor damping can be investigated.
For the glass panel with thickness 8 mm, the shape of the strain curve given by the numerical reference model deviates from the curves obtained with the other models. The pulse is shorter whereas the peak strain is fairly close to the peak strain of the other curves. Because the deviation is pronounced for the 8 mm glass panel, having a bending stiffness considerably lower than the thicker panels, it is reasonable to claim that this discrepancy is due to membrane action being manifested by a stiffer response (i.e. shorter pulse). Recall that geometric nonlinearity is considered in the numerical reference model, while these effects are ignored in the reduced order models.
However, one would then expect the measured strains to be closer to the strain provided by the reference model, which is not what the experimental data suggests. Nonetheless, the influence of membrane action can still be one of the reasons for the discrepancy. The stiffness of the rubber strips along the supports, modeled by means of elastic spring beds, affects the influence of membrane action. The stiffness of the rubber strips (and the in-plane stiffness, in particular) can be regarded as a particularly uncertain parameter, which is influenced by the prestressing force due to bolting of the glass panels. Hence, the influence of membrane action might not be accurately captured by the reference model, even though geometric nonlinearity is considered. Furthermore, it is plausible that the stiffness of the rubber strips are in fact nonlinear, e.g. due to friction between the rubber and the glass/steel surface.
Finally, it should be noted that the presented reduced order models may also be employed for analyzing laminated glass, as long as the glass panel response can be approximated as linear.
7. Conclusions
The paper presents strategies for reduced order modeling of glass panels subjected to soft-body impact. The aim was to develop accurate reduced order models for computation of the pre-failure elastic response, suitable for implementation in user-friendly interactive design tools. Concepts for reduced modeling of the glass panel, the impactor and the contact interaction between the glass panel and the impact body were investigated. In particular, a methodology is proposed for calibrating a nonlinear SDOF model representing the impactor. Furthermore, a model validation was performed based on experimental tests and a detailed numerical reference model. Moreover, a fixed-interface DS method that uses correction modes was successfully employed for developing computationally efficient models of the coupled impactor–glass system. The following conclusions can be drawn:
- The measured glass strains and the strains provided by the numerical models are fairly close. The discrepancy is similar for the reduced models and the reference model, suggesting that the deviations are due to inadequate modeling abstractions applied in both models.
- The impactor acceleration measured during impact with a very stiff steel column (which can be considered rigid) is close the acceleration provided by the numerical reference model.
- A nonlinear SDOF model representing the impactor was successfully calibrated to the reference model. In particular, the acceleration computed for impact with a rigid surface with the nonlinear SDOF model showed very good agreement with the acceleration provided by the numerical reference model.
- The evaluation of the reduced order models suggests that a simplified modeling approach assuming a constant contact area is fairly accurate.
- Reduction bases including correction modes turn out to be particularly suitable for implementation in design tools, such as ClearSight, where a manual selection of component modes should be avoided. The set of correction modes automatically excludes redundant modes that cannot be excited by loading on the substructure boundary.
- If the impactor is approximated by a linear model, a closed-form solution can be obtained by means of the modal strain energy method, which enables the use of modal expansion techniques for lightly damped systems with non-proportional damping. For the studied load cases, the coupled glass–impactor system can be well-represented by only two global modes.
- A very computationally efficient approximate evaluation of the glass strain can be obtained if a closed-form modal solution is combined with a modal summation technique, e.g. an absolute summation of the peak modal responses. Using this approach, a time discretization in the physical domain is avoided.
CRediT authorship contribution statement
Linus Andersson: Conceptualization, Methodology, Investigation, Validation, Software, Formal analysis, Writing – original draft, Writing – review & editing. Marcin Kozłowski: Conceptualization, Investigation, Validation, Writing – review & editing, Funding acquisition. Peter Persson: Conceptualization, Investigation, Validation, Writing – review & editing. Per-Erik Austrell: Conceptualization, Validation, Writing – review & editing. Kent Persson: Conceptualization, Investigation, Validation, Software, Writing – review & editing, Funding acquisition.
Declaration of Competing Interest
The authors declare that they have no known competing financial interests or personal relationships that could have appeared to influence the work reported in this paper.
Acknowledgments
Financial support from the Reconcile project, a part of the EU program Interreg IVA, and the Swedish glass associations; Glasbranschföreningen, Svensk Planglasförening and Balkongföreningen i Norden is gratefully acknowledged. Å Forsk Foundation is acknowledged for financing the part with the experimental campaign, grant ref. no. 18-510.


