This paper was first presented at GPD 2023.
Link to the full GPD 2023 conference book: https://www.gpd.fi/GPD2023_proceedings_book/
Authors:
- Iglesias A. ¹'²
- Muniz-Calvente M. ³
- Fernández Canteli A. ³
- Llavori I. ²
- Torca I. ²
- Martinez-Agirre M. ¹
- Esnaola J. A. ²
¹ Fluid Mechanics, Faculty of Engineering, Mondragon Unibertsitatea, Loramendi 4, 20500 Arrasate-Mondragon, Spain
² Structural Mechanics and Design, Faculty of Engineering, Mondragon Unibertsitatea, Loramendi 4, 20500 Arrasate-Mondragon, Spain
³ Department of Construction and Manufacturing Engineering, University of Oviedo, Campus de Viesques, Gijón, Spain
1 Introduction
Glass is most often heat treated before using it as a structural material. In this context, thermal tempering is the most effective and efficient method to enhance the load bearing capacity and strength of glass [1]. The standard thermal tempering process is generally composed of air nozzle arrays for cooling the glass components. This technology may result in non-uniform heat transfer coefficient (HTC) distributions on the glass surface which have a direct impact on the structural and aesthetic features of heat treated components [2], [3]. In addition, new environmental laws and the growing competition have reduced the profit margin on glass industry, making it necessary to perform a more comprehensive optimisation of the production cycle [4]. This fact greatly emphasises the need to control the cooling process during heat treatment and reduce the stress variabilities and optical anisotropies that may arise.
Additionally, the strength of glass is heavily influenced by the presence of micro-cracks on the surface. Probabilistic assessments of glass strength are considered appropriate methods to account for the randomly distributed microcracks [5]. More specifically, the Weibull distribution is reported to be the most widely used statistical approach for representing the fracture strength of brittle materials [6]. Some works, however, have performed direct statistical assessment of annealed and tempered glass panes but the results obtained are only representative for the specific geometry or load type analysed in the investigation [7]. Taking into account that large-scale experimental programs are essential for obtaining reliable cumulative distribution functions, this procedure might not be feasible if numerous features are to be investigated [8]. Furthermore, if non-uniform residual stresses are to be considered, the total effort required in the laboratory increases significantly.
Therefore, the development of a methodology based on numerical analysis is necessary to better understand the physical phenomena involved and reduce the need for complex and time-consuming experimental tests. To rise to this challenge, in this work an efficient method to address both, the residual stress pattern and the statistic nature of glass strength is proposed. To do so, a numerical methodology based on fluid-structure interaction (FSI) to calculate the non-uniform residual stresses developed during the tempering process is presented. With the aim of validating the proposed FSI methodology, two different case studies are modelled. First, a validation procedure based on laboratory case studies characterised by symmetrical single-jet cooling is presented. Once the proposed numerical procedure is validated by laboratory data, the performed procedure is extended to an industrial case study, where multiple nozzle arrays are employed. Finally, a statistical assessment of the in-service behaviour of tempered glass samples tested in a laboratory environment is performed.
2 Case studies and experimental methodology
In this section, the single-jet laboratory case studies and the multi-nozzle industrial case study are described. The aim of the laboratory case studies is to validate the proposed statistical-numerical methodology by taking experimental measurements under controlled conditions. Subsequently, the methodology is extended to an industrial case study, though, data encompassing both, residual stress distributions and fracture data lack in the literature. Thus, the aim of this case study is to verify the suitability of the methodology to predict residual stresses in an industrial environment.
2.1 Single-jet configuration
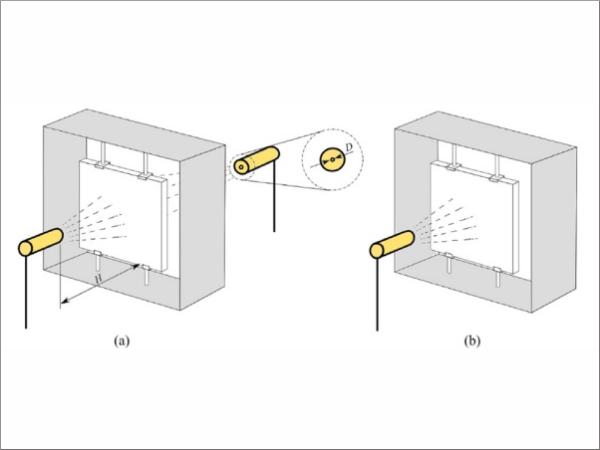
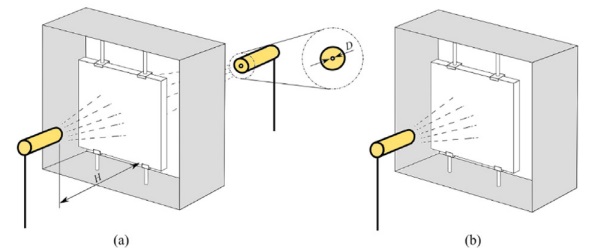
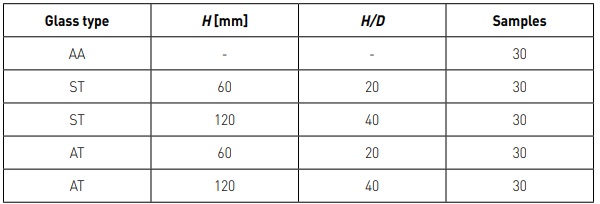
The laboratory specimens were of a flat square shape with a nominal length of 90 mm on each side and a nominal thickness of 4 mm. The as-received condition of the plates was annealed (AA). Therefore, a tempering process was applied to develop residual stresses. For this purpose, specimens were symmetrically (ST) and asymmetrically (AT) tempered by air nozzles. In addition, different jet-to-plate distances, H/D = 20 and H/D = 40, were studied, being H the distance to the plate and D the nozzle diameter. Figure 1 shows the designed frame structure to hold the glass plates in a vertical position during cooling.
Regarding the strength characterisation for the statistical assessment, coaxial double ring tests were done [9]. To this end, an MTS uniaxial testing machine with a 15 kN load cell was employed.
Similarly, the vertical displacement field was investigated by Digital Image Correlation (DIC) by means of the ARAMIS 3D GOM equipment. Table 1 summarises the different glass types and the number of samples used in this investigation.
2.2 Multi-nozzle array configuration
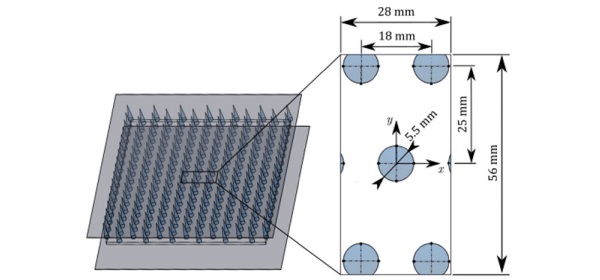
The industrial case study was based on a previous work where residual stress distributions were measured in tempered flat glass specimens of 6 mm thickness [10]. The dimensions of the specimens were 300 x 300 x 6 mm, but the analysis of the results was limited to a representative area of 28 x 56 mm as shown in Figure 2.
3 Numerical-statistical methodology
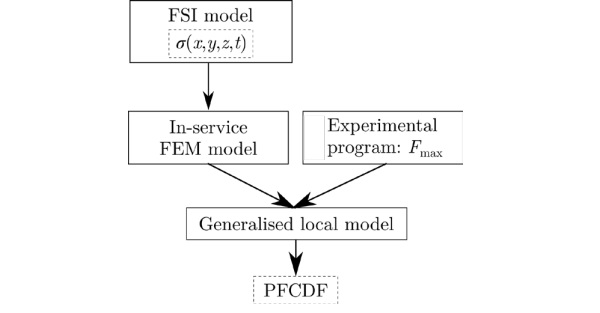
The proposed numerical-probabilistic procedure is grounded in previous investigations carried out by the present authors in 2017 and 2022. Firstly, the nonuniform residual stress distribution developed during tempering is predicted by means of a one-way FSI procedure. Subsequently, the generalised local model (GLM), which accounts for the local values in a component during loading situations, is adopted [11], [12]. Figure 3 sets out the diagram of the procedure to assess the in-service behaviour of prestressed glass components.
3.1 FSI methodology to calculate non-uniform residual stresses
The proposed FSI procedure to model low thickness quenching processes encompasses both, a transient computational fluid dynamics (CFD) simulation without volumetric radiation and a purely thermal model below a critical temperature. On the one hand, volumetric radiation of glass was verified to have little influence when low thickness and high cooling rates are combined. On the other hand, the structural relaxation of glass have a large impact on the residual stress development during quenching [13]. However, a critical temperature at 400ºC is identified, below which residual stresses become independent of cooling rate and distribution. Thus, at this point, the CFD calculation was interrupted and a constant in time and spatially uniform HTC was applied. In this way, a commitment between accuracy and efficiency was sought.
3.2 Statistical methodology based on the generalised local model
To statistically assess the in-service behaviour of glass plates, firstly, an experimental program is conducted to get the ultimate strength values of glass. Each coaxial double ring test leads to a fracture force, which is subsequently applied into a structural FEM model. The structural model replicates the experimental set-up. As a result, this numerical calculation enables to obtain the local values of the reference or generalised parameter (GP), which depends on the selected failure criterion, at the experimentally determined fracture loads. In this study, two failure criteria are analysed: the maximum principal stress, σmax, and the principle of independent action (PIA).

As shown in the following equation, the PFCDF is grounded on a three-parameter Weibull function, with the Weibull parameters being determined iteratively:

where λ is the location parameter, β is the shape parameter, and δ is the scale parameter, the generalised parameter, GP, which acts uniformly over a reference size Sref, and the equivalent size, Seq, that refers to the size of a sample that exhibits an equivalent probability of failure as the one of the real component when is subjected to the real GP distribution. The resulting PFCDF does not depend on the specimen size, shape, and load employed during the experimental characterisation. As a result, it is possible to transfer the results of the experimental work to practical design applications.
4 Results
This section sets out the results of the presented statistical-numerical methodology. Firstly, the validity of the proposed FSI procedure for both, laboratory and industrial conditions, is checked. Then, the experimental in-service behaviour is estimated by means of a statistical assessment. To this end, two different failure criteria are studied, and the failure probabilities of the specimens are predicted, not only based on its own experimental data, but also based on the data of additional glass types. Consequently, the transferability of the results is verified.
4.1 Residual stress calculation
4.1.1 Single-jet configuration
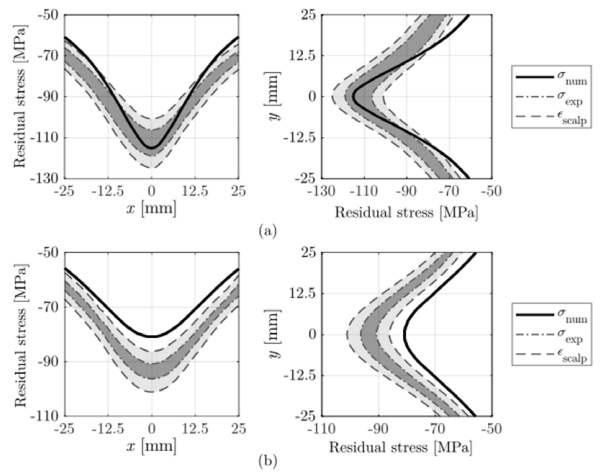
The predictions of residual stresses in symmetrically and asymmetrically tempered plates are compared to the experimental measurements taken by the scattered light polariscope SCALP-05. Next, residual stress distributions on the surface of the glass specimens are presented. The results consist of: (i) residual stress distributions along the x and y directions that intersect at the midpoint of the plate, (ii) uncertainty band of the repeatability tests, and (iii) uncertainty range of the SCALP-05 device (5%). Figure 4 shows the results for symmetrically tempered plates at H/D distances of 20 and 40.
In the case of symmetric tempering at H/D = 20, the numerical results were found to be in good agreement with the experimental measurements, as they generally fall within the defined experimental bands. The largest differences were observed in the dry areas of the plate, namely, the areas where the influence of the jet is lower and, therefore, heat extraction decreased. This may be due to uncertainties related to the definition of the initial tempering temperature of the plate, which has a notable influence on the development of residual stresses [14]. As for the case of symmetric tempering at H/D = 40, the predictions are at the lower limit of the experimental bands. These differences may be related to the selected turbulence model, as the value of H/D increases, turbulence modelling may play a role on the flow development and hence, on the heat extraction on the surface. Regarding asymmetrically tempered plates, the same conclusions were obtained for the two analysed distances, H/D = 20 and H/D = 40.
4.1.2 Multi-nozzle array configuration
This section moves on to validate the proposed FSI methodology in a multi-jet array configuration, namely, a conventional industrial tempering process. As shown in Figure 5, the defined nozzle arrangement had a huge importance on the residual stress distribution. The interaction between the deflecting flows of neighbouring jets reduced heat extraction and led to lower residual stress magnitudes. Similarly, these areas around the stagnation points of the nozzles, were named as dry regions.
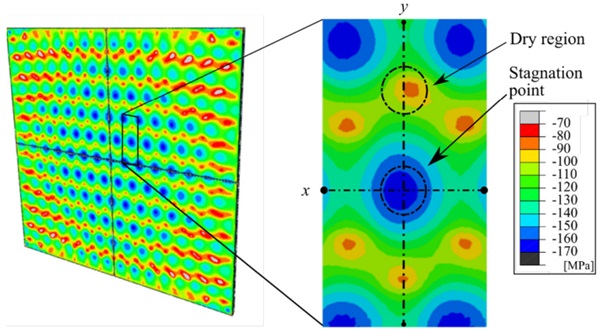
Another important aspect was observed at the outflow areas of the plate, where crossflow effects were appreciated close to the flow evacuation areas. This phenomenon distorted the jet pattern on the glass surface. Hence, the nature of the flow is an important aspect to bear in mind when analysing tempered glass components.
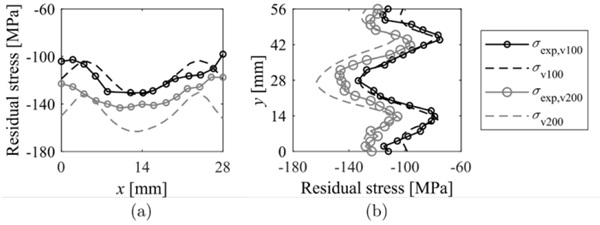
Figure 6 compares the residual stress distributions along x and y directions when air jet velocities of 100 m/s and 200 m/s were defined.
Both the numerical and experimental results exhibited the same pattern, successfully capturing the peaks and troughs caused by the jet arrangement in both directions. The difference in stress amplitudes between the x and y directions could be attributed to non-uniform heat transfer that occurred on the surface because of the defined jet-tojet distances. The jet pitch in the x direction resulted in overlapping jet flows, while the larger pitch in the y direction led to a lower heat extraction between the jets, resulting in the aforementioned dry regions. As a result, the significant difference in cooling rate between the stagnation areas and dry regions resulted in a substantial variation in the residual stresses developed between these areas.
4.2 Probabilistic assessment
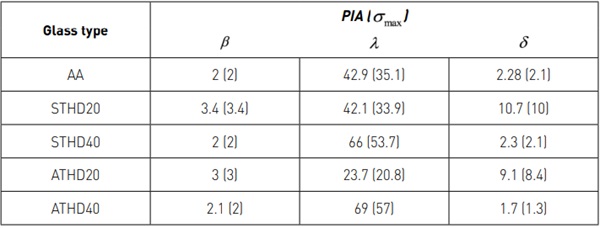
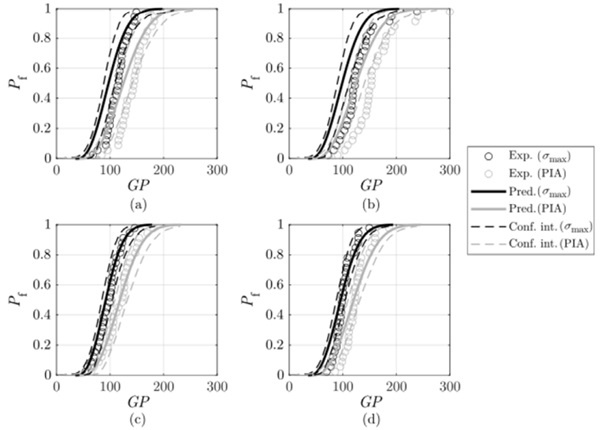
Due to the lack of information about residual stresses and fracture data of tempered glass in the literature, the probabilistic assessment of the samples tested under laboratory conditions was carried out. Thus, after estimating the residual stress distributions of each glass type, the local values of GP at the fracture load of each sample were obtained, and the GLM was used to generate the PFCDF of each case study. Table 2 shows the Weibull parameters based on the two failure criteria proposed in this study for each analysed glass type.
Figure 7 sets out the in-service behaviour of annealed samples based on the PFCDF derived from their own experimental characterisation and the experimental characterisations of tempered plates. Similarly, predictions are shown based on the defined failure criterion and the 5% and 95% confidence intervals. In general, the experimental results were within the confidence intervals and deviations were less than 10%. Deviations increase up to 15% when using parameters from symmetrically tempered plates at H/D = 40 (STHD40). It should be noted that an increase in the number of samples would lead to a greater reliability of the predictions. Finally, both failure criteria show adequate representativeness, as the differences in their predictions are less than 1%.
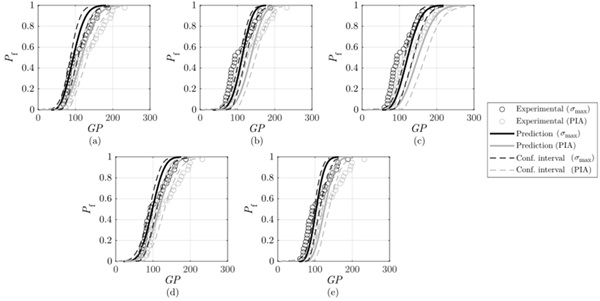
Finally, Figure 8 depicts the performance of tempered plates by considering the PFCDF derived from the experimental characterisation of annealed plates. As a result, the transferability of PFCDFs between glass components showing different stress states is verified, making it possible to predict the inservice behaviour of tempered plates through the experimental characterisation of annealed plates. Consequently, the PFCDF is independent of the applied thermal treatment. The reason for this might be related to the to the amorphous structure of glass and the absence of phase transformations during tempering. Consequently, the versatility of the proposed methodology to predict the fracture behaviour of annealed and tempered components is confirmed. This finding can lead to significant reductions in production costs and time.
5 Conclusions
The significant conclusions of this investigation are:
- A generalised FSI numerical procedure to predict non-uniform residual stress distributions in glass subjected to single and multiple nozzle or jet arrays was successfully implemented and validated with laboratory experimental measurements and data from the literature. The results showed that local flow phenomena during heat treatment process played a vital role in the residual stress development in glass plates.
- The transferability between the cumulative failure functions of annealed and tempered plates is confirmed. Therefore, the PFCDF is independent of the initial stress state of the plates. The insights gained from this study may be of assistance to reduce the total effort required in the experimental fracture characterisation of glass components.
- Further research on analysing the inservice behaviour of industrially tempered glass components should be undertaken. Similarly, a natural progression of this work would be to extend the analysis to fatigue, thermal shock, and impact loading configurations. In this way, the structural integrity of tempered glass, which plays a vital role in the daily life of people, could be further assessed.
6 Acknowledgements
The authors would like to acknowledge the financial support provided by the Basque Government by means of ICME project (KK2021/00022) and Research Groups (IT1505-22 and IT1316). Similarly, the authors acknowledge the Gipuzkoa Provincial Council under Grant no. 2022-CIEN-000052-01 (HOZTIKOR).
7 References
[1] R. Hess, ‘Material Glass’, Struct. Eng. Int. J. Int. Assoc. Bridg. Struct. Eng., vol. 14, no. 2, pp. 76–79, 2004.
[2] J. H. Nielsen, J. F. Olesen, and H. Stang, ‘Characterization of the Residual Stress State in Commercially Fully Toughened Glass’, J. Mater. Civ. Eng., vol. 22, no. 2, pp. 179–185, 2010, doi: 10.1061/(asce)0899-1561(2010)22:2(179).
[3] A. Mikkonen, A. Aronen, M. Rantala, and R. Karvinen, ‘Effects of non-uniform heat transfer in a tempering process on glass quality’, 2017.
[4] M. Zier, P. Stenzel, L. Kotzur, and D. Stolten, ‘A review of decarbonization options for the glass industry’, Energy Convers. Manag. X, vol. 10, no. February, 2021, doi: 10.1016/j.ecmx.2021.100083.
[5] M. Overend, G. A. R. Parke, and D. Buhagiar, ‘Predicting Failure in Glass—A General Crack Growth Model’, J. Struct. Eng., vol. 133, no. 8, 2007, doi: 10.1061/(ASCE)0733-9445(2007)133:8(1146).
[6] G. Pisano and G. R. Carfagni, ‘Statistical interference of material strength and surface prestress in heat-treated glass’, J. Am. Ceram. Soc., vol. 100, no. 3, pp. 954–967, 2017, doi: 10.1111/jace.14608.
[7] G. Castori and E. Speranzini, ‘Fracture strength prediction of float glass: The Coaxial Double Ring test method’, Constr. Build. Mater., vol. 225, pp. 1064–1076, 2019, doi: 10.1016/j.conbuildmat.2019.07.264.
[8] M. Muniz-Calvente, A. Ramos, P. Fernández, M. J. Lamela, A. Álvarez, and A. Fernández-Canteli, ‘Probabilistic failure analysis for real glass components under general loading conditions’, Fatigue Fract. Eng. Mater. Struct., vol. 42, no. 6, pp. 1283–1291, 2019, doi: 10.1111/ffe.13011.
[9] European Standard, EN 1288-5: Glass in building - Determination of the bending strength of glass. Part 5: Coaxial double ring test on flat specimens with small test surface areas. Brussels, 2000.
[10] Y. Chen, D. Lochegnies, R. Defontaine, J. Anton, H. Aben, and R. Langlais, ‘Measuring the 2D residual surface stress mapping in tempered glass under the cooling jets: The influence of process parameters on the stress homogeneity and isotropy’, Strain, vol. 49, no. 1, pp. 60–67, 2013, doi: 10.1111/str.12013.
[11] M. Muniz-Calvente, A. M. P. de Jesus, J. A. F. O. Correia, and A. Fernández-Canteli, ‘A methodology for probabilistic prediction of fatigue crack initiation taking into account the scale effect’, Eng. Fract. Mech., vol. 185, pp. 101–113, 2017, doi: 10.1016/j.engfracmech.2017.04.014.
[12] A. Iglesias, M. Muniz-Calvente, A. FernándezCanteli, I. Llavori, M. Martinez-Agirre, and J. A. Esnaola, ‘Numerical-probabilistic assessment of tempered glass failure based on the generalised local model characterised by annealed plates’, Eng. Fract. Mech., vol. 274, no. August, p. 108754, 2022, doi: 10.1016/j.engfracmech.2022.108754.
[13] O. S. Narayanaswamy, ‘Stress and structural relaxation in tempering glass’, J. Am. Ceram. Soc., vol. 61, no. 3–4, pp. 146–152, 1978.
[14] A. Iglesias, M. Martinez-Agirre, I. Torca, I. Llavori, and J. A. Esnaola, ‘Numerical methodology based on fluid-structure interaction to predict the residual stress distribution in glass tempering considering non-uniform cooling’, Comput. Struct., vol. 264, p. 106757, 2022, doi: 10.1016/j.compstruc.2022.106757.

