Article Information
- Digital Object Identifier (DOI): 10.47982/cgc.8.399
- This article is part of the Challenging Glass Conference Proceedings, Volume 8, 2022, Belis, Bos & Louter (Eds.)
- Published by Challenging Glass, on behalf of the author(s), at Stichting OpenAccess Platforms
- This article is licensed under a Creative Commons Attribution 4.0 International License (CC BY 4.0)
- Copyright © 2022 with the author(s)
Authors:
- Luca Guidi - Studio Masiello Strutture, Pisa
- Giovanni Inghirami - Studio Masiello Strutture, Pisa
- Gerardo Masiello - Studio Masiello Strutture, Pisa
- Daniele Antonucci - Eurac Research, Bolzano
- Pasquale Lucia - BLDing, Pordenone

Abstract
Façades are one of the main elements that affect indoor environmental quality (IEQ) in buildings and building performance. Given the increasing development of sensor technology, the collection of building monitoring data is useful to understand whether the building and in particular the façade system performs as designed. The increasing use of Technical Building Management (TBM) as well as Building Automatic and Control System (BACs) has been demonstrated to be a promising method to decrease the energy consumption and increase the indoor comfort in new and existing buildings. This project aims to develop a tool showing and processing the monitoring data in a BIM environment using an IFC model.
The application has been developed thinking about a BIM approach in the building management. Nowadays IFC models are the most used exchange file format in a BIM process. An IFC file can be loaded into a common data environment (CDE) reachable from stakeholders, sharing information and management strategies. The developed tool is a stand-alone application written in C# which is called MICA (Monitoring Internal Comfort Application). MICA can properly display the monitoring data of building sensors, sharing information between different building actors using the IFC format. It is a platform to visualize, manage and identify the IEQ aspects of building based on real monitored data.
1. Introduction
One of the hardest challenges of our century is the improvement of building energy efficiency for reducing energy consumption and energy-related emissions. In order to achieve optimal building performance with good IEQ we need to focus on the building façade system and MEP, which in most of the case may not meet design expectations. Monitoring building performance, both in energy and IEQ aspects, is a first step to understand if and how we have to improve the building performance or improve system controls. Thanks to ever-developing sensor technology it is possible to easily collect data for making appropriate energetic and quality evaluations.
The BIM environment can be helpful to manage the building design and maintenance, sharing and planning strategies between involved actors (designers, installers, maintainers, energy managers, etc). BIM processes are strongly changing the management approach, taking it towards an increasingly digital direction and simplifying collaboration between different stakeholders, especially for large or complex buildings and where many actors are generally involved.
One of the main research projects in this topic was the development of a new prototype IoT system for capturing the holistic and transient influence of facades on IEQ and occupants (Alessandra Luna-Navarro et al. 2021). The BIT (building impulse toolkit) is a very fully optional monitoring station which can register a large amount of data in a certain time range. After a 9-month deployment in a real-world office BIT was successfully able to capture the influence of the façade on IEQ in space and time, and to monitor occupant environmental discomfort and satisfaction in a non-disruptive manner. Another developed monitoring station for real-time measurement is SAMBA, which integrates low-cost suite of sensors with a software platform designed to automatically analyze and visualize data for quick interpretations (Thomas Parkinson et al. 2019).
MICA has been developed thinking about the potential of these innovative prototypes. This tool is capable to show the IEQ data collected from sensors and sharing processed data in a BIM environment. MICA (Monitoring Internal Comfort Application) is a beta version of a stand-alone application in which it is possible to upload monitoring datasets and IFC models, display charts or 3D views, and export IFC files.
The use of IFC file allows to be extremely flexible in the BIM market since is not bound to a specific software. Indeed, the file can be readable to any IFC viewer software enabling use even for short checking only.
2. MICA application
2.1. Develop
The application was developed in Visual Studio (Visual Studio documentation ), using C# program language (C# documentation) and use the open-source toolkit XBim for handling IFC file (Xbim project).
After a first GUI design (Fig. 2) we created a fictitious indoor environment of an office building and a dummy database of monitored quantities.
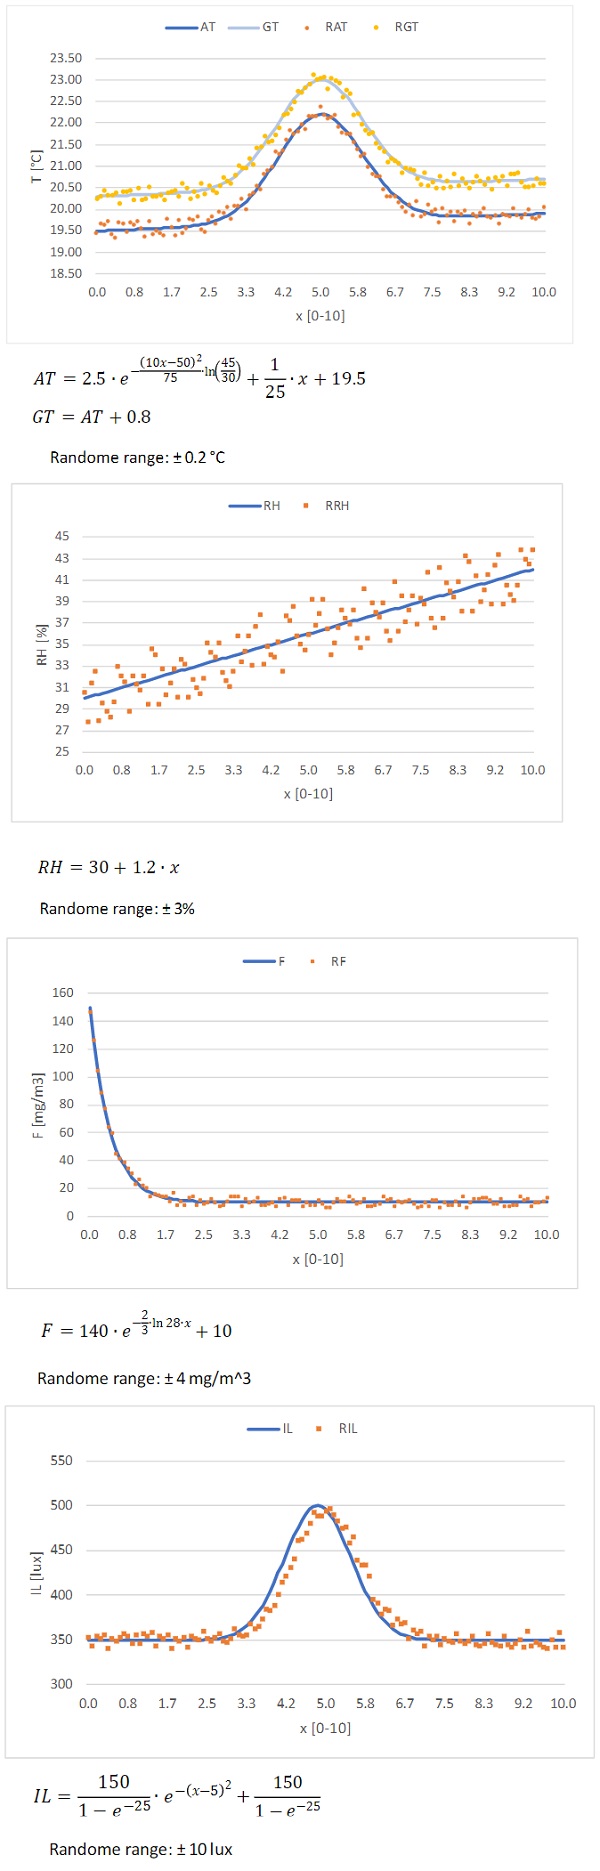
The artificial monitoring data was set up by assuming a trend for the single parameters during a typical day (Fig. 1). A curve for each monitoring parameter was defined. Then a random value range was defined to give a sort of a plausible shape to the data trend. Here below an example of 5 out of 9 parameters implemented (air and globe temperature – AT-GT, relative humidity - RH, formaldehyde -F, illuminance - IL).
These data have been used throughout the entire process to create the stable beta version of the tool, testing different scenarios and solving bugs.
2.2. Graphic user interface
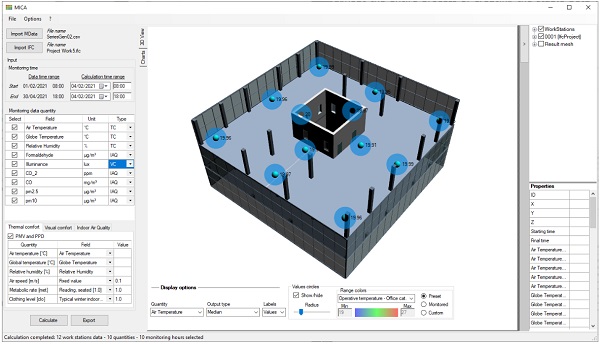
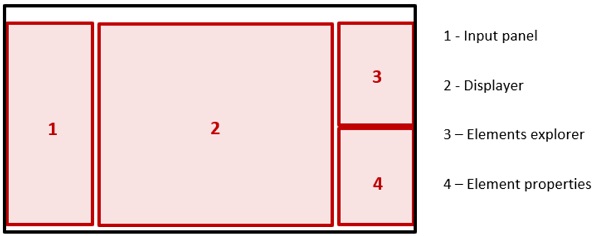
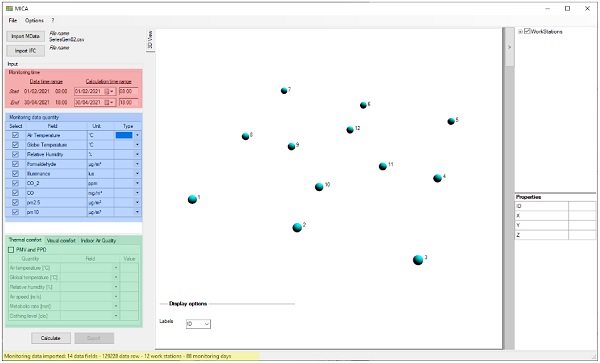
The Fig. 2 shows the layout of the GUI (Windows Forms documentation; Windows Presentation Foundation documentation) . On the left side of the GUI there is the input panel (Fig. 3 - Zone 1), where the user can select the monitoring data file, the IFC file to be loaded and set all the necessary settings for the calculation. By using dedicated widgets, it is possible to select the time range, the monitoring data quantities to be processed and other settings such as the quantity type for each parameter (which is necessary to the application for the association with the proper output menus), PMV and PPD.
In the middle position there is the viewer window (Fig. 3 - Zone 2), in which the user can visualize either the 3D model with the monitoring workstations or the different set of charts and set the display options by the bottom panel scrolling menus. The zone 3 of Fig. 3 is dedicated to the project explorer, where the user can show or hide the loaded elements, and in the zone 4 the property viewer shows attributes and processed data of the selected monitoring point.
2.3. Input
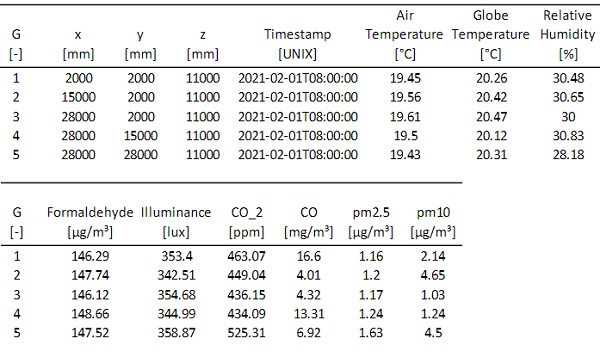
When selecting ‘Import MData’, a csv file with input data is required. The csv file needs to be formatted as follows (Table 1):
- Column 1: Monitoring point ID
- Columns 2-3 -4: Coordinates of the monitoring point according to the coordinate system of the BIM model
- Column 5: Timestamp of the monitored quantities
- Columns 6-n: All the available monitored parameters ordered at will
Furthermore, both the first row needs to be dedicated to the description of the column data and the second row to the related units.
Table 1: Extract of the csv file correctly formatted
Once the csv file has been uploaded, the application is able to show:
- the monitoring time range (red color, Fig. 4)
- the monitoring quantities in the table (blue color, Fig. 4)
- the monitoring stations (represented by little blue spheres) in the displayer
- the quantity context setting panel (green color, Fig. 4)
- a short log of the import processing (yellow color, bottom string, Fig. 4)
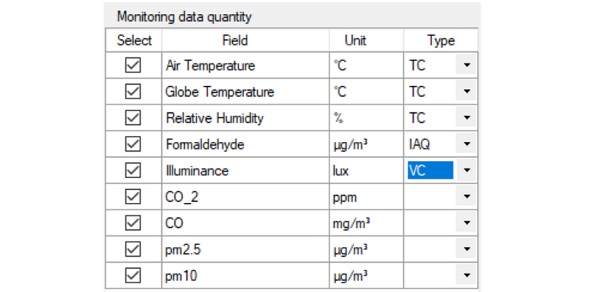
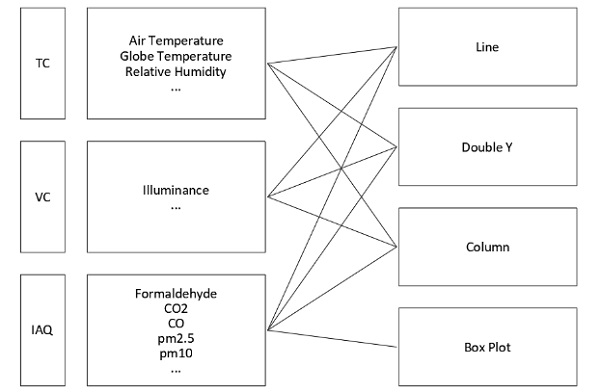
In the table of monitoring data quantities, the user is asked to associate each parameter with its “data context” such as Thermal Comfort (TC), Visual Comfort (VC) and Indoor Air Quality (IAQ).
The association can be set up in the ‘Monitoring Data Quantity’ (Fig. 4, blue color) in the ‘Type’ column (Fig. 5). This operation it is fundamental to enable the proper chart menu for each processed quantity after the calculation process (i.e., box plot type for CO2), and to perform additional calculations concerning the three contexts (i.e. PMV, PPD) which can be set in the setting panel (Fig. 4, green color).
In the current beta version of the application only ‘Thermal comfort’ was developed. The computation of PMV and PPD can be set up by using:
- monitored quantities
- manual assignment (this is necessary for metabolic rate and clothing level).
It is important to remark that the uncertainties of the measurements strongly affect the resulted PMV value (Alfano et al. 2020). It is also worth mentioning that PMV and PPD have several limitations in the façade zone due to the large variability of visual and thermal environmental parameters at the façade level (Alessandra Luna-Navarro et al. 2021). Monitoring stations closer to the façade register data of which results are on average more influenced by the façade in both the visual and thermal domain.
After having defined all the settings, the calculation can be performed. The application retrieves data from the CSV file, and then calculate average, median, minimum, maximum and last values of the selected quantities.
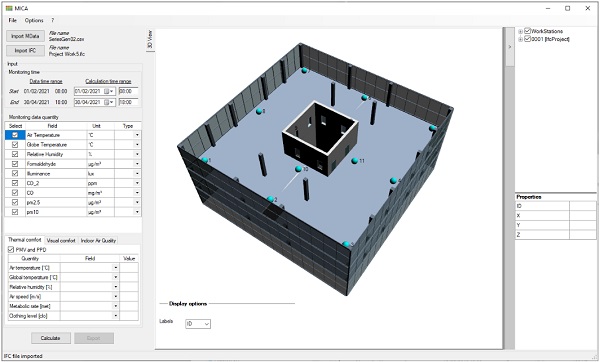
For the visualization of the BIM model of the building an IFC file is required (ISO 16739-1 2018) (either version 2x3 or 4). By selecting ‘Import IFC’ and then choosing the corresponding file, the building model it is shown in the displayer additionally to the monitoring points. This is particularly helpful for the user to associate processed values to a precise position in the space.
2.4. Output
As calculation output the ‘3D view’ mode or the ‘Charts’ mode can be alternatively enabled by the tabs at the top left position of the displayer (Fig. 7 - top left).
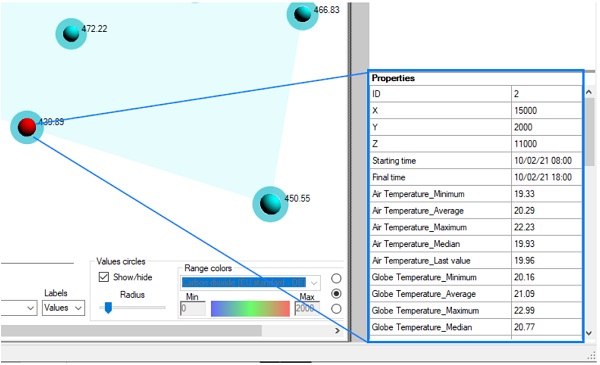
In the ‘3D view’ mode data are shown by coloured circles together with a numeric value. This latter could be the average, median, maximum, minimum, or last value of the measurement (Fig. 7).

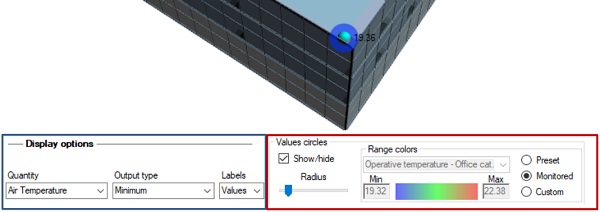
Quantity, Output type, Labels can be set in the “Display options” area (Fig. 8 - blue box). In the ‘Values circles’ panel (Fig. 8 - red box), visual properties of the representative circles can be tuned by changing the radius and setting up the range limits for the colour scale. The range scale can be set either by selecting ‘Preset’ for using some implemented references, or manually, or automatically by taking the lower and the upper limits according to the Quantity.
By selecting the monitoring points, the element properties table is filled in with the processed data (Fig. 9). At the end of this list there is an editable cell with “Comment” where the user can sketch out some helpful annotation.
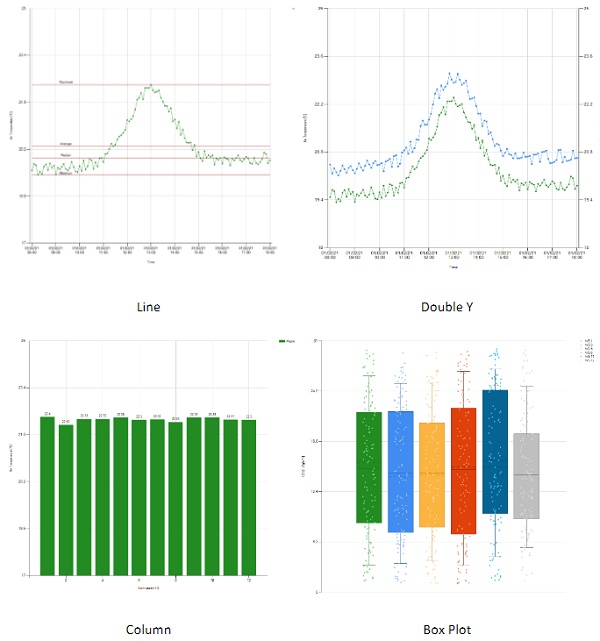
Regarding charts, currently four chart types are implemented: line chart, line chart with double Y axis, column chart, and box plots (Fig. 11).
In the ‘Charts’ mode, monitored and processed data are plotted according to the different chart type selected (see Fig. 10 blue box for chart type selection and Fig. 12 for the available chart type relating to each selected quantity).
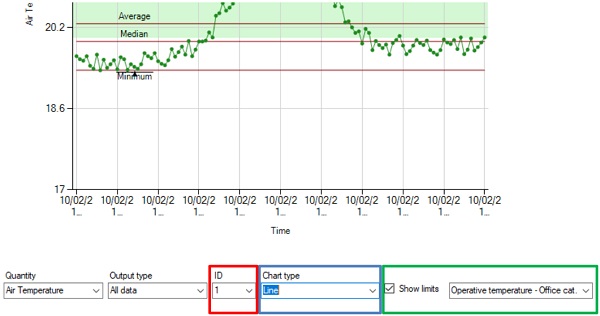
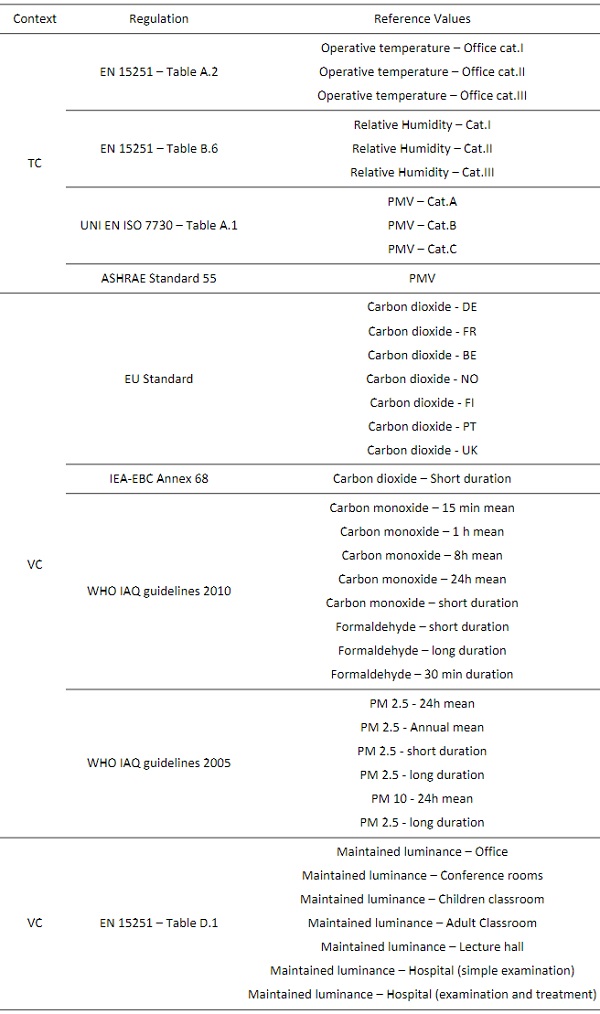
At the right side of ‘Chart type’ menu (Fig. 10 - green box) it is possible to enable the view of the reference limits according to the context of the processed quantities (table in Table 2) (ISO 7730 2005; EN 15251 2007; ANSI/ASHRAE 55 2017; IEA Annex 68 2017; WHO IAQ guidelines 2010; WHO IAQ guidelines 2006).
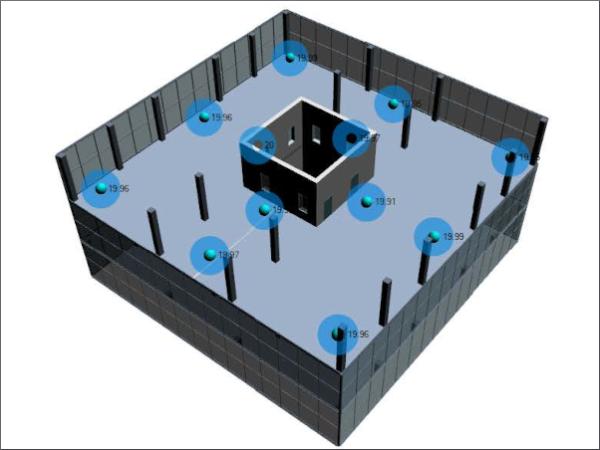
2.5. Export
Once data have been processed, they can be exported in an IFC file (ISO 16739-1 2018). The file will contain the monitoring points with their representative geometry (a little sphere) and the calculations of minimum, maximum, average, median, last values of all the processed data in the selected time range. Monitoring points are exported as IfcBuildingElementProxy element. Moreover, the time stamp and comments are exported as a parameter. The IFC file can be open by any IFC viewers (Fig. 13) or imported into any BIM software. Currently the IFC version used is the 2x3, the most used IFC version for the exchange of BIM data.
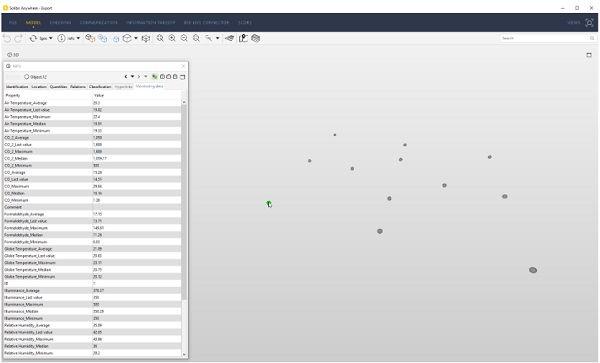
Table 2: Implemented reference values for verifications
3. Conclusions
MICA can properly display the monitoring data of building sensors, sharing information between different building actors using the IFC format. It is a solid platform to visualize, manage and identify the IEQ aspects of building based on real monitored data.
This kind of tool can be used throughout the different stages of the project development in the BIM workflow. For example, during the design stage, the BIM coordinator might simulate the possible scenarios (by using historical or normative data) together with the façade engineer.
The different tasks will be managed and coordinated on a shared platform by using the open format IFC, involving a simplification in the flow of information inside the work teams.
In a similar way to the BIM coordinator one, the Energy Manager might analyse the acquired data from the monitoring stations and communicate with the BIM Manager and the Facility Manager during operations and test stage to improve energetic performances and internal comfort.
There are some parameters that are expected to be directly influenced by the performance of glass, such as the illuminance and the air and globe temperature. Based on the glazing type, MICA could be also developed in a real-time processing version where, for example, a higher value of the illuminance enables input code which gives instructions to actuators for increasing/decreasing venetian blinds lamella’s inclinations or change particles orientation in electronic shadings.
As far as the key parameter’s calculation is concerned, PMV and PPD values must be taken carefully into account. The closer the workstation is to the façade, the more these parameters are variable and influenced in both the visual and thermal domain. Furthermore, as metabolic rate and clothing insulation are parameters that are difficultly manageable in real-time, maybe future works could be focused on determining alternative key parameters. These lasts could take advantage of the potential of the new IoT technologies, hence by gathering more information from the occupant in a non-disruptive manner.
The next step is the application of the tool in the real context using real-time data instead of made-up data. Moreover, several improvements can be done such as:
- Input – The input file could be extended to different file format, and/or directly connected to a database. Additional calculation settings could be implemented.
- Output – More chart types could be implemented. 3D outputs could even be displayed in chromatic maps which interpolate calculation values.
- Export – IFC could leave the possibility of saving the IFC file of the building with the analysed monitoring stations. The export settings could be more flexible by allowing both the choice of different ifcObject (something else than the more general IfcBuildingElementProxy) and different saving options (save as, overwrite). IFC version could be extended to the version 4.
- Process – At this stage the application works only on-premises. An online version of the application could be created, directly usable in the CDE.
References
ISO, Ergonomics of the thermal environment. Analytical determination and interpretation of thermal comfort using calculation of the PMV and PPD indices and local thermal comfort criteria ISO 7730:2005.
EN, Indoor environmental input parameters for design and assessment of energy performance of buildings addressing indoor air quality, thermal environment, lighting and acoustics EN 15251:2007.
ISO, Industry Foundation Classes (IFC) for data sharing in the construction and facility management industries — Part 1: Data schema ISO 16739-1:2018.
ANSI/ASHRAE, “ANSI/ASHRAE 55:2017 Thermal Environmental Conditions for Human Occupancy”, 2017.
Francesca Romana d’Ambrosio Alfano; Bjarne Wilkens Olesen; Palella, Boris Igor; Pepe, Daniela; Riccio, Giuseppe, Fifty Years of PMV Model: Reliability, Implementation and Design of Software for Its Calculation, 2020
IEA (International Energy Agency) Energy in Buildings and Community (EBC) Programme, Annex 68, Indoor Air Quality Design and Control in Low Energy Residential Buildings, 2017.
World Health Organization (WHO), WHO guidelines for indoor air quality: selected pollutants, 2010
World Health Organization (WHO), Air Quality Guidelines Global Update 2005, 2006
Visual Studio documentation, [Online]. Available: https://docs.microsoft.com/it-it/visualstudio/windows
C# documentation, [Online]. Available: https://docs.microsoft.com/it-it/dotnet/csharp/
Windows Forms documentation, [Online]. Available: https://docs.microsoft.com/it-it/dotnet/desktop/winforms
Windows Presentation Foundation documentation, [Online]. Available: https://docs.microsoft.com/it-it/dotnet/desktop/wpf
Xbim project, [Online]. Available: https://github.com/xBimTeam
Alessandra Luna-Navarro et al., Building Impulse Toolkit (BIT): a novel IoT system for capturing the influence of facades on occupant perception and occupant-façade interaction, Building and Environment, 2021
Thomas Parkinson et al., Continuous IEQ Monitoring System: context and development, Building and Environment, 2019
Abbreviation
BIM - Building Information Modeling
CDE - Common Data Environment
CO - Carbon Oxide
CO2 - Carbon Dioxide
CH2O - Formaldehyde
IEQ - Indoor Environmental Quality
IFC - Industry Foundation Classes
RH - Relative Humidity
MEP - Mechanical, electrical and plumbing
MRT - Mean Radiant Temperature
PM2.5/PM10 - Particular Matter
PMV - Predicted Mean Vote
PPD - Predicted Percentage Dissatisfied
MICA - Monitoring Internal Comfort Application
GUI - Graphic User Interface
TC - Thermal Comfort
VC - Visual Comfort
IAQ - Indoor Air Quality