First presented at GPD 2017
In the last years contentions about anisotropies (stress birefringence, which can cause visible appearances within the glass) among customers and manufacturers occurred when using glass products, such as heat-strengthened (HS) or fully tempered glass (FT). Findings from recent research activities show that anisotropies have to be evaluated in various aspects.
Furthermore, it is mandatory to rate anisotropies using a suitable assessment method. Within this article, RWTH Aachen University (RWTH) and University of Applied Science Munich (HSM) present two non-destructive methods, based on photoelasticity, for a full-surface evaluation. It is shown in particular that both methods are suitable for an objective evaluation of anisotropy. Firstly, a method to determine the edge membrane stresses is demonstrated, followed by the visualization and research of anisotropy within the glass pane.
1. Introduction
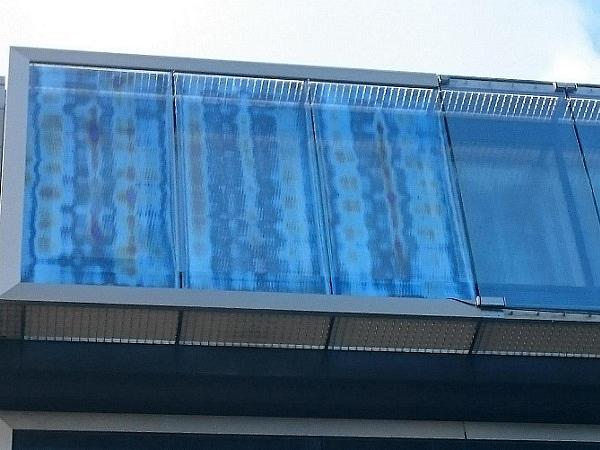
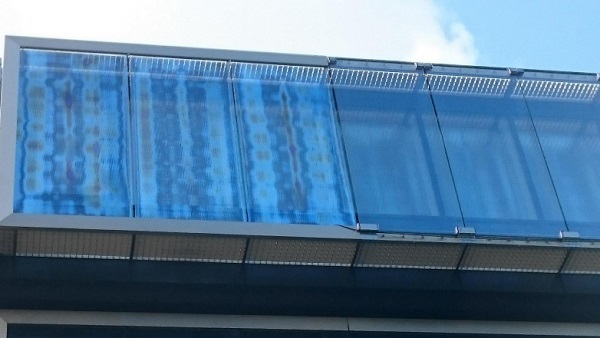
In the course of the production of thermally pre-stressed glass products, a nonhomogeneous distribution of the impressed prestressing within the surface of the glass pane can occur due to uneven cooling. If the prestress in all directions is locally unequal, the effect of the so-called stress birefringence results in visible iridescence phenomena, which often can be seen as grey to coloured stripes or spot patterns over the surface of the glass pane (cf. Figure 1). This phenomenon is also described as anisotropy. However, in [1] and [2] anisotropies are not characterized as a defect, but as a physical effect of thermally pre-stressed glasses.
The intensity of the anisotropies depends on the inhomogeneity of the thermally impressed prestress: the higher the anisotropy, the more iridescences can appear [4]. When (partially) polarised light occurs anisotropies can be optically detected. The higher the degree of polarisation, the better iridescence can be detected [5].
Polarised light is part of the natural environment and occurs by scattering and by reflection. The degree of polarisation of the light depends on several parameters, such as sun position or reflection angle. In a current research project the objective of research is to evaluate the glass quality by the basic requirements like strength, fracture and optics in a non-destructive way.
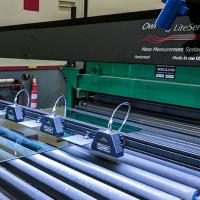
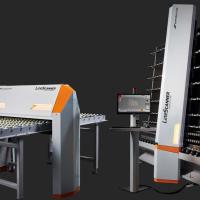
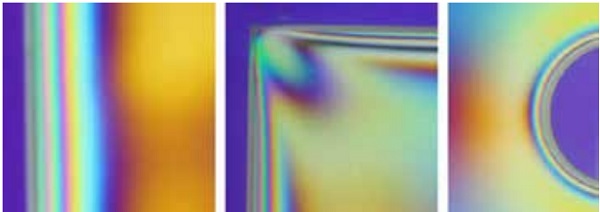
The project also includes the development of an evaluation algorithm for the calculation of the anisotropy as well as a measurement method for the determination of the edge membrane stress. One of the big advantages of the method is the 100% anisotropy evaluation of the surface by excluding unavoidable geometrical induced anisotropies like edges, corners or holes / bores (cf. Figure 2).
In this paper, first of all, the physical basis of anisotropy is discussed. Subsequently, the measurement method for the two-dimensional detection and description of the anisotropy in thermally pre-stressed glass panels is presented, compared with an already existing analysis method and, finally, first results are presented.
2. Physical basics
2.1 Circular polariscope
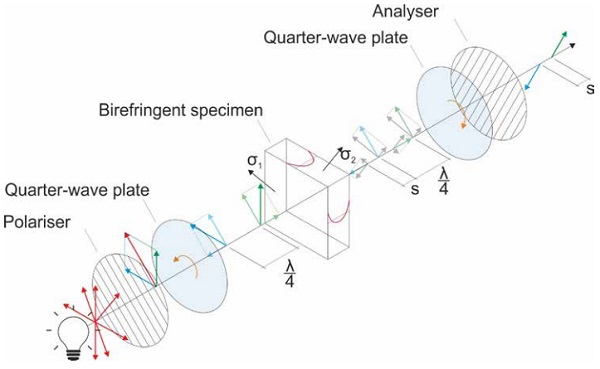
One method to study anisotropies in thermally toughened glass is by the use of so-called polariscopes. Within the scope of the performed investigations a circular polariscope was used. Circularly polarised light has no constant direction of oscillation and is, therefore, direction-independent. The setup of the used circular polariscope includes two polarisers and two so-called quarter-wave plates, which consist of birefringent material.
The first quarter-wave plate is placed directly after the polariser, the second is placed in front of the analyser. The polariser initially produces linearly polarised light, which, after passing through the first quarter wave plate, undergoes a circular polarisation. When entering the birefringent specimen (e.g. tempered glass), the light vector is decomposed into two components depending on the directions of the principal stresses. After exiting the specimen a retardation s can be detected (as shown in Figure 3). The circularly polarised light is again linearly polarised by the second quarter-wave plate and, finally, passes the analyser [6].
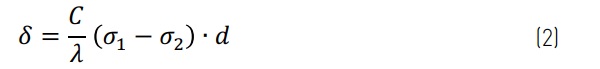
The resulting retardation s depends on the value of the differences of the principal stresses at a given point. The stress difference and the retardation are linked by the specimen’s thickness d and the so-called photoelastic constant C.

If, in addition, the path difference is referred to the wavelength (s/λ), the phase shift δ is obtained, which yields to the so-called main equation of photoelasticity:
If a birefringent medium, e.g. tempered glass, is viewed in a polariscope with monochromatic light, black lines occur due to interference. These black lines are called isochromats of 0th, 1st, 2nd, etc. order, depending on the magnitude of the phase shift. Isochromates indicate ranges in the test specimen which have the same principal stress difference σ1 - σ2. When using white light (compound of light with different wavelengths) these effects occur separately for each wavelength. Only the light of a certain wavelength is extinguished and the isochromats appear in the complementary colour of the extinguished light [6].
2.2 Edge characteristics
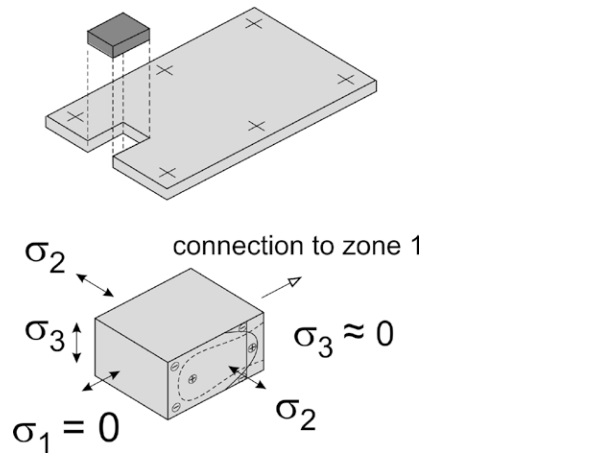
Tempered flat glass panes can be categorized into four zones by their stress distribution [7]. The plate surface with a sufficient distance from the edges and bores forms zone 1. The impressed pretension σ1 = σ2 in this region is reflected by a parabolic profile over the thickness. When approaching the edge of the plate (zone 2), σ1 perpendicular to the edge assumes the value zero, as illustrated in Figure 4. This effect leads to the fact that, by means of different stress-optical methods, the mean compressive stress σ2 (edge membrane stress) can be determined since the second unknown σ1 is omitted from the principal equation of stress optics.
3. Analytical methods for the evaluation
RWTH and HSM independently developed different analysis methods to determine stress differences in the plane of the glass in order to evaluate objectively the resulting anisotropies. In addition, a measuring method of the HSM is presented in order to study the edge compressive stress of thermally toughened glass by means of digital polarising filter images.
3.1 Method HSM
The analysis methods described here are based on the principles for determining the isochromatic order from polarising filter images by means of computer algorithms, as described in [8]. First, a method to determine the average edge membrane stress is explained. The determination of the stress σ2 on a free edge of a component by simply counting the isochromatic order is a known method, which can also be found in [6].
The method used requires a monochromatic light source or the division of the digital image (white light) into the three colour channels red, green and blue (RGB). Counting orders always starts from load-free or isotropic places. In the circular polariscope in combination with white light, these spots are dark (in contrast to the higher-order coloured isochromates).
For a precise determination of the edge membrane stress σ2, the wavelength of the light has to be known. A telecentric lens in combination with a white light source was used for laboratory tests to create polarising filter images (cf. Figure 5), which the location of the isochromates can be taken from.
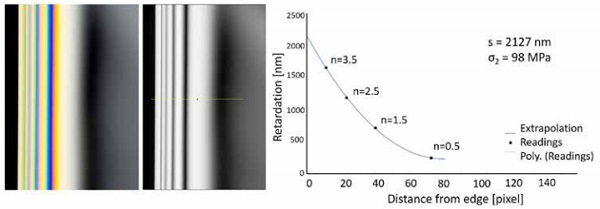
With the order n and the known wavelength λ of the light used, the associated retardation is determined for each isochromat by multiplication of the order with the wavelength. Since the maximum and minimum brightness alternate by half an order, a further point can be found between two isochromats.
The retardation s is determined by extrapolation of the supporting points as show in Figure 5. By means of the principal equation of photoelasticity and the knowledge that the principal stress σ1 at the edge is zero, the edge membrane stress σ2 can be obtained as a quotient of the retardation s and the product of the glass thickness d and photoelastic constant C.
The second analysis method, which has been tested at the HSM for the first time in 2014, can be used to determine the path difference in the glass surface for each pixel [3]. The digital evaluation of isochromatic images is the basis for the determination of a quantifiable, objective measurement for anisotropies in thermally toughened glasses.
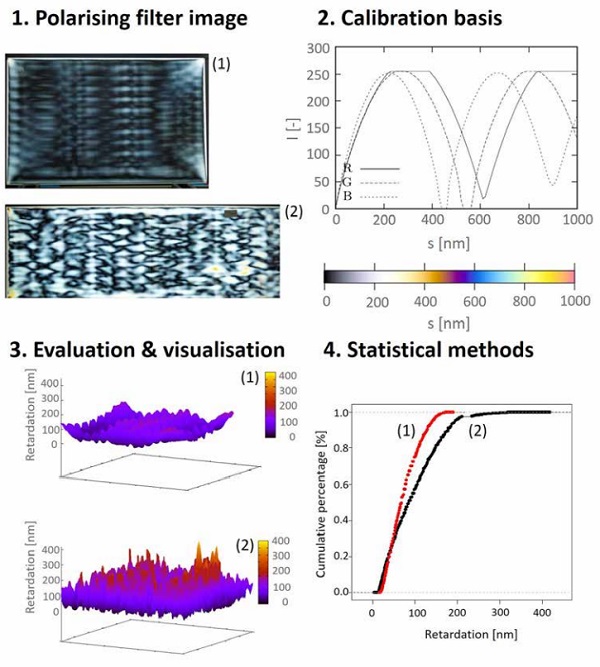
The sequence of the measurement method, as shown in Figure 6, starts with the recording of digital polarising filter images in the dark field of a circular polariscope. In order to obtain a correlation between colour and path difference, it is mandatory to calibrate the used camera, polariser and light source. The calibration procedure is described in detail in [8] and is based on the implementation of a BabinetSoleil compensator into the beam path.
Thus, it is possible to assign path differences to RGB intensities by increments 10 nm, which then can be split in 1-nm-increments by means of a further calculation. With the use of the calibrated polarising filter image the path difference of each pixel can be obtained by using an analysis software.
The algorithm compares the colour of each pixel of the image with the colour of the calibration base; the best match is calculated using the error sum [3] [8]. The results of the analysed image can be shown in terms of 3D plots. Further stochastic evaluation methods offer a possible tool for the evaluation of anisotropies.
3.2 Method RWTH
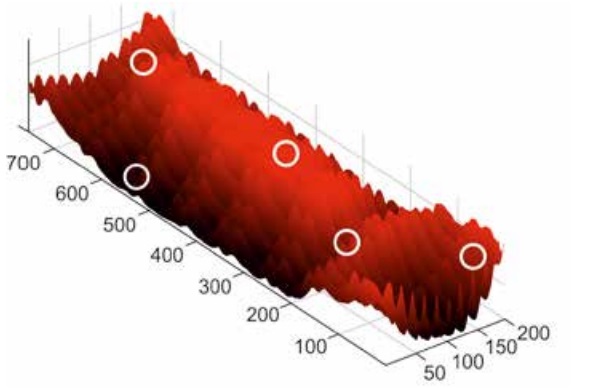
The analysis method developed by RWTH is a database solution for the two-dimensional analysis of anisotropies in the tempered glass. First of all, polarising filter images in the dark field are recorded with the physical setup shown in Figure 3, in order to gain the state of prestress distribution. Subsequently, the existing colour spectrum is measured, colour-conspicuous spots are marked on the generated polarising filter images as well as on the glass pane (cf. Figure 7) and the prestresses along the principal stress directions (σ1 and σ2) [7] are determined locally using SCALP-04 by Glass Stress Ltd.
Since the principal stress directions of the test specimen can vary within test specimens, it is necessary to determine them in advance. The measurements are carried out both from the air and from the tin side of the glass pane and then combined into a single curve. From the resultant parabola, the integrals of the principal stresses and the corresponding retardations are calculated by using the main equation of photoelasticity.
Subsequently, the corresponding colour in the polarising filter image is then assigned to each point and its associated retardation which results from the local measurement. The determined data points serve as support points for generating a database.
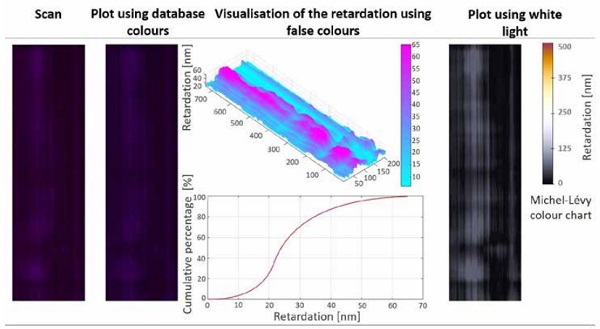
An analysis algorithm was developed to analyse the full-surface of glass panes for anisotropy. The algorithm analyses every pixel of the polarising filter images with respect to their colour and assigns a corresponding retardation by using the previously generated database. A plot with database colours is generated for visual comparison and control purposes.
The anisotropy within the surface of the glass pane is presented in a 3D plot of the retardation distribution in false colours, as shown in Figure 8, to highlight areas of high anisotropy due to differences in colour and height component. Since white light is not necessarily required to be used to generate polarising filter images, a plot simulates a virtual polarising filter image in white light according to the colour chart of Michel-Lévy [10].
A first step towards the objective evaluation of thermally toughened glass is the detection of the distribution of the anisotropy over the surface. In this respect, the program calculates the cumulative percentage of the retardation distribution and presents this in a graph. It should also be mentioned that an objective assessment is possible only if the underlying conditions are known in the context of the detection of the anisotropy.
3.3 Comparison
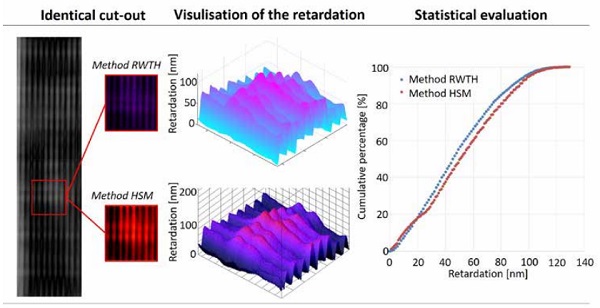
In order to compare both full-surface analysis methods, here an example is shown, that studies the same section of a polarising filter image of a thermally toughened glass pane. The evaluation was carried out with regard to the distribution and amount of the retardations over the cumulative percentage. It can be seen in Figure 9 that the two surface graphs are very similar in shape and structure. Light spots within the polarising filter image indicate a higher retardation than dark spots, which is correctly mapped in the evaluation of both methods and results in a wave-like surface of the 3D plots.
With a maximum value of 129.0 nm determined by the HSM method as compared to a maximum determined retardation of 126.5 nm by the method of RWTH, the peak values of both methods are very close to each other (deviation 0.98%). Deviations may result due to measurement inaccuracies and the calibration of both methods. In addition, the cumulative percentage curves resulting from the relative frequency distribution are very close to each other for both methods, especially with regard to the gradients of the curves. Overall, it can be observed that the peak values analysed show a good conformity.
4. Conclusion and summary
Within the scope of this article, two independently developed approaches for a full surface detection of anisotropies of thermally toughened glass products are described and compared. Furthermore, a method for the determination of the edge membrane stress is presented. It is found that the two methods for the analysis of anisotropy show a good agreement within the measurement results. In this case, the statistical evaluation presented can be used as a basis for a possible evaluation of anisotropy. However, a general assessment criterion is not yet defined, but criteria for assessing anisotropies are currently being developed by the glass industry.
In order to be able to integrate the obtained results for the detection of anisotropies in the production process of thermally toughened glass products, the aim of a research project between SoftSolution GmbH and VitroDUR GmbH is to develop an online procedure for quality assurance in cooperation with RWTH and the HSM. The quality of the stress distribution over the glass surface as well as the degree of prestressing should be reliably determined and documented.
5. References
[1] EN 12150: Glass in buildings - Thermally toughened soda lime silicate safety glass, 2015 [2] EN 1863: Glass in buildings - Heat strengthened soda lime silicate glass, 2012
[3] Illguth, M.; Schuler, C.; Bucak, Ö.: The effect of optical anisotropies on building glass façades and its measurement methods. Frontiers of Architectural Research, DOI 10.1016/j.foar.2015.01.004, 2015.
[4] Bucak, Ö.; Feldmann, M. et al.: Reproduzierbare und prüfbare Erhöhung der Qualität und damit der Leistungsfähigkeit thermisch vorgespannter gebogener Gläser. ZIM Endbericht, 2010 (unpublished)
[5] Feldmann, M.; Kasper, R.; Di Biase, P.; Kremens, T.; Bucak, Ö.; Illguth, M.; Wahlers, L.; Reckow, J.; Kubiak, R.: Qualitätskontrolle von ESG und TVG – Einsatz der Spannungsoptik. In: Der Stahlbau, Heft 3/12 , Ernst und Sohn, DOI 10.1002/stab.201201533, 2012
[6] Föppl, L.; Mönch, E.: Praktische Spannungsoptik. Springer-Verlag Berlin, 3. Auflage, ISBN 978-3-540-05534-1, 1972
[7] Feldmann M.; Kasper, R.; Langosch, K.: Glas für tragende Bauteile. Werner Verlag, ISBN 978-3-8041-1626-9, 2012
[8] Ramesh, K.: Digital Photoelasticity: Advanced Techniques and Applications. Springer Verlag, Berlin und New York, ISBN 978-3-54066-795-7, 2000
[9] Feldmann, M.; Schuler, C. et al.: Methoden zur Erfassung und Analyse von Anisotropien bei thermisch vorgespannten Glasprodukten. Konstruktiver Ingenieurbau. Bundesanzeiger Verlag GmbH Köln, 01/2017
[10] Sörensen, B.: A revised Michel-Lévy interference colour chart based on first-principles calculations, 2012
6. Acknowledgements
This work was developed within the framework of the research project “Gläsernes Glas” funded by the German Federal Ministry of Economics and Energy (ZF4053101GM5 and ZF4051701GM5) within the framework of the Central Innovation Program “Mittelstand” (ZIM). The authors would like to thank all project partners for the good cooperation.