Authors: Dániel Honfi, Johan Sjöström, Chiara Bedon, and Marcin Kozłowski
Source: Fire 2022, 5(4), 124; MDPI
DOI: https://doi.org/10.3390/fire5040124
Abstract
Despite much research and applications, glass material and its use in buildings is still challenging for engineers due to its inherent brittleness and characteristic features such as sensitivity to stress concentrations, reduction in strength over time and from temperature, and breakage due to the stresses that may build up because of thermal gradients. This paper presents the results of an original test series carried out on monolithic glass panes with the dimensions of 500 × 500 mm2 and different thicknesses, under the exposure to radiant heating.
The research study also includes a one-dimensional (1D) heat transfer model and a numerical, three-dimensional (3D) thermo-mechanical model that are used to investigate in greater detail the phenomena observed during the experiments. As shown, the behaviour of glass under radiant heating is rather complex and confirms the high vulnerability of this material for building applications. The usability and potential of thermo-mechanical numerical models is discussed towards experimental feedback.
1. Introduction
1.1. Background
A recent trend in modern architecture is to provide maximum transparency to the building interior by reducing visual obstructions of the structural frame and envelope [1]. This movement includes the increased use of self-supporting glass structural elements and large glass panels for the façade of the buildings.
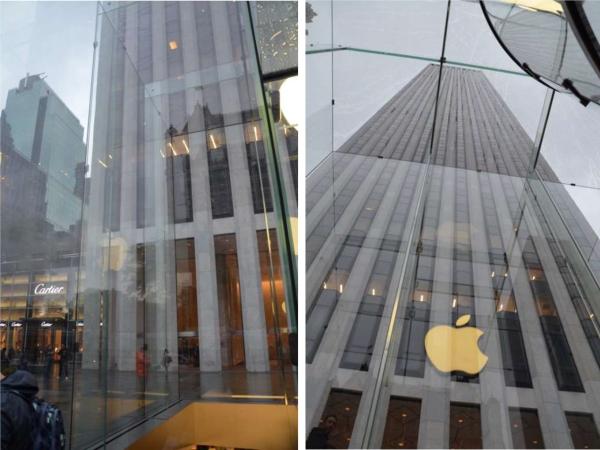
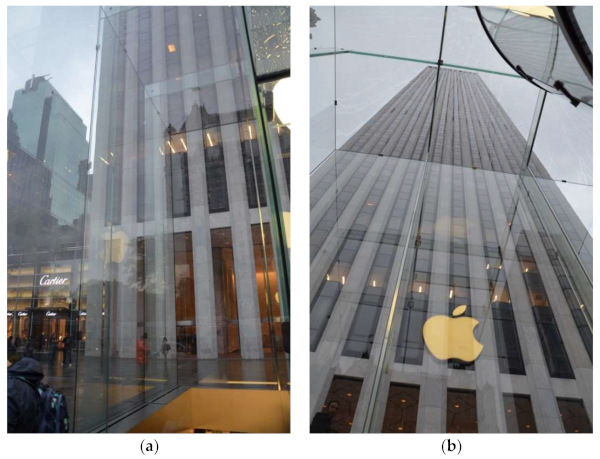
Glass has rapidly developed from an infill to a structural material, thus enabling engineers to design and build walls, beams, columns, floors, stairs, etc., and use spans and large transparent areas that have not been possible before. A well-known example of maximising transparency is the Apple store on Fifth Avenue in Manhattan (see Figure 1). However, the structural design of glass is still challenging, e.g., due to its inherent brittleness, sensitivity to stress concentrations, reduction in strength over time, and possible thermal breakage [2]. Furthermore, several other issues in relation to safe and economical structural design can be accounted to the relatively common degradation of materials used in combination with glass (due to severe humidity and temperature variations, or unfavourable operational conditions for vibrations, etc.).
There are methods and solutions to improve the robustness of glass structural application, including increasing the strength of glass, such as thermal treatment, pre-stressing, edge polishing, and preventing, or mitigating the risks of brittle failure, e.g., by careful detailing, lamination, composite members, backup systems, provision of alternative load paths, etc. [3]. Exceptional situations, such as elevated temperature during a building fire, are challenging and require further considerations of such robustness measures to ensure the safety of the building occupants and allow for evacuation [4]. The primary design strategy is to limit stress in the material and reduce the consequences of breakage, as fracture of glass panes cannot be avoided completely. Yet, it is important to understand under which circumstances glass might crack to develop a rational basis for extreme design situations.
1.2. Aims, Scope and Limitations
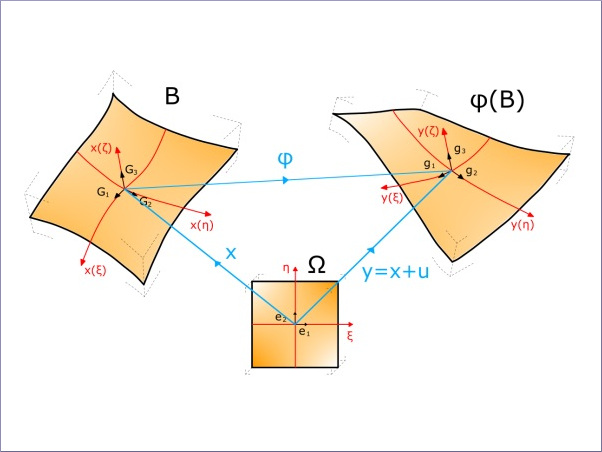
This paper focuses on the experimental and numerical analysis of the thermo-mechanical behaviour of monolithic glass panes exposed to radiant heating. Its aim is to help in filling up the knowledge gaps mentioned in Section 2, and take an initial step towards developing a methodology for a more rational structural fire design and assessment for architectural glazing. This includes an approach where the expected temperature distributions in the structure are simulated via numerical modelling, and the corresponding stresses are calculated using a thermo-mechanical finite element (FE) model. The calculated stresses can then be checked against specific design criteria to decide if the safety against thermal breakage is fulfilled. A main advantage of this approach is the analysis of temperature distribution in the entire structural element and the possibility to combine the effect of thermal and mechanical actions.
To make this approach a viable design methodology, one should develop reliable numerical models and design criteria, which requires verification through testing and modelling. A major problem is that measuring the relevant strains at the surface of glass exposed to heat is relatively difficult. This is because (1) the order of the strains is typically smaller than at tradition structural applications under significant mechanical loading, and (2) the measuring equipment (e.g., strain gauges) needs protection against heat. In addition, the application of contactless measurement systems, e.g., Digital Image Correlation, is also limited due to the transparent nature of glass and immediate vicinity of heat source. Therefore, in this study, only temperature was measured at certain locations and the results were extrapolated to obtain a temperature field at the entire specimen.
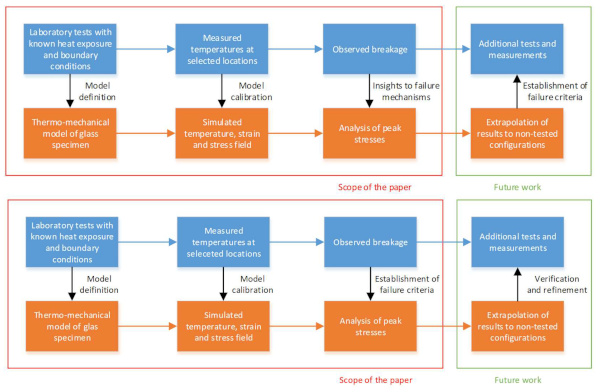
The process is illustrated in Figure 2, highlighting the scope of the current study and the possible future continuation. The paper is limited to the analysis of the stress field in glass specimens. It is primarily due to the insufficient data of the tensile strength of glass at an elevated temperature. Thus, the knowledge obtained in the study is an important foundation for further work.
2. Breakage of Glass at Elevated Temperature
2.1. Strength of Structural Glass
Glass, due to the presence of microscopic flaws on its surface, shows a large scatter in failure strength at the structural level. The resistance of glass elements also depends on various factors, such as the size of an element, strain rate, and load history. Furthermore, the presence of residual stresses from the manufacturing process might alter the inherent strength of glass. Thus, the characteristic strength of float, i.e., annealed (AN) glass, is quite low compared to the compressive strength of glass at material level.
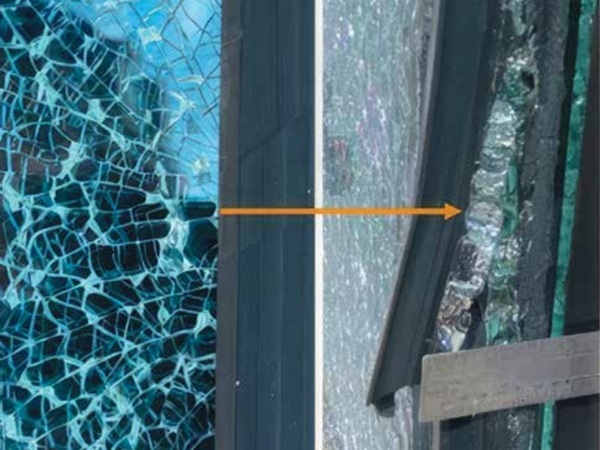
One way to improve glass strength is by introducing “thermal pre-stress” due to the heat treatment (tempering) process. Applying heating and rapid cooling introduces compressive stresses to the surface of the glass (and tensile stresses to the core). Toughened, fully-tempered (FT) glass has the highest level of prestressing (above 90 MPa). Due to the high residual surface compression and core tension, it breaks into small fragments at much higher loads than AN glass. Heat-strengthened (HS) glass is produced using the same principles as FT but with a lower cooling rate, which leads to a lower residual stress level (~30–50 MPa). The effect of this is a load-bearing capacity between AN and FT glass and an intermediate fragmentation pattern. AN glass has negligible surface stresses and breaks into large (potentially dangerous) shards.
Due to the various level of prestressing, the characteristic strength of AN, HS, and FT glass is different, 45, 70, and 120 MPa, respectively [5]. It should be noted that these values relate to the strength at room temperature, while it is known that elevated temperature reduces glass resistance [6].
2.2. Previous Studies on Glass Breakage at Elevated Temperature
Glass breaks due to the stresses that may build up in several ways. For instance, in non-load-bearing insulated glass units, a pressure difference between the sealed cavity space and the surrounding air occurs due to the changes in temperature and barometric pressure that may lead to significant stresses, especially in stiff or curved panels [7]. Wind pressure also induces stress, which in severe conditions may cause glass failure and other extreme loading conditions such as seismic events, blast loads, or impact loads [8]. However, the most common exposure that can easily lead to cracking of windows made of annealed glass is thermal exposure, leading to significant difference in temperature between various parts of glass panes (e.g., the edges and the centre). This phenomenon typically occurs during days with clear sky conditions, intense solar radiation, and high daily ambient air temperature variations. In addition, fire in the building or its proximity leads to large temperature gradients in glass panes and causes glass fracture and fallout of glass facades [9,10]. Glass breakage may even occur due to the combination of mechanical and thermal stresses. Studies related to the actual interaction of mechanical and thermal damage propagation are still limited in the literature and are definitely worth investigating.
There is, however, a significant knowledge gap concerning the structural performance of glass at elevated temperatures, because the available information about the effects of temperature changes on the thermal and mechanical properties of glass is limited [11]. This includes, in particular, the changes in the modulus of elasticity and tensile strength of glass with varying temperature at elevated levels. These two are critical parameters for the determination of the structural capacity of glass components and assemblies; thus, better insight into these processes would enable a more efficient structural fire design. Temperature sensitivity can include variations in mechanical and 4hermos-physical properties for glass members, thus, even minor thermal variations should be adequately addressed at the local and component/system level.
The heat transfer and thermal breakage of glass have been studied extensively in recent years [12,13,14]. Despite these efforts, the 4hermos-mechanical modelling of structural glass components is challenging, as the complex phenomena leading to fracture are not fully understood. This is partly due to a lack of experimental data and difficulties in comparing the results of previous studies, as scientific papers might not provide all details required for developing and verifying analytical or numerical models. This situation is also reflected in the preliminary European standard prEN thstr: 2004 [15]. It specifies the allowable temperature gradients for monolithic glass depending on the glass type and edge condition. Despite its simplicity, this approach has many disadvantages and can lead to uneconomical solutions. Furthermore, literature studies including experimental and/or numerical analyses of glass systems under fire are, in most of cases, focused on specific layouts, boundary conditions, and loading configurations (due to experimental cost, setup limits, etc.).
The investigation reported in [16], for example, presents experimental and coupled thermo-mechanical studies on laminated glass beams under in-plane bending and fire exposure. Vedrtnam et al. [17] studied the effect of non-uniform thermal exposure on the load-bearing properties and performance of monolithic glass elements, with experiments and simulations, for elements intended in vertical position (as it is for windows, walls, etc.). Finally, the numerical analysis in [18] gives evidence to current issues and uncertainties in estimating fire-induced effects for load-glass elements subjected to mechanical loads, including considerations on the predictability of the “failure” condition.
Due to the rapidly increasing computational power of computers and the availability of advanced software tools, the application of numerical analysis methods in fire-related investigations has become very popular in the recent year for various materials and feature types, see e.g., ref. [19,20,21,22]. Among the intrinsic advantages of numerical tools and techniques that can support structural design and research investigations, the reliable thermo-mechanical characterisation of glass and related materials under thermal exposure can represent a critical step for predictions about structural performance. At the same time, further challenging issues are represented by the relatively high scatter of tensile resistance that is typical of glass elements.
3. Summary of Experiments
3.1. Testing Programme
The primary purpose of the experimental study was to study heat transfer in monolithic glass panes heated by radiation and the coupled phenomena possibly leading to thermal breakage. The data is thereafter used for validation of the thermal model coupled with mechanical behaviour.
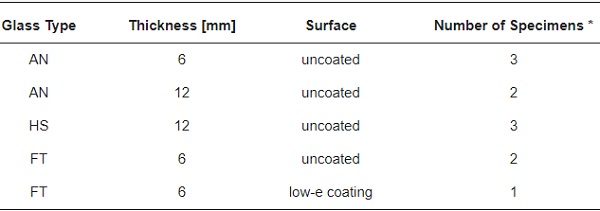
A total of 11 single monolithic glass specimens were exposed to constant incident radiant heat flux (irradiance) from a propane-fueled burning gas panel with a surface area of 500 × 500 mm2, mostly operating with an emissive power of 64 kW/m2. The tests typically lasted until the glass cracked or the steady-state thermodynamic equilibrium had been stabilised. Annealed (AN), heat-strengthened (HS) and fully toughened (FT) monolithic glass panes with an area of 500 × 500 mm2 and a thickness of either 6 or 12 mm were used. One specimen was covered with a transparent low emissivity (low-e) coating, whereas the other had clear surfaces, see Table 1. The basic test setup is shown in Figure 3.
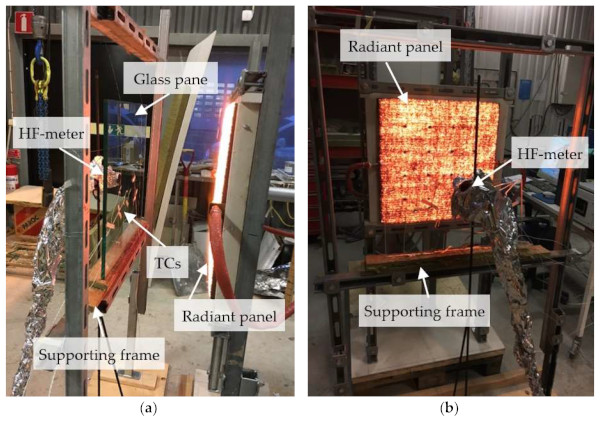
Table 1. List of specimens (* total number of specimens: 11).
The glass specimens were mechanically unrestrained, placed on a continuous soft support (made of mineral wool), mounted to a frame, and loosely stabilised with steel wires. A water-cooled Schmidt–Boelter heat flux (HF) gauge ensured that the incident heat flux was constant along the centreline from the panel at a distance dp. Once stability was reached, the HF gauge was moved back to a position dHF. A glass specimen was thereafter placed concentrically to the panel with its exposed surface at a distance dp. The Infrared transmittance of the glass pane could thus be estimated by measurements before and after placement of the (initially cool) glass pane.
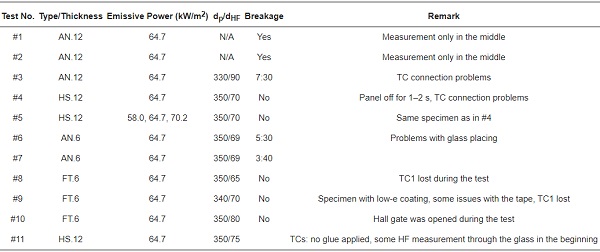
The temperatures on the glass surface were measured with 0.5 mm class 1 type K thermocouples (TC) with an accuracy of ±1.5 °C. The TCs had an aluminium foil around their tip to protect them from direct radiant heating. Typically, three TCs on the exposed and unexposed side, respectively, were applied to each specimen, see Figure 4. Details concerning the tests is shown in Table 2.
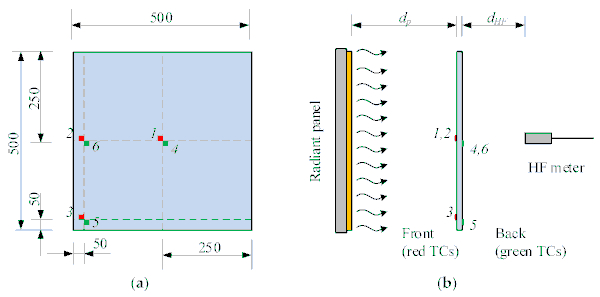
Table 2. Overview of the tests.
3.2. Test Results
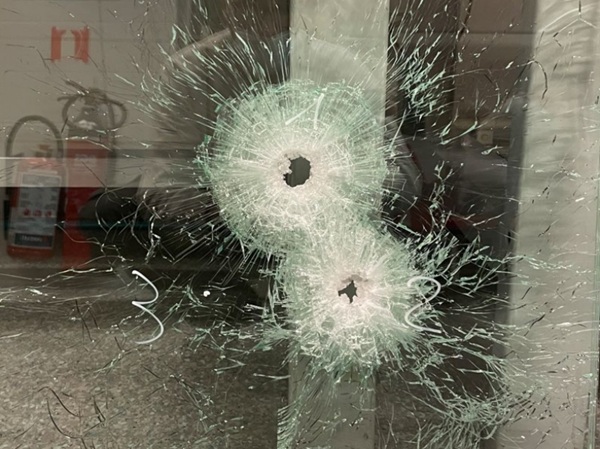
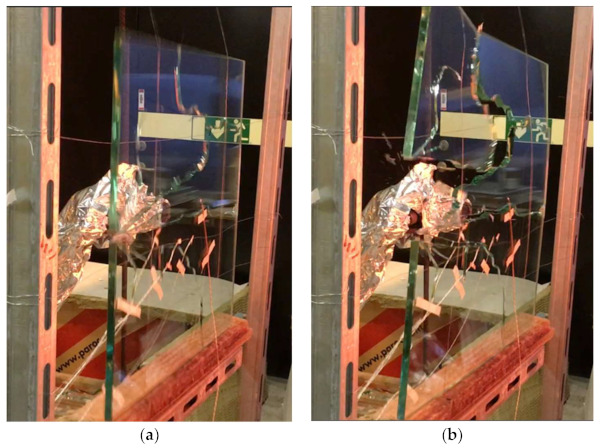
All AN glass panes broke, whereas all HS and FT samples remained intact (Table 2). The typical breakage pattern is shown in Figure 5, with the crack origin located in the middle of an edge. The crack does not run straight, but diverges in different directions and propagates in the form of a wave shape, typical for the thermal breakage of glass. The same phenomenon was observed for the remaining samples that cracked.
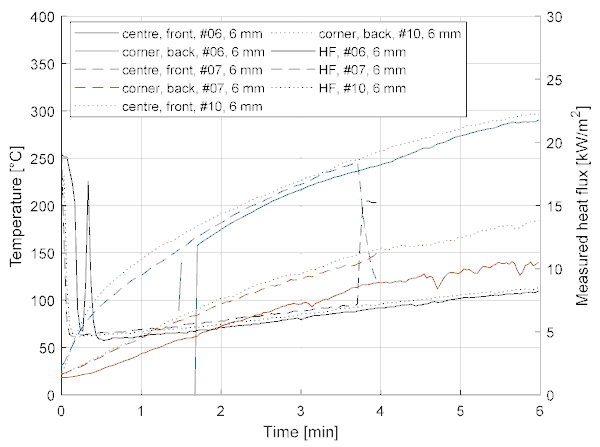
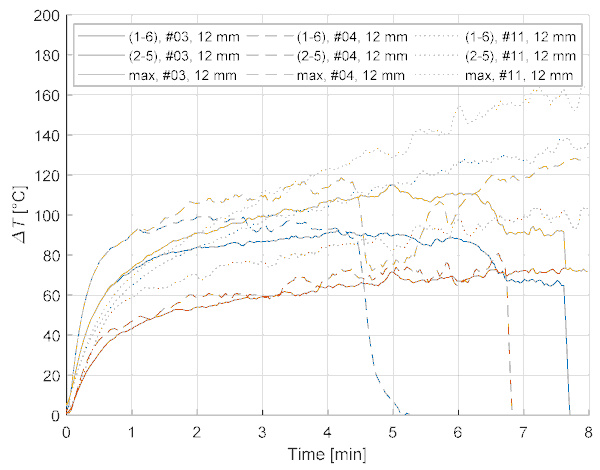
Typical test results are presented in Figure 6 (#3, #4, #11 for 12 mm thickness) and Figure 7 (#6, #7, #10 for 6 mm thickness), showing the measured temperatures (at different locations, i.e., centre/corner and front/back) and the measured heat fluxes.
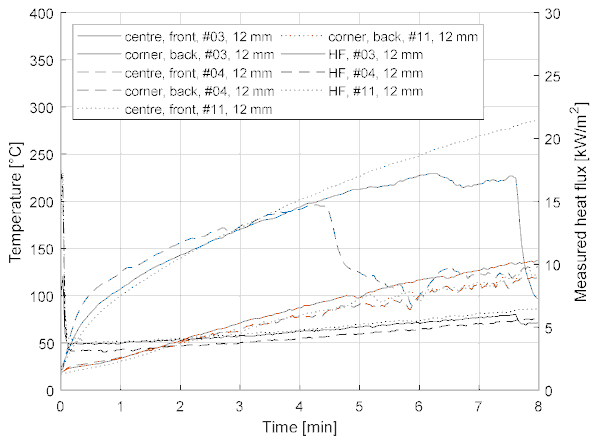
The temperature at the extreme locations, i.e., centre front (TC1) and corner back (TC5), are very similar between the tests for the 12 mm thick samples (Figure 6). Furthermore, the breakage of the AN specimen #3 around 7:30 can be identified from the graph as a sudden drop in TC temperature. Problems of loosened TCs can also be noticed for the 6 mm specimens (Figure 7) as well as some contact issues for corner back (5), test #6. The breakage at test #7 can be observed around 3:40 (dashed lines); however, the breakage of specimen #6 (at around 5:30) goes unnoticed from observing the solid lines, because the bottom part of the broken glass stayed in place.
Similar patterns can be observed in Figure 7 showing selected results for the 6 mm specimens. Despite some disturbances in the measurements in test #6 which are reflected in the discontinuities in the solid blue line, i.e., the signal of the centre front TC (TC1), the compared three tests show very similar trends and values with respect to the evolution of the measured temperatures and heat fluxes. One exception is the corner back TC (TC5) in test #6 which might be related to the issues with putting the glass in place during the test. From the figure, one could clearly see the breakage of test #7 around 3:40, indicated by the sudden changes in the dashed lines.
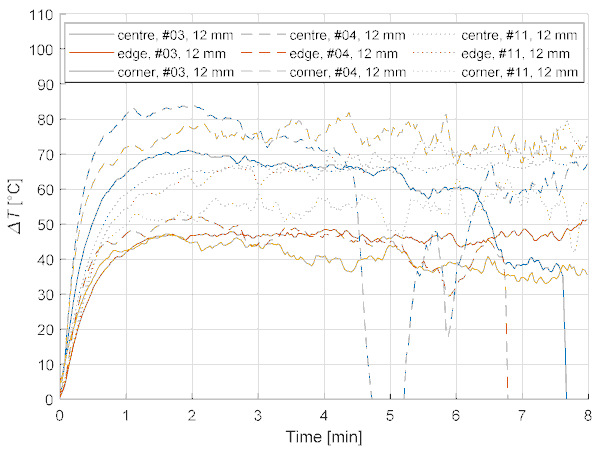
The cracks at annealed glass breakage were always initiated at the middle of the edge (Figure 5). The thermal gradient has a through-the-thickness, a horizontal, and a vertical in-plane component leading to thermal stresses and strains in the glass. The evolution of the through-the-thickness differences are shown in Figure 8 (for 12 mm specimens), and the horizontal and a vertical in-plane differences are illustrated in Figure 9 (also for 12 mm specimens). As the pane expands unevenly in different directions due to the uneven temperature gradient field, internal restraints develop, resulting in significant stresses which can crack AN glass. The effect of the in-plane differences (Figure 9) is much higher than the pure through-the-thickness values (Figure 8) and often continue to grow even after the through-the-thickness differences have stabilised after 1–2 min, confirming their contribution to breaking stresses.
No breakage occurred for HS and FT specimens during the tests, reflecting their much higher strength compared to annealed glass and their potential for applications where high thermal stress is expected.
3.3. Transmittance and Effect of Coating
Since glass is transparent, a certain amount of heat will be transmitted through the glass immediately, and the remaining heat will be partly absorbed and partly reflected. How much of the heat is transmitted depends on the thickness of the glass pane. The thicker the pane, the less heat it will transmit. Transmittance can be expressed as the ratio of the heat flux captured by the HF meter right after and before the specimen was put in the way of the heat. The average values are 0.23 for 6 mm and 0.19 for 19 mm.
As mentioned before, one of the specimens (#9) was covered by a low-emissivity coating. The reason for this was to see if such coating, applied for reflecting infrared and ultraviolet light to improve energy efficiency and indoor climate, would have a significant effect on the heat transfer of relatively high temperatures that may develop during building fires. Therefore, the evolution of the temperature and transmitted heat flux was compared for three 6 mm thick FT specimens: #8 and #10 without and #9 with low-e coating. FT specimens were selected for this comparison since they were not expected to break during the test. The results are presented in Figure 10.
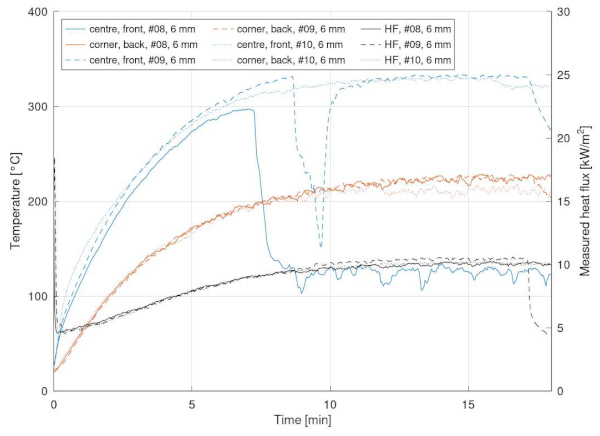
Unfortunately, TC1, the centre front thermocouple, became detached during the tests for #8 and #9, see the solid and dashed blue lines. Furthermore, the distance to the panel dp and to the heat flux dHF were slightly different in the three tests (see Table 2). Despite these difficulties, the results indicate that the effect of low-e coating on the heat transfer is negligible in the long run. There are some differences in the initial phase on the exposed side that could be related to both the variation in distance to the heat source and the effect of the coating. However, in the long run, these differences seem negligible. At the corner back (TC5), the curves are almost identical. The transmittance of the coated glass pane was the same as the average of the other specimens with 6 mm thickness, i.e., 0.23.
4. Heat Transfer in Glass and Numerical Modelling
4.1. Heat Transfer in Glass
In case of a fire, a glass element would be subject to both convective and radiative heat transfer. The incident radiation, from a flame, hot gas layer, or other heated parts of the building, would act on the surface where approximately 15% of the irradiance would be directly reflected [13]. The remaining 85% is partially directly absorbed by the surface and partially transmitted into the material where it is absorbed in the depth, such that the attenuation follows an exponential decay with distance into the material. If the specimen is not too thick, a portion of the radiation would eventually be transmitted through the whole thickness and passed through to the other side, not contributing to heating as for opaque materials. However, most glasses are far less transparent in IR-wavelengths compared to the visual ones. As the glass heats up, it also increases the emitted radiation from its surfaces according to Stefan–Boltzmann’s law.
The surfaces are also subject to convective heat transfer where very rapid heating can occur should flames directly impinge on the specimen and slower heating will occur from hot gases. Should the gases be of ambient temperature, the surfaces will instead be convectively cooled as they heat up from radiation. The convective heat transfer is usually approximated as proportional to the temperature difference between the surface and the surrounding gas, where the proportionality constant is determined by the thickness of the boundary layer between still and flowing gas. The heterogeneous heating of the specimen is balanced by thermal diffusion within the material although the thermal diffusivity of glass is only ~0.5 mm2/s, about 30 times less than, e.g., steel. Thus, temperature gradients are inevitable, and these gradients are the origin of internal stresses in the specimen.
4.2. Description of the 1D Model
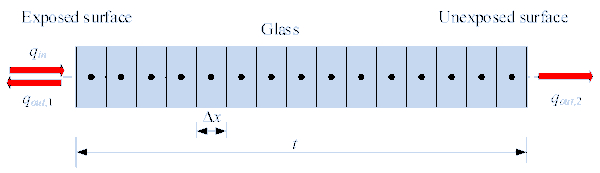
A simple 1D heat transfer model was developed in Matlab [23] to calculate the temperature at the exposed and unexposed sides of the glass in the centre. The model is based on the method of finite differences to solve the partial differential equation that describes heat transfer through the thickness of glass, similar to [24,25]. The glass thickness is divided into 15 finite elements each with a size of Δx.
The complex heat transfer phenomena are simplified as equivalent heat conduction within the glass pane and convection and radiation at the surfaces where the material is in contact with the ambient air. The through-the-thickness absorption and emission were assumed lumped at the node at the exposed surface (Figure 11).
The differential equation describing the heat transfer within 0 < x < t (x = 0 for the exposed surface) is expressed as:

where λ is the effective thermal conductivity (1.032 W/(m·K) including the effect of conduction and radiation through the glass), ρ is the glass density (2500 kg/m³), cₚ is its specific heat capacity of glass (816.783 J/(kg·K)). All these parameters were assumed as independent of temperature T. Note that these values are based on previous studies and might have been associated with certain uncertainties. Thus, additional data about these basic parameters are required in the future to improve the efficiency and reliability of numerical investigations.
The heat balance at the node closest to the exposed surface is expressed as:
![]()
where qᵢₙ is the incident heat flux to the glass (including the effects of transmittance, absorptance, and reflectance) and qₒᵤₜ,1 is the heat flux from the specimen (including the effect of convection and emission through radiation).
At the node closest to the unexposed surface, the heat equation is given as:

where
![]()
represents the heat flux due to convective and radiative heat transfer between glass and the ambient air.
The heat fluxes emitted from the glass
![]()
are calculated as:
![]()
where h is the convective heat transfer coefficient, ΔT is the temperature difference between the glass surface (Ts) and the ambient air (Tair = 292.15 K), ε is the surface emissivity (0.94, defined through spectrally resolved measurements [13]), and σ is the Stefan–Boltzmann constant (5.67 × 10⁻⁸ W/(m²·K⁴)).
The h coefficient for a vertical plate with natural, laminar convection is calculated as:
![]()
where k is the thermal conductivity of air (0.026 W/(m·K), Gr and Pr are the Grashof and Prandtl dimensionless groups, respectively, and l is the flame height (0.185 m).
Gr is expressed as:
![]()
where g is the gravitational constant (9.81 m/s²), β is the coefficient of air expansion (3.41 × 10⁻³ K⁻¹), while ν is the kinematic viscosity (1.51 × 10⁻⁵ m²/s).
Pr is given as:
![]()
where α is the air thermal diffusivity (2.11 × 10⁻⁵ m²/s). The incident heat flux (qᵢₙ) applied was 21.2 kW/m². This was calculated from a 64.7 kW/m² emissive power of the radiant panel at a 350 mm distance considering the relevant view factor at the centre of the pane as described later in 4.2. A further assumption included in the value was that 15% of the incident heat flux is reflected from the exposed glass surface.
4.3. 1D model Results
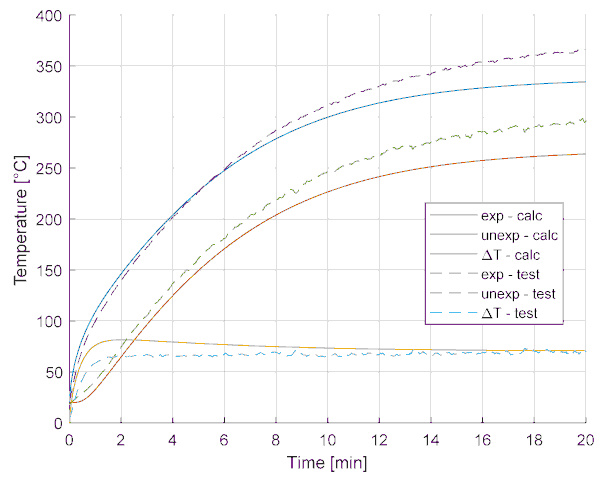
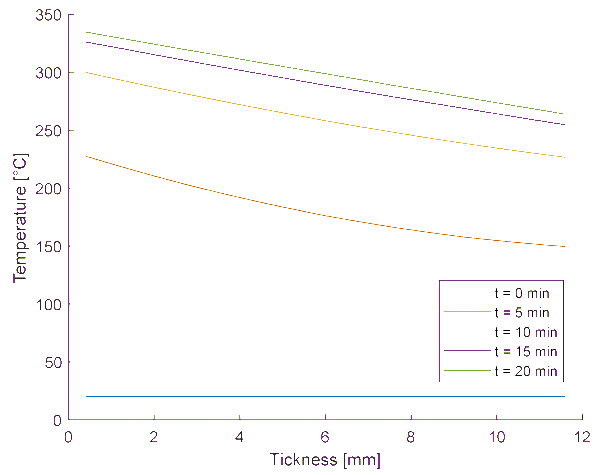
The numerical model results match the test results fairly (see an example in Figure 12) as far as the temperature development at the centre of the panes is of interest. Besides the temperature values at the panes’ exposed and unexposed surfaces, the temperature profile’s time evolution through the thickness can be studied (see an example in Figure 13). It is clear that a constant thermal difference across the thickness is established quickly and remains constant, although the temperature of the whole glass pane increases. However, if one wants to understand more about the underlying phenomena relating to the thermal breakage of glass, a more complex numerical model is required.
5. Thermo-Mechanical Finite Element Model
5.1. Modelling Assumptions
Obviously, the 1D model, presented in Section 3, is limited because it does not consider in-plane heat transfer in the glass pane, and thus it cannot be used for investigation of thermal stresses developed due to internal restraints. Therefore, a 3D finite element numerical model has been developed in Abaqus [26] to simulate the thermo-mechanical behaviour of the glass pane.
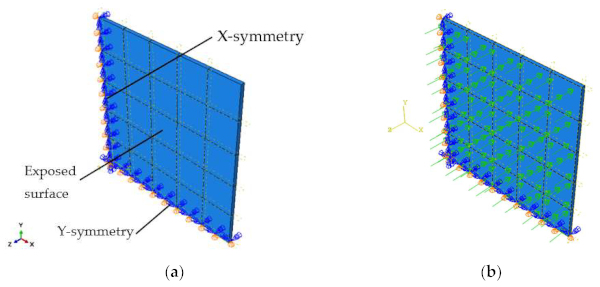
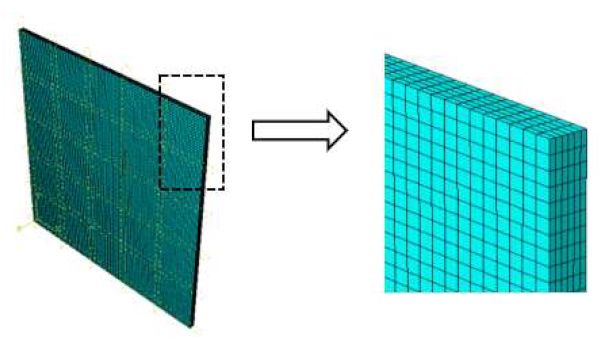
A one-quarter of the pane was considered in the model with appropriate symmetry conditions at two edges to minimize the number of finite elements and increase the computational efficiency of the simulations (Figure 14a). The glass pane was modelled with a set of 3D continuum elements consisting of 8-node, coupled displacement-temperature solid bricks with full integration (C3D8T type from Abaqus element library). Following a mesh sensitivity study aiming at the verification of the mesh quality, a regular mesh pattern was applied to the glass pane. From the study, it was found that the model with elements with an edge length of 50 mm (in-plane) and five solid elements in the thickness of the component converges to a sufficient degree (Figure 15). Further refinement of the mesh produces results that do not differ by more than 1%.
A fully coupled thermo-mechanical analysis was used. It allows for one-way coupling, in which an uncoupled heat transfer simulation drives a stress analysis through thermal expansion. The stress and temperature evolution in the glass panel was continuously monitored through simulation at selected control points representative of critical regions for the examined setup. The approach has been successfully utilized in previous studies [18].
Convection using a convective heat transfer coefficient of h = 9 W/(m²·K) and an ambient air temperature of 22 °C was applied to both large faces and emitted radiation with an emissivity of ε = 0.94. In addition, the material properties of the glass were assumed to be temperature-independent with the values at 22 °C from [13], ρ = 2500 kg/m³, E = 70 GPa, thermal conductivity λ = 1.032 W/(m·K), cp = 817 J/(kg·K), Poisson’s ratio ν = 0.23, and thermal expansion coefficient of 9∙10⁻⁶ K⁻¹.
Heat transfer boundary conditions were defined as incident heat flux lumped on the exposed surface of glass (Figure 14b). In the actual test setup, the incident heat flux was not uniformly distributed due to the finite sizes of the radiant panel and the glass specimen and the distance between them. Thus, the HF at the corners of the specimen was lower than at its centre. The non-uniform heat flux distribution was calculated according to the relevant view factors according to [27]:

where A = W/L and B = W/L are the ratios of the vertical (H) and horizontal (W) offsets of the considered points, respectively, to the distance between the considered planes (L) (i.e., the distance between specimen and panel dp).
The view factors from the radiant panel differ across the surface of the glass panel from 0.38 in the centre to 0.18 in the corner. The respective view factors are shown in Figure 16a for a quarter of the glass pane, (x,y) = (0,0) representing the centre of the exposed surface.
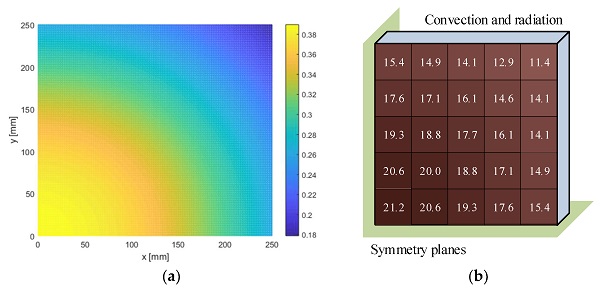
This spatial variation was taken into account by discretizing the incident radiant heat flux into 25 squares. In the finite element model, the HF was applied in “patches” over which an average uniform HF was assumed. It was assumed that the glass is placed 350 mm from the radiant panel and 15% of the heat is reflected from the glass surface. The incident radiant heat flux to the surface applied in the Abaqus model is shown in Figure 16b.
5.2. 3D Modelling Results and Discussion
The stress and temperature evolution in the glass pane was continuously monitored since these two parameters directly impact the possible glass breakage.
As the panel expands due to the temperature field (Figure 17) resulting from the applied (non-homogenous) heat flux, thermal strains develop, and the pane unevenly expands. The panel is free to deform; however, the strains’ in-plane and thickness differences lead to internal restraints and resulting stresses (Figure 18). The highest principal (tensile) stress is located at the centre of the edges, exactly where the crack is initiated in experiments (Figure 5).
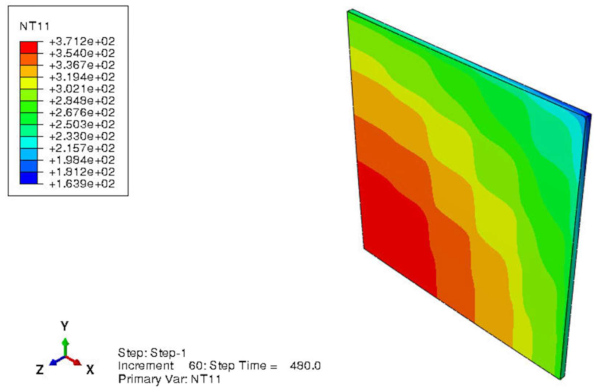
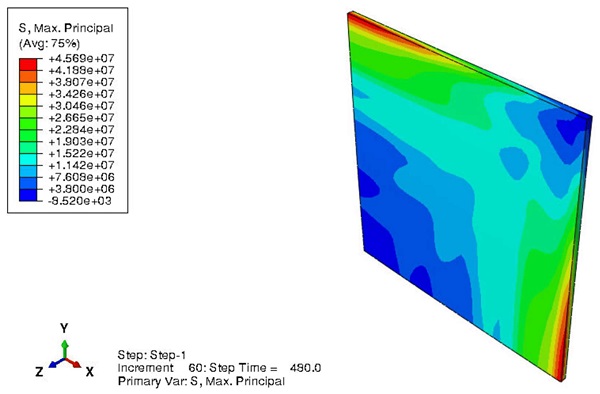
Since the temperature field has a considerable in-plane variation, it causes significant deformations and consequently stresses large enough to crack annealed glass specimens.
5.3. 3D Model vs. Test Results
The results of the numerical simulations and the experiments are shown in Figure 19 (test #3, 12 mm thickness) and Figure 20 (test #7, 6 mm thickness). The numerical and experimental results for exposed and unexposed surfaces at centre, edge, and corner are shown together with the largest temperature difference (experimental and simulated) and the maximum principal stress (lower right panels).
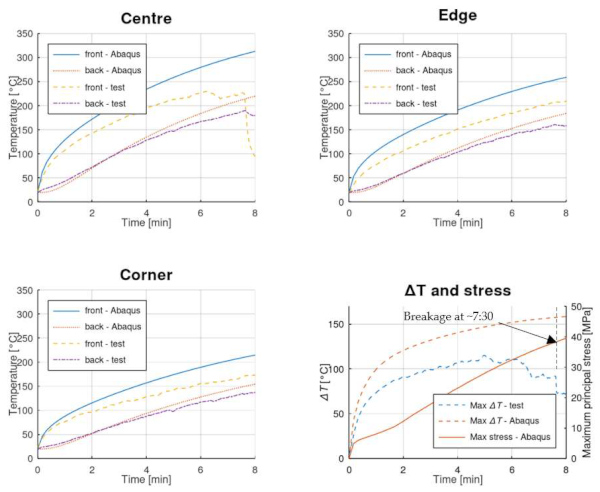
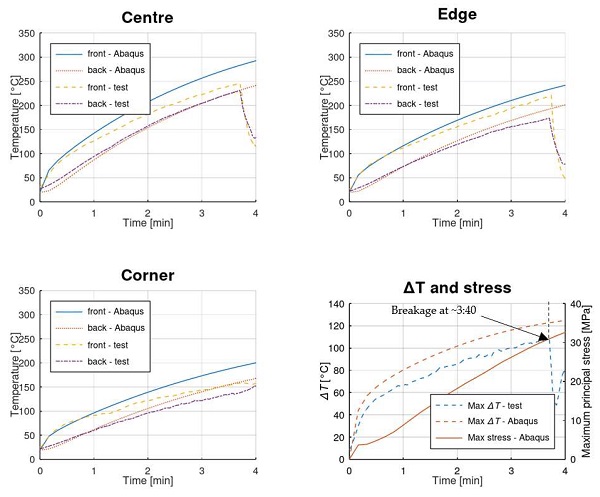
When comparing the temperatures from the numerical models and the tests, it seems that the numerical model overestimates the temperature at the exposed surface, whereas a relatively good fit is seen at the unexposed side of the pane. This may be related to the way the heat flux was applied. In the numerical study, it was lumped to the glass surface, which could explain the overestimation of the surface temperature. It could also be a consequence of the TCs in the experiments extrude 0.5–1 mm and are thus subject to more convective cooling than the actual glass surface, something which is more relevant for the hotter exposed surface. However, several parameters might need to be adjusted to fit the results better, which requires further studies and is beyond the scope of this paper.
The annealed glass panes broke even when all mechanical constraints were removed. The results show that the combination of through-the-thickness and in-plane temperature gradients causes an uneven strain distribution in the glass, high enough to break AN glass. Comparing the max principal stresses at the time of breakage for the annealed samples (#3 and #7), they are around 30 and 38 MPa for the 6 and 12 mm panes, respectively. Thus, the thermal stresses are comparable to the two types of panes and their maxima develops at the middle edge, just where the cracks are initiated.
6. Conclusions
In this paper, a test series focused on the structural-sized glass panes exposed to radiant heating was presented and discussed with the support of structural models. Eleven monolithic glass panes in total, with different thicknesses, were tested and analysed. It was found that the highest stresses develop at the middle edge since the hotter centre creates tensile stresses on the colder perimeter. These stresses were large enough to break AN specimens but not HS and FT glass. Moreover, the effect of the application of low emissivity coating on the results was found negligible.
A simplified one-dimensional (1D) heat transfer model was found suitable to predict the through-the-thickness temperature gradients. However, it is not sufficient for describing potential breakage. It is the colder perimeter and in-plane temperature gradients that induce high tensile stress that are the main cause of the breakage in this setup, even though no mechanical constraints are present.
For many applications (windows or structural glass that is framed, see e.g., ref. [28]), the perimeter will be even colder and, therefore, a dominating feature of crack initiation. This is something that should be considered in detail during the design of glass structures.
The three-dimensional (3D) thermo-mechanical model, which was developed to have a more detailed analysis of heating effects in glass, was found suitable for the investigation of more complex thermal phenomena (i.e., spatial heat transfer conditions within the specimen and various types of heat exchange at the boundaries). More precisely, the use of a thermo-mechanical model is required to calculate the evolution and distribution of strains and stresses in glass, which could be used for predicting its possible breakage. The simulations suggest that the AN glass panes break at 30–38 MPa (depending on their thickness), which is slightly lower than the typical characteristic value for AN glass (45 MPa). This indicates that high temperature might have a negative effect on the failure strength of glass, which is in line with the findings reported in literature.
In addition, the 3D model is necessarily required when restraint details and/or geometrical features and, e.g., effects of shading, must be taken into account. However, in terms of through-the-thickness temperature gradients predictions, the accuracy of the 3D thermo-mechanical model gave evidence of major scatter with experiments compared to the simplified 1D one. This effect could be explained by several uncertainties and influencing parameters that are of primary interest for similar applications, and require more thorough calibration and validation procedures.
Author Contributions
Conceptualization, D.H. and J.S.; methodology, D.H. and J.S.; formal analysis, D.H. and M.K.; resources, D.H. and C.B.; data curation, D.H.; writing—original draft preparation, D.H., C.B. and M.K.; project administration, D.H.; funding acquisition, D.H. All authors have read and agreed to the published version of the manuscript.
Funding
This research was carried out within the “Safe and durable timber-glass building components” project funded by Vinnova (Sweden’s Innovation Agency) via the Smart Housing Småland innovation arena for glass and wood, grant number 2016-04218. The APC was funded by C.B.
Institutional Review Board Statement
Not applicable.
Informed Consent Statement
Not applicable.
Data Availability Statement
Not applicable.
Acknowledgments
The authors acknowledge the technical help provided by the staff at the Fire Test Halls of RISE Research Institutes of Sweden in Borås, namely Fredrik Kahl and Joakim Albrektsson.
Conflicts of Interest
The authors declare no conflict of interest.