Challenging Glass 6
Conference on Architectural and Structural Applications of Glass
Louter, Bos, Belis, Veer, Nijsse (Eds.), Delft University of Technology, May 2018.
Copyright © with the authors. All rights reserved.
ISBN 978-94-6366-044-0, https://doi.org/10.7480/cgc.6.2159
Authors:
Anna Ioannidou-Kati, Manuel Santarsiero, Christian Louter

The connections between glass components are very critical aspects of structural glass design. Laminated steel-to-glass connections have recently been developed that combine high strength and transparency. This work focuses on the Transparent Structural Silicone Adhesive (TSSA), produced by Dow Corning. TSSA is typically used for the realization of circular point connections on the glass surface. An alternative approach of using TSSA is considered in this study, by laminating stainless steel connectors on the edge of the glass. These connections are experimentally and numerically investigated. The edge bonded specimens are tested in shear and the stress distribution of the adhesive is analyzed by means of a three-dimensional finite element model.
The distribution of stresses in the adhesive is non-linear showing significant stress peaks towards the free edges of the adhesive. A parametric study is conducted to relate the magnitude of the shear stress peaks and bending stresses with the eccentricity of the applied load. The occurrence of failure at lower engineering stresses than the ones recorded for circular point connections is explained using the theory of bending-shear interaction laws. Based on these failure criteria, shear stress peaks that occur due to the eccentricity of the applied loadhave an important influence on the global resistance of the connection.
1.Introduction
Transparent Structural Silicone Adhesive (TSSA) is a crystal clear, silicone adhesive that is not significantly affected by temperature variations or UV radiation and exhibits high weather resistance (Sitte 2011). In the work of Santarsiero et al. (2016), TSSA is described as an elastomeric one-component addition cured silicone with no by-products (and no odor), characterized by nanosilica and cross-linked polymers. This transparent adhesive material is developed by Dow Corning, with the primary aim to realize steel-to-glass point fixings. The use of TSSA laminated connections avoids the drilling of glass and allows a more uniform distribution of stresses inside the glass than for instance bolted connections (Overend et al. 2013).
TSSA is produced in foils with a thickness of 1mm that should be stored in a refrigerator at low temperatures to prevent curing of the adhesive (Santarsiero et al. 2016). Dow Corning recommends that TSSA should be processed inside a clean and dust free room where the temperature should range between 15ºC and 25ºC (Dow Corning 2014). The process begins with cleaning and priming carefully the substrates. TSSA must be applied only after the primer has completely dried, which usually takes 5 to 20 minutes. When TSSA has dried completely, the foil is cut into the desired size and applied on the glass surface.
Subsequently, the adhesive is cured at temperatures of 120-140 °C inside an autoclave. Optimum cure conditions are achieved in autoclaves, but alternative production methods such as pre-pressure (prior to heat cure) followed by oven curing or vacuum-bagging (during heat cure) may also result in good quality connections (this depends on the design of the connection and the ability to eliminate air bubbles - Dow Corning Europe, personal communication, May 23, 2017). After the curing of TSSA, the adhesive remains completely transparent exhibiting a refractive index of 1.41, very close to that one of glass (1.51-1.52).
Experimental research on the performance of laminated connections has been performed by Santarsiero et al. (2016, 2017,2018), Hagl et al. (2012) and Sitte et al. (2011). Tensile and shear experiments have been conducted to circular connections with diameter 20 or 50 mm bonded on the surface of annealed glass specimens. The three-dimensional nature of the connections has been investigated via numerical analysis, where a non-linear stress distribution in the adhesive is observed. This causes stresses to deviate significantly from the nominal stress (calculated as force divided by adhesive surface), due to stress peaks occurring in the adhesive (Dispersyn et al. 2014). The peaks usually appear close to the free edges of the adhesive and may be attributed to different reasons depending on the tested configuration.
Santarsiero et al. (2017) attributed the non-linearity observed under tensile tests to the confined state of the adhesive layer, which is caused due to the high D/t ratio (D being the diameter and t the thickness of the adhesive layer), the related stiffness of the adhesive connection and the deformation of the substrates. Numerical analysis on the shear behaviour of the connections also showed that non-linearities depend on the geometry of the connection and the boundary conditions of the test. Santarsiero et al. (2016) conducted a simplified two-dimensional analytical variational approach to interpret the physics of the peaks. Results showed that higher peaks are expected when stiffer adhesives are used or when the size of the connection increases in the direction of shear.
Contrary to the aforementioned studies, the current study focuses on steel-to-glass TSSA adhesive connections on the edge of glass instead of on the face of the glass. This new connection typology is here experimentally and numerically investigated. Firstly, laminated TSSA connections on the glass edge are fabricated and tested in shear, as described in section 2. Then, the deformation behaviour and failure load of the connections is discussed in section 3 and the stress distribution is analyzed by means of a numerical model in section 4. Finally, the performance of the edge-laminated connections and their advantages and weaknesses are discussed in section 5, to facilitate a further development of these edge-laminated connections.
2.Method
2.1.Materials, specimens and fabrication
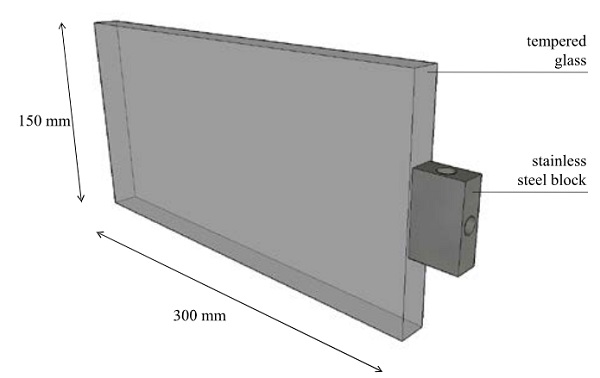
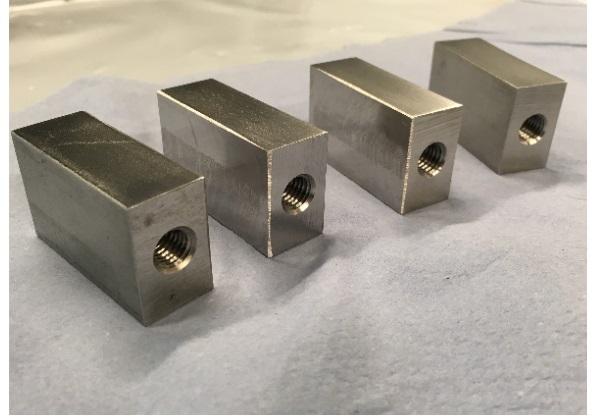
Glass specimens with stainless steel blocks bonded to their edge are fabricated for this research. In total, four specimens are manufactured. The glass plates are made of tempered glass with a size of 300 x 150 mm and thickness 19 mm. The edges of the glass are polished. The stainless steel blocks are size 50 x 30 x 15 mm and are made with two threaded cylindrical holes, one for positioning the Linear Variable Differential Transformers (LVDTs) and one for imposing the shear load to the connection. The block is laminated at mid-height of the glass edge and centered over the glass thickness.
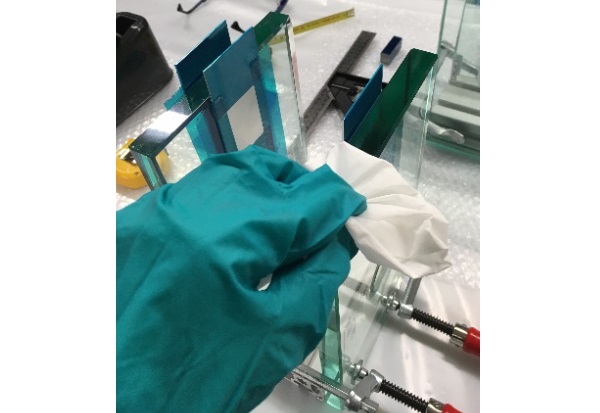
The edge bonded connections were fabricated at the TU Delft Aerospace Structures and Materials Laboratory. The stainless steel blocks were manually sanded using sandpaper prior to lamination. Both the glass and the steel blocks were cleaned following the two-cloth cleaning method recommended by the manufacturer, Dow Corning. The surfaces were wiped with soft cloths saturated in isopropanol and then immediately dried with a separate clean cloth. This process was repeated 3 or 4 times to ensure that dirt and other contaminants were sufficiently removed.
Subsequently, the TSSA foil was taken out of the refrigerator and conditioned at room temperature until no condensation was visible on its surface. TSSA comes indeed with two protective thin foils on both sides to prevent any condensation coming directly in contact with the material. Water must be completely removed prior to cutting the foil into the desired size and removing the protective layers, in order to prevent any problems during lamination (e.g. not sufficient bonding due to air bubbles). During the sample preparation, the TSSA foil was firstly applied to the surface of the stainless steel block.
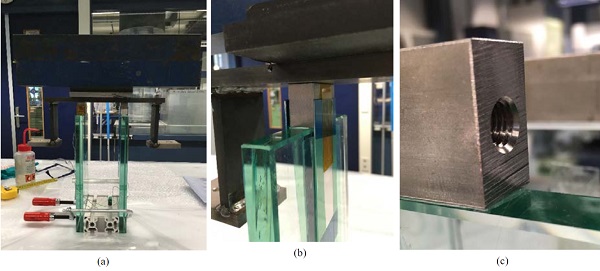
The foil was applied very carefully to ensure that no air bubbles were created on the interface between the adhesive and the steel surface. Subsequently, the steel block was positioned on the surface of the glass edge. Two aluminum plates were taped on two opposite sides of the glass in order to ensure that the steel block remains in place throughout the lamination process, see Fig. 5(b). Two thermocouples were connected with the glass and the steel block close to the adhesive. In this way, the temperature of the materials was monitored throughout the curing process.
Pressure is applied to ensure optimum contact of the material interfaces. Dow Corning recommends a pre-pressure of 0.15 to 1.3 MPa. In this case, a pressure of 0.2 MPa was imposed to each connector, by means of adding weights using steel blocks resting for 15 minutes on top of the connections, see Fig. 5(a). If air bubbles were still visible, then the weights were left for longer period on top of the connections to ensure that the adhesive entered the oven with as few as possible air inclusions. The specimens entered an oven that was preheated at 135oC. This temperature remained stable for 90 minutes. Subsequently, the oven was switched off and the specimens were left there to cool down gradually for 18 hours. It must be noted, that a vacuum bag was not used during the curing of the connections inside the oven.
2.2.Test set-up
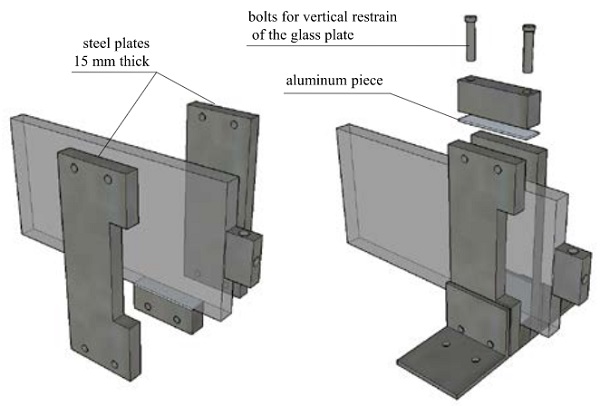
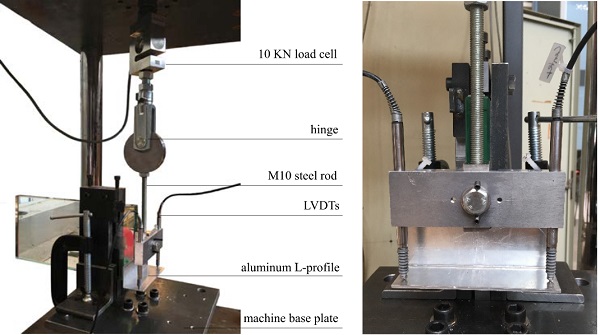
Tests were performed with a SCHENCK testing machine and a 10kN load cell at the Stevin Laboratory at the Faculty of Civil Engineering and Geosciences at TU Delft. A steel set-up is made to restrain the glass plate when the connection is loaded, see Fig. 6. The glass plate is restrained laterally by two steel plates with a thickness of 15 mm. These plates are stabilized and fixed to the machine base by means of two L-profiles (80 x 80 x 8 mm). In the vertical direction, the glass is restrained by two M8 bolts that pressure the glass and prevent uplift or rotation of the glass during the test. At the interfaces between glass and steel, small aluminum plates are positioned to avoid direct contact of glass and steel and to reduce the possibility of brittle failure of the glass during testing.
The shear load is transferred to the center of the connector via an M10 steel rod, see Fig. 7. The eccentricity of the shear load is expected to cause a moment to the connection and should be carefully considered in the analysis of the results. The rod is connected to a metallic hinge, which in turn is connected to the load cell. The hinge ensures that the force applied to the connector is always centered. The machine base plate displaces downwards and brings the steel rod in tension introducing a shear load to the connection.
The relative displacement between the glass and the steel connector is measured by two LVDTs with a stroke of ±5 mm, which are placed on the right and left side of the connector. These are fixed onto an extra aluminum piece which in turn is rigidly connected to the stainless steel block. An aluminum L-profile (with thickness 2mm) is bonded on the surface of the glass edge in order to measure the relative displacement of glass and steel (see Fig. 7). The specimens are loaded in displacement control at a displacement rate of 1mm/min. Data are acquired at a frequency of 10 Hz.
3.Experimental results
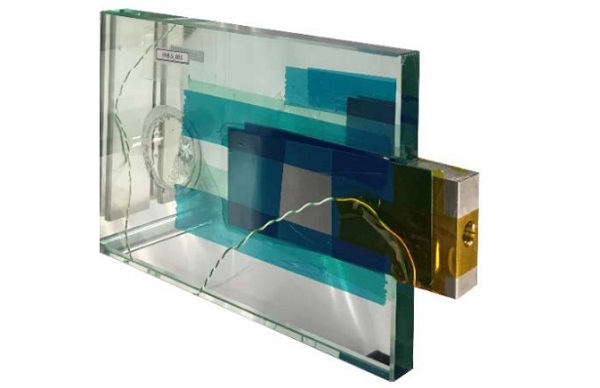
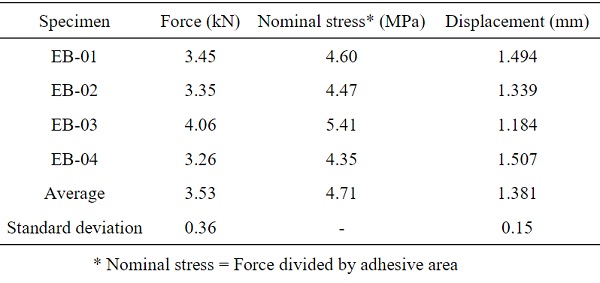
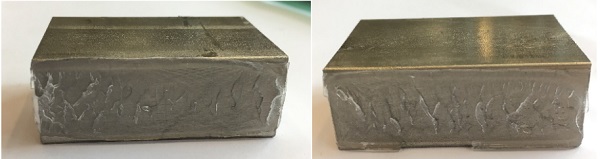
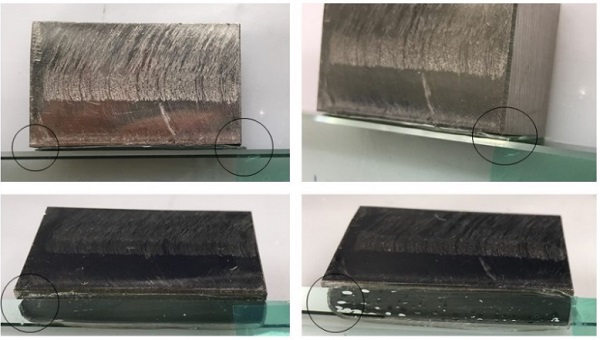
A series of static tests is conducted, in which TSSA edge-laminated steel-to-glass connections are subjected to monotonically increasing shear loads. The mechanical response in shear is given in Fig. 8. The results appear to be consistent, with only one specimen slightly deviating from the rest. The behaviour of the connection shows a linear behaviour up to failure and resembles the results obtained from the shear tests of circular connections performed by Santarsiero (2016), Sitte et al. (2011) and Hagl et al. (2012). The recorded forces, the calculated nominal stress and the recorded displacements at the point of failure are given in Table 1. The average strength of the connection is slightly smaller, in the range of 20%, compared with the recorded strength of tested circular connections. Fig. 9, illustrates the connecting surface of the stainless steel blocks after failure. All specimens failed cohesively within the adhesive.
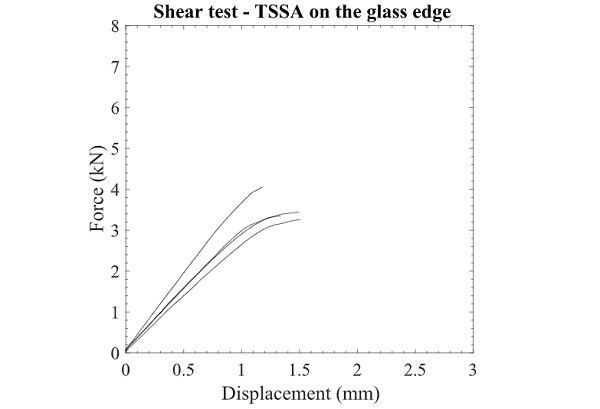
Table 1 Failure test results of TSSA connections on the glass edge
4.Numerical analysis
In this section, the shear behaviour of TSSA laminated connections on the glass edge is analyzed by means of a finite element model. The purpose of the numerical analysis is to compute the nonlinear stress distribution in the connection, taking into account its three-dimensional nature. A three-dimensional finite element model is created with the DIANA FEA software. Fig. 10 shows the geometry of the model, the dimensions and the boundary conditions. The symmetry along the x-axis is taken into account and thus only half of the connection is modeled in DIANA. Linear material properties are assigned to the glass plate and the stainless steel block, see Table 2.
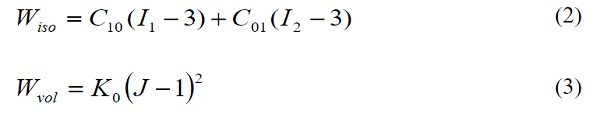
The TSSA layer is modeled with the Mooney-Rivlin hyperelastic law. The strain energy function of the Mooney-Rivlin law may be decoupled into the isochoric and volumetric part.
![]()
Where:
I1, I1the principal invariants of the deformation gradient tensor
J the Jacobian of the deformation gradient tensor (J = det(F))
The isochoric part depends on the constants C10 and C01, and does not account for any volume changes in the adhesive. Volume changes are considered in the volumetric part of the model which depends on the bulk modulus K of the material. This is usually determined by oedometric tests that require inserting a piece of the adhesive, often a circular specimen, inside a rigid matrix to achieve a perfectly confined state by fully restraining lateral expansion. Subsequently, the upper part of the adhesive is compressed with the help of a piston to impose a hydrostatic stress state to the adhesive. During this process, stress and strain data are kept for the determination of the bulk modulus. Alternatively, the initial bulk modulus, Ko, may provide a good approximation.
where:
C10, C01material parameters, related with the isochoric part of the strain energy function
K0the initial bulk modulus, related with the volumetric part of the strain energy function

Table 2 Material properties
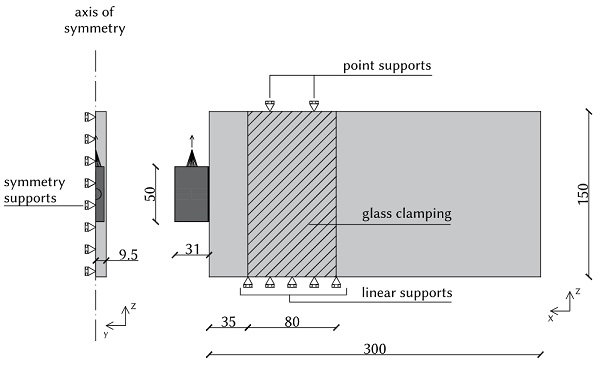
The glass panel is restrained laterally (y-direction) at the position where the steel plates clamp the glass. It is also restrained vertically (z-direction) with a linear support at the bottom and at the top with two point supports at the places were the vertical bolts touch the glass. Symmetry supports in the y-direction are also included in the simulation. The load is applied to a reference point 15 mm above the connection and is redistributed to the stainless steel block via a metallic cone. This is done to simulate the load transfer between the steel rod and the stainless steel thread.
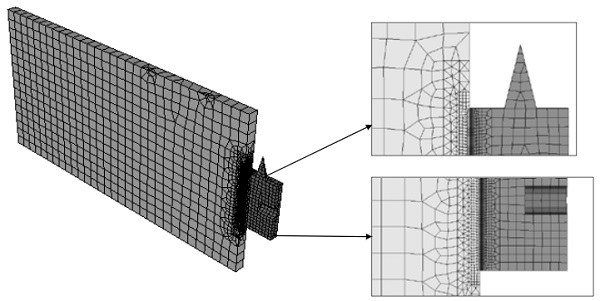
The mesh consists of quadratic elements of multiple sizes. The adhesive is modeled with brick rubber elements of maximum size 0.5 mm. The mesh of the steel connector is refined close to the adhesive, where the elements have a maximum size of 1mm, and becomes coarser towards the edge of the connector with elements of maximum size 3 mm. The mesh of the glass element is also refined close to the adhesive and consists of elements with maximum size 9.5 mm. Nonlinear step-by-step analysis is conducted using the regular Newton-Raphson method.
Physical nonlinear behaviour is considered in the analysis through the hyperelastic material properties of the adhesive. Geometric nonlinear analysis is required to account for the finite deformation theory, which is applicable for rubber-like materials. The finite deformation theory defines that the difference between the deformed and non-deformed configuration is not negligible. Therefore, the stresses are calculated based on the updated deformed geometry of the adhesive at each step.
5.Discussion
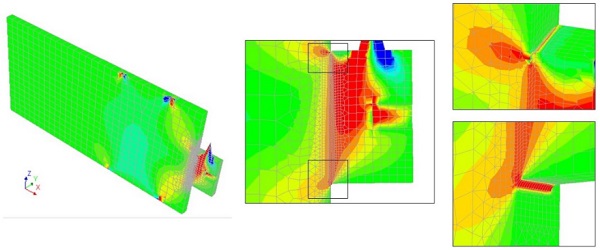
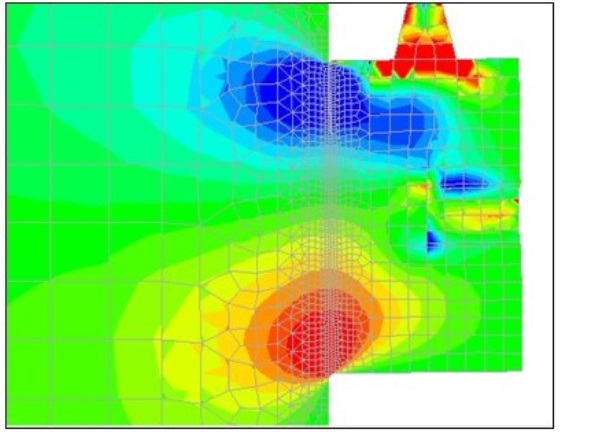
Fig. 12 shows the distribution of shear stresses in edge laminated connections subjected to shear loads. The stress distribution is not uniform along the x and z axes. The non-uniform distribution of stresses along the x-axis has also been observed and analysed in numerical analysis of circular (d=50 mm) connections performed by Santarsiero et al. (2016). This nonlinearity is attributed to the fact that the adhesive has a very small thickness compared to the glass and steel adherents and thus it is unable to fully involve, stress-wise, their whole thickness. Therefore, the stresses in the adherents are localized close to the adhesive. The stresses in the adhesive appear to be uniform towards the middle part of the connection. However, high stress peaks are visible close to the free edge of the connection, especially at the interface of the adhesive with the glass element.
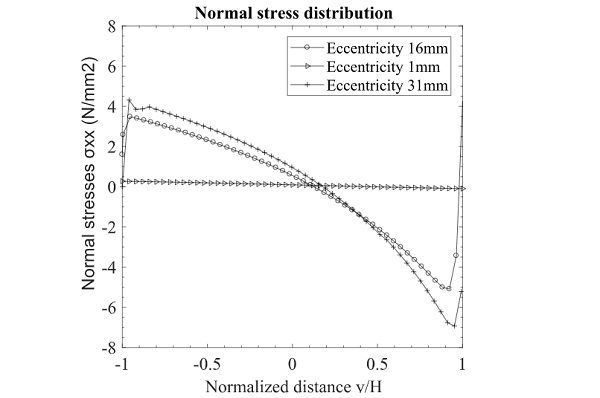
Even though a shear load is applied to the connection, normal tensile and compressive stresses are also occurring. This is because the load is applied with a certain eccentricity from the glass edge which causes a bending moment on the connection and thus stresses normal to the bonding surface. Fig. 13 illustrates the distribution of stresses normal to the surface of the connection (σxx).
To give a better understanding, the shear stress distribution along the height of the adhesive is plotted in Fig. 14. The results are presented in terms of normalized stress versus normalized distance. The normalized stress is the ratio between the actual stress τzy occurring on the interface of the adhesive with the glass and the nominal stress τnom. The actual shear stresses are obtained by the three-dimensional finite element analysis and the nominal stress is calculated based on the applied force F divided by the adhesive area A.
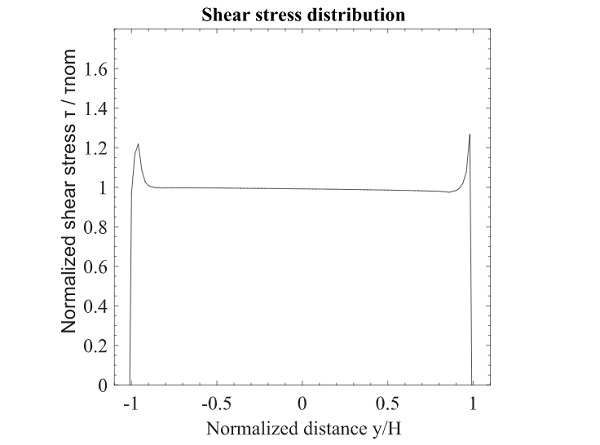
The results show significant stress peaks on the edges of the connection. A parametric study is performed varying the eccentricity of the applied load. More specifically, the results obtained from applying the load in the middle of the connection are compared with the cases of maximum and minimum possible eccentricity, see Fig. 15. The goal is to understand how much the eccentricity of the applied load affects the stress peaks in the adhesive.
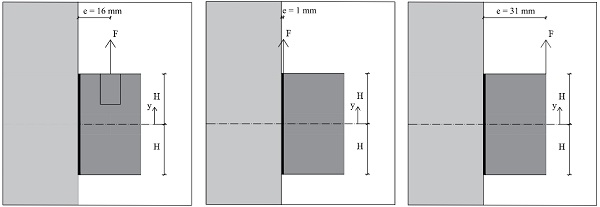
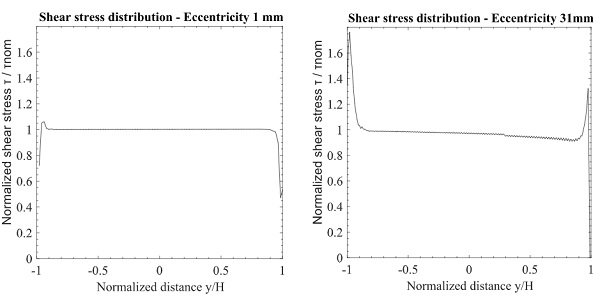
The results of the parametric study are illustrated in Fig. 16. For the case where the load is applied very close to the connection, stress peaks appear to be much less severe than what was observed in the tested configuration. In case the load is applied on the edge of the connector (maximum eccentricity of 31 mm), the stress peaks become very critical. The results confirm that the magnitude of stress peaks depends on the eccentricity of the applied load. This is because stress peaks occur close to the end of the joint and become more severe as the eccentricity of the load increases. In case of high stress peaks, the shear load is mainly transferred with shear stresses concentrated on the edge of the connection (Santarsiero et al. 2016).
The distribution of normal stresses depending on the eccentricity of the load is plotted in Fig. 17. Considering the theoretical case of minimum eccentricity, normal stresses appear to be nearly zero. Numerical results based on the tested eccentricity of 16mm showed that significant tension and compression stresses appear due to the induced bending moment.
The calculated normal stress distribution in the adhesive due to eccentricity might explain the reason edge bonded specimens failed at (20%) lower engineering stresses than the ones recorded for circular connections under shear loading (Santarsiero et al. 2016, Hagl et al. 2012, Sitte et al. 2011). This could be because the presence of tensile stress (and the related hydrostatic component of the stress tensor) reduces the shear resistance of the materials. Eccentric shear tests are usually governed by failure laws that account for mixed ultimate loads (Hagl et al. 2012, Santarsiero et al. 2018), schematically shown below as
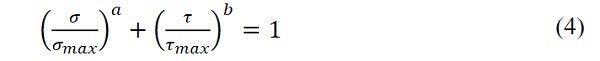
where:
σ and τthe bending and shear stresses, respectively
σmax and τmaxthe maximum bending and shear stresses, respectively
a, b material parameter
Increasing the eccentricity of the applied load, immediately increases bending stresses in the connection. Failure occurs when shear stresses do not decrease accordingly. In this case, high shear stress peaks in combination with maximum bending stresses occurring close to the free edges of the adhesive presumably lead to the specimens’ premature failure.
After the fabrication of the edge bonded specimens, weaknesses were observed at the edges of the adhesive, a second aspect that might have contributed to strength reduction. In that regards, it is recommended that attention should bepayed to the quality of lamination on the edges. Further improvements to increase the strength of the connection include the application of a primer and a heat-curing process inside an autoclave, as recommended by the manufacturer.
6.Conclusion
The first attempt to laminate a stainless steel connector on the glass edge is studied by means of experimental tests and numerical analysis. It can be concluded that most of the shear force is carried by the edges of the adhesive layer and that the efficiency of the connection depends on the eccentricity of the applied load. More specifically, experimental tests showed that the mechanical response of the connection appears to be mainly linear, resembling the experimental results of circular connections.
However, the specimens failed at lower engineering stress levels in relation to the corresponding stresses recorded during tests of circular connections. Numerical analysis in combination with bending-shear interaction laws showed that the high stress peaks appearing close to the free edges of the adhesive are critical for the global resistance of the joint. A parametric study varying the eccentricity of the load showed that the peaks become more severe as the eccentricity of the load is increased.
References
Dispersyn J., Santarsiero M., Belis J., Louter C.:. A preliminary study of the nonlinearity of adhesive point-fixings in structural glass facades. Journal of Facade Design and Engineering. 2, 85–107 (2014)
Hagl A., Dieterich O., Wolf A. T., Sitte S.: Tensile Loading of Silicone Point Supports – Revisited. Challenging Glass 3. (2012)
Overend M., Nhamoinesu S., Watson J.: Structural Performance of Bolted Connections and Adhesively Bonded Joints in Glass Structures. J. Struct. Eng., vol.139, no. 12 (2013)
Santarsiero M., Louter C., and Nussbaumer A.: A novel triaxial failure model for adhesive connections in structural glass applications. Engineering structure. (2018) Under review
Santarsiero M., Louter C., and Nussbaumer A.: Laminated connections under tensile load at different temperatures and strain rates. International Journal of Adhesion and Adhesive. http://dx.doi.org/10.1016/j.ijadhadh. (2017)
Santarsiero M., Louter C., and Nussbaumer A.: Laminated connections for structural glass applications under shear loading at different temperatures and strain rates. Construction and Building Materials. Vol. 128, pp. 214-237. http://dx.doi.org/10.1016/j.conbuildmat.2016.10.045 (2016)
Santarsiero M., Louter C., Nussbaumer A.: The mechanical behaviour of SentryGlas ionomer and TSSA silicon bulk materials at different temperatures and strain rates under uniaxial tensile stress state. Glas. Struct. Eng. http://dx.doi.org/10.1007/s40940-016-0018-1 (2016)
Sitte, S., Brasseur, M.J., Carbary, L.D., Wolf, A.T.: Preliminary Evaluation of the Mechanical Properties and Durability of Transparent Structural Silicone Adhesive (TSSA) for Point Fixing in Glazing. Journal of ASTM International. Vol. 8, No. 10, pp. 1-27 (2011)