First presented at GPD 2017
Machine learning, a type of artificial intelligence, is becoming increasingly prevalent in everyday life. Email spam filters, autonomous cars, and speech recognition all rely on machine learning algorithms to function accurately and efficiently. Such algorithms allow computers to find trends in data without explicit programming or problem awareness, allowing them to make predictions when exposed to new inputs. This paper explores the potential of this technology to assist in the field of structural glass design.
Supervised regression multilayer neural networks and classification algorithms are trained on a database of computational structural glass solutions generated parametrically in Grasshopper and Strand7. Once trained, the algorithm’s accuracy is assessed and used to predict glass build-ups for a rectangular plate with uniform pressure.
Thickness classification accuracies of greater than 80% are achieved in all cases. When used in combination with experienced structural engineers, such intelligent predictors have the potential to offer benefits in early stage design, allowing rapid and accurate assessment of glass and consideration of the wide variety of design drivers involved in structural glass design.
Introduction
As with other technical fields, fundamental engineering problems can be formulated and automated based on their mathematical principles. The principles of computer aided design (CAD) have long being outdated and we have progressed into the domain of computer “generated” design. As designers and engineers we are increasingly more reliant on computational power not only to solve technical problems but to generate the designs in the first place. Architects and designers resort to computational design as a means of exploring a multitude of solutions which are sub-optimal with increasingly wider range of parameters, including solar, thermal, structural, views and aesthetics.
Currently, despite the computer advances, expertise in design and engineering has been provided by individual human input. As a result most problems are solved through the prism of personal experience and judgment. In this human experience, learning is critical. While this works well on an individual basis, the power of the collective experience cannot be mobilised due to the knowledge having to be passed on. With this emphasis on the quality of learning, we flag the importance of learning as a principle in digital design. Furthermore, the principle of computer learning can be applied to any task for which basic parameter data can be gathered and stored in a logical way.
Machine learning is the definition of a series of algorithms originating in computer science and mathematics, specifically in the subset of artificial intelligence. For the purposes of applied engineering it can be described as self-teaching algorithms that are trained on a set of data gathered in the course of a process. The algorithms make future predictions by extrapolating from past-experience.
For welldefined, trivial engineering problems there may be little benefit in their application, but the algorithms have unparalleled potential to solve very complex problems. As our problems become more reliant on numerical analysis and integration of disciplines, the separation of individual aspects of a problem will become more difficult.
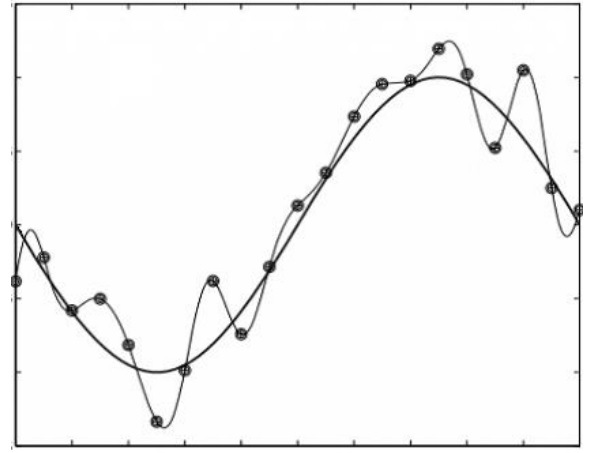
As we evolve further to solve those complex problems entirely in the digital domain we will need to classify, record and discretise as much of the input and output information as possible. Machine learning uses this information, stored in large organised databases to create predictive mathematical models based on the analysis of this data. In Figure 1 the data for a two dimensional problem can be analysed and a function can be fitted to represent the data based on a set of criteria.
Applied Machine Learning in Other Industries
Two transferable examples are highlighted below illustrating how applying machine learning could offer value to companies and clients throughout the design chain of the glass industry.
i. Google DeepMind: Minimising data centre cooling loads
By harvesting data collected from thousands of sensors within their data centres, Google DeepMind trained neural networks to predict energy use, future temperatures and future pressures in their data centres. When run on live data centres, this machine learning system was able to consistently demonstrate a 40% reduction in the energy used for cooling [1].
ii. Otto: Predictive inventory management
Otto, a German based e-commerce company, have trained a deep learning algorithm to predict what customers will purchase a before they order. By analysing 3 billion past transactions and over 200 variables, the algorithm is able to predict with 90% accuracy what will be sold in the next 30 days. It purchases around 200,000 items automatically each month with no human intervention. As a result, Otto’s surplus stock has reduced by one fifth, customers get their products sooner, and product returns have reduced by over 2 million items per year [2].
Methodology
Problem Outline
While machine learning is successfully used to solve complex optimisation problems, its use in the field of structural and façade engineering is not yet explored. The work presented here aims to prove the suitability of this technique in the field of structural glass. A common design task in structural glass is to find the minimum thickness of a four-side supported rectangular plate for given stress and deflection limits.
This problem is well understood, with analytical solutions documented in Rourk [3]. As such, it provides a well bounded, restricted domain, comparative example to illustrate and validate the suitability of machine learning methods for this particular design situation. The complexity of the problem can be generalised to include more parameters and constraints in the future.
The problem outline is: “Predict thickness for a given width, height, pressure and glass type.”
Data Harvesting
Machine learning requires vast amounts of data to train any predictive algorithms to a high degree of accuracy. Here lies a challenge for applying the technology for structural design; in many structural engineering firms the data from past projects is in multiple formats (eg: hand calculations, Excel spreadsheets, finite element models etc), saved in a myriad of different locations, and with no clear demarcation of which solutions were deemed successful and approved for the final design.
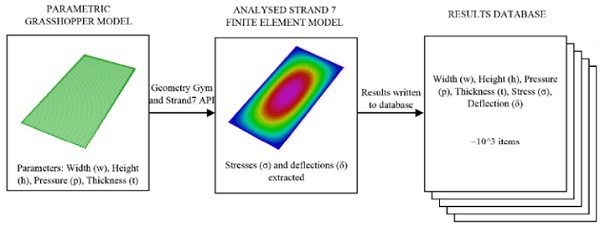
As such, curating an organisation’s past project information into a format suitable to train machine learning algorithms on was deemed beyond the scope of this paper. Instead, an alternative approach to generate new datasets was adopted using parametric design methods. A model of the problem was setup parametrically in Grasshopper, allowing variation of plate width, height, thickness and applied pressure. This was converted into a model suitable for finite element analysis using Geometry Gym [4]. With the Strand7 Application Programmable Interface (API) scripted in Python, the finite element model could be solved in Strand7 Finite Element software.
Finally, the peak stresses and deflections were extracted automatically and saved in a database along with their corresponding input parameters. With this fluid parametric design setup, a database of 1080 models was generated, each corresponding to the inputs and results extracted from a uniquely generated finite element model. The workflow is illustrated in Figure 2, with input data in Table 1.
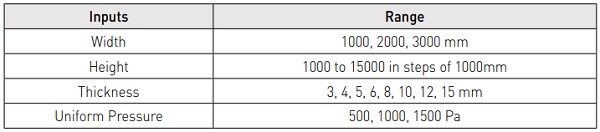
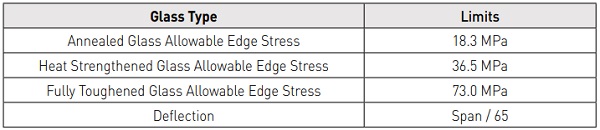
Application of Codified Design Limits In order for the learning algorithm to generate code-compliant designs, limits from design codes need to be applied. The ASTM E1300- 12a allowable edge stresses for seamed edges for 3 second load durations were chosen and summarised in Table 2.
These limits can be adjusted depending on the code chosen, and applied at two distinct locations in the machine learning process; before, or after the training of the algorithm. The locations of where these limits are applied lend themselves to two distinct groups of machine learning algorithms.
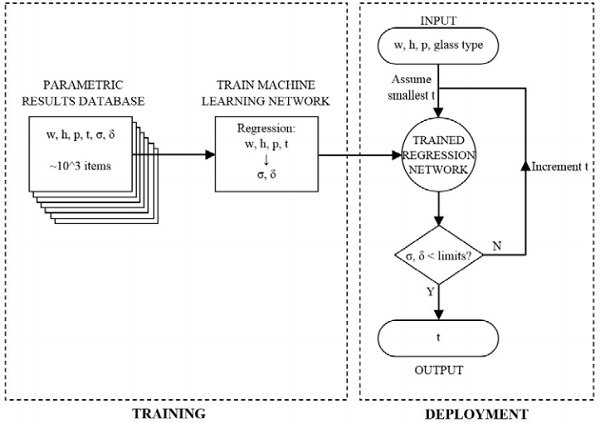
Method 1: Regressive Machine Learning Algorithm
In the first method, a regressive learning algorithm can be trained on the database, mapping the inputs (width, height, thickness and pressure) to outputs (stress and deflection). With regression algorithms, the inputs map to a continuous set of outputs. Once trained, the predictor is used to generate a value of stress and deflection for a given input set. Codified limits are then applied to this prediction, iterating through thicknesses until a viable optimum is found. The flow of this logic is illustrated in Figure 3.
The machine learning was conducted using Matlab r2017a’s ‘Neural Network Toolbox’ [5]. A two layer multi-neuron feed-forward neural network with sigmoid hidden neurons and a linear output neuron was trained on the parametrically generated database. The database was segmented into 50% training data, 25% validation data and 25% testing data. The training data is used to train the network weights using Bayesian Regularisation Backpropogation incorporated into a Levenberg-Marquardt optimisation. The validation set provides a measure of generalisation, and the testing set an independent measure of network performance.
The effect of varying the network hyperparameters, in particular the number of hidden neurons was explored.
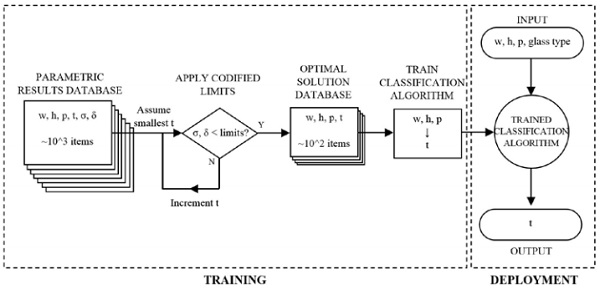
Method 2: Classification Machine Learning Algorithm
The second approach uses a supervised classification algorithm to map inputs directly to thicknesses. To achieve this, the codified limits are applied on the initial database (Figure 4); finding the minimum thickness for a given width, height and pressure that satisfies the deflection and stress limits. These minimum thicknesses are then stored in a new database. As the values of glass thickness fall into distinct categories (3, 4, 5, 6, 8mm etc), a classification machine learning algorithm can be trained to predict which label to ‘tag’ the input data with, corresponding to a particular glass thickness.
The advantages of this method are that no iterative loops are required when the predictor is called, increasing speed of prediction. Additionally, the predictor here has no awareness of stresses or deflections; it simply is able to identify trends in the input data based on past experience to classify the query with an appropriate thickness.
The machine learning was conducted using Matlab r2017a’s ‘Neural Network Toolbox.’ A variety of classification algorithms were trained, including Support Vector Machines, Logistic Regression and Discriminant Analyses. It was found that weighted k-nearest neighbour and Ensemble Boosted Trees performed best on this dataset, with 5 fold cross-validation. These were therefore used for the rest of the investigation.
Results and Discussion
Regression Algorithm Solutions
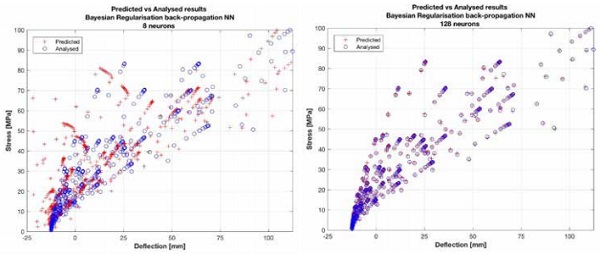
The performance of the trained and validated neural network is illustrated in Figures 5 and 6, using all of the datapoints for illustrative purposes. The effect of increasing the number of hidden neurons from 8 to 128 neurons provides significant performance gains, moving the initially scattered predictions crosses to within the circle of the analytical solution. This suggests 8 neurons provided too few hyperparameters to capture the fourto two-dimensional mapping of the dataset, underfitting the data.
A comparison of the error histogram (Figures 7 and 8) for the two sets illustrates the reduction in error margin that a larger network provides; reducing the deviation of the approximately normally distributed errors. It should be noted that the error is approximately symmetric about its mean, showing the solution is equally likely to be above (conservative design) as below (unsafe design).
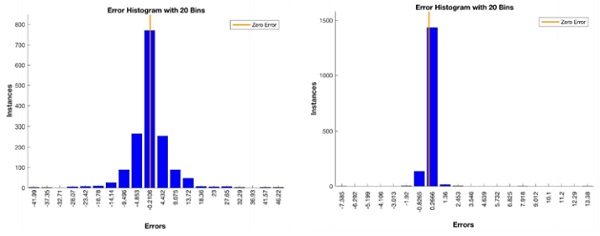
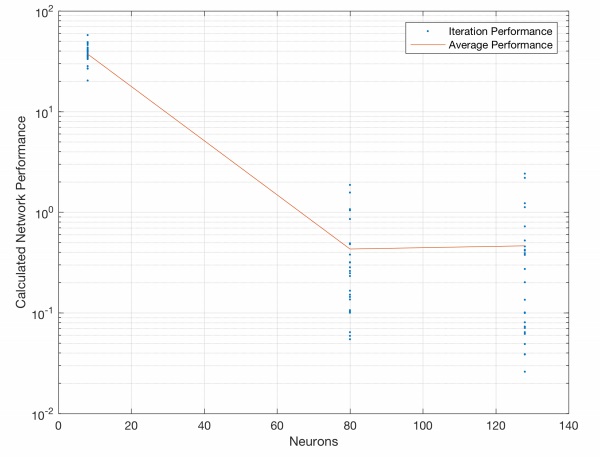
Figure 9 illustrates the improvement in network performance with more hyperparameters. 25 distinct networks were trained with 8, 80 and 128 neuron hidden layers, and their average performance taken. The underfitted 8 neuron network performs worse, but an 80 neuron network has a similar average performance and reduced deviation in comparison to a 128 neuron network. This is due to the increased complexity of the 128 neuron network overfitting the data, resulting in an increased generalisation error when exposed to new test data.
Classification Algorithm Solutions The results from the classification algorithm are shown in Figures 10 to 12 for annealed, heat strengthened and fully toughened glass. The predicted thickness (x axis) is compared against the analytically derived optimum thickness (y axis) meaning a perfect prediction would fall on the “y = -x” diagonal. The algorithms correctly identify the analytical solution in over 80% of the cases.
As in the regression algorithm, the error tends to be distributed either side of the diagonal, demonstrating the susceptibility to conservative and unconservative solutions. As the training data was a subset of the parametrically generated database, each algorithm only had approximately 100 data points to train a three- to one-dimensional mapping. It is anticipated that with larger datasets, more accurate predictions could be achieved.
Example Predictions
To demonstrate the efficacy of the predictors in a more tangible manner to a glass designer, 5 random problems were generated. The glass thicknesses predicted by the regression and classification algorithms are compared to the analytical solution in Table 3. For added complexity, Example 4 includes an inverted aspect ratio where width is greater than height and Example 5 includes a wind pressure outside of the range of training data.

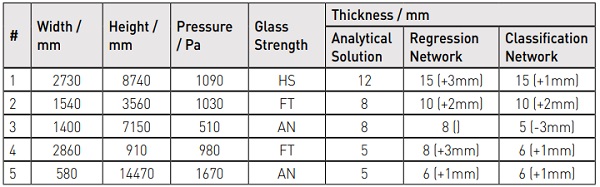
As these 5 examples indicate, both networks perform favourably against the analytical solution. In all but one case, the networks predict exact or conservative solutions. It is anticipated that more training data, particularly for the classification network, will help improve the accuracy of predictions.
Conclusions and Future Work
This paper demonstrates the feasibility of training machine learning algorithms on structural data and their potential application as a predictive tool in early stage design work. Trained regression and classification networks on datasets of 10^3 and 10^2 entries respectively demonstrate accuracies of greater than 80% in comparison to the exact analytical solutions.
Fine-tuning of the network hyper-parameters can adjust the accuracy of the results, with under- and overfitting data resulting in increased generalisation errors.
To train accurate machine learning algorithms, large datasets are required to reduce the error below an acceptable level, which may extend beyond the data harvesting capability of most engineering practices. As such, the method applied in this paper of parametrically generated result databases may have wider applicability. A rule of thumb of ‘one order of magnitude of data for every input parameter’ is likely to provide sufficient accuracy.
Future work includes extending the algorithms to consider multiple load cases, (such as point and line loads which do not have direct analytical solutions) and developing algorithms for double and triple glazed units with climatic loading and laminated panes. The ability to incorporate ‘soft’ design parameters (such as visual quality or post breakage safety) as well as hard (adhering to codified design limits) allow machine learning algorithms to assist in design decision making, and allow the algorithms to provide more wide ranging considerations than a purely analytical solution would offer.
References
[1] Evans, R. and Gao, J. (July 2016) DeepMind AI Reduces Google Data Centre Cooling Bill by 40% [online] Available at: https://deepmind.com/blog/deepmind-ai-reduces-google-data-centre-coolingbill-40 [Accessed 3 May 2017]
[2] The Economist (April 2017) How Germany’s Otto uses artificial intelligence [online & print] Available at: http://www.economist.com/news/business/21720675-firm-using-algorithm-designedcern-laboratory-how-germanys-otto-uses [Accessed 3 May 2017]
[3] Young, W. and Budynas, R. (2011) Roark’s Formulas for Stress and Strain 8th Ed. McGraw Hill Companies
[4] Mirtschin, J. (2017) GeometryGym [online] Available at: https://geometrygym.wordpress.com/ [Accessed 3 May 2017]
[5] Matlab (2017) Neural Network Toolbox [online] Available at: https://uk.mathworks.com/products/neural-network.html [Accessed 3 May 2017]