Authors: M. Drass, P. A. Du Bois, J. Schneider & S. Kolling
Source: Glass Structures & Engineering
DOI: https://doi.org/10.1007/s40940-019-00115-4
Abstract
This study investigates the structural behavior of adhesive bonds of glass and metal using thin, structural silicones in heavily constrained applications. This special type of connection may lead to triaxial stress conditions under axial loading, which can lead to dilatation failure due to the abrupt growth of cavities (cavitation effect). Cavitation failure leads to significant stress softening and loss of stiffness; however, it increases connection’s ductility. These material deformations should be considered when designing glass-metal connections. Therefore, a constitutive model is developed to account for cavitation in hyperelastic materials. The volumetric component of the model is equipped with a non-linear Helmholtz free energy function that accounts for isotropic void growth under hydrostatic loading.
An energy coupling term is then added that numerically explicates strain energy under isochoric deformation, while also guaranteeing physical material behavior. The energy contribution is calculated internally by analysing the geometric evolution of inherent voids. The extended volumetric–isochoric split enables one to numerically calculate heavily constrained silicone joints under arbitrary deformation modes. Three-dimensional finite element calculations on uniaxial tension, bulge, and pancake tests validate the constitutive model. All experiments could be validated with one set of material parameters through numerical simulations. The numerical calculations were robust and efficient without any underlying mesh dependencies.
1 Introduction
1.1 Motivation and problem statement
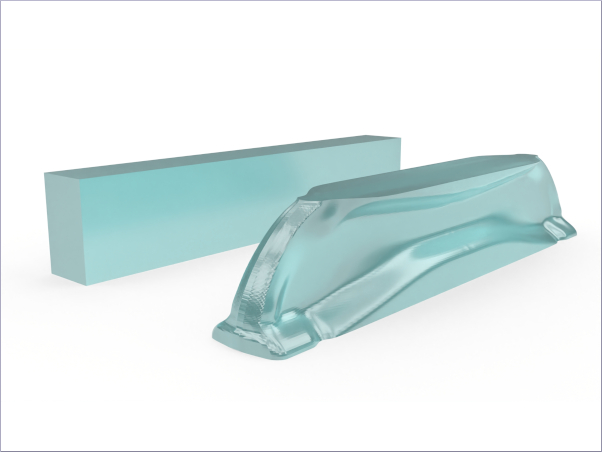
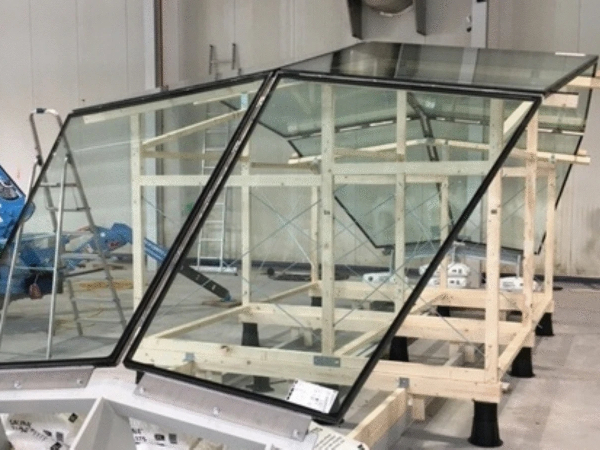
When constructing conventional glass façades, a critical design element is the connection between the glass pane and the supporting secondary load bearing members. To avoid stress peaks in the glass, the joint must be ductile and be able to withstand environmental influences (wind, rain, sun, etc.), while also being architecturally appealing. In modern construction, one typical example of a ductile connection is achieved by directly bonding glass to metal with thin silicone adhesives (see Fig. 1). This is also known as a laminated connection due to a special production process (Bedon and Santarsiero 2018). When an adhesive joint is subjected to an axial load, the disability of lateral strains may cause abrupt cavity growth in the silicone. This behavior is known as cavitation (Drass et al. 2017) and under its effects the connection experiences significant increases in ductility before final dilation failure occurs (see Fig. 2).

At present, such thin adhesive joints may not be employed or studied because they do not meet the geometric requirements of the Guideline for European Technical Approval (ETAG 002 2012). The adhesive joint height to width ratio must be in the range of 0.33<H/B<1 to prevent cavitation failure. In contrast to thick silicone adhesive joints—which are typically used in façade constructions—thin adhesive joints offer clear advantages in terms of design, rigidity, structural diversity and architectural aesthetics. So far there are no simple numerical models to describe the material behavior of thin silicone adhesives in façade applications, so analytical models were developed in order to realistically depict the structural behavior (Descamps et al. 2017). Ongoing research in the field of structural silicones and MS polymers lies in creating physically accurate, constitutive models of structural behavior (Dispersyn et al. 2017; Drass et al. 2018d) and limit state analyses of such connections (Staudt et al. 2018; Rosendahl et al. 2018; Santarsiero et al. 2018).
The attempt to approximate the special structural behavior with classical compressible hyperelastic material models using the volumetric–isochoric split in accordance to Flory (1961) leads to non-physical effects (Ehlers and Eipper 1998; Li et al. 2007). This fact was proved by the work of Danielsson et al. (2004) and Drass et al. (2017), who analysed multi-voided representative volume elements (RVE) under hydrostatic tension loading. A key component is that the structural behavior exhibits a high initial stiffness followed by strong stress softening caused by excessive void growth. Except the constitutive models proposed by Danielsson et al. (2004), Li et al. (2007) and Drass et al. (2017), none of the classical volumetric Helmholtz free energy functions (Hartmann and Neff 2003) are able to represent this physical phenomenon (see “Appendix B”). Hence, conventional compressible hyperelastic material models are not suitable to represent volumetric stress softening effects caused by void growth. Even the Gurson model, which accounts for void growth in metals, cannot be applied to polymeric adhesive connections (Silvestru et al. 2018).
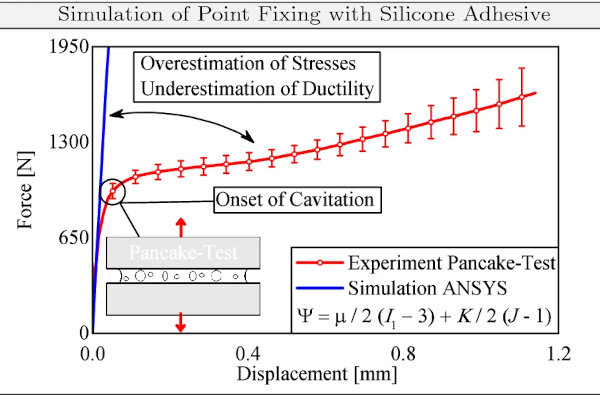
Focusing on point fixing connections in modern façades, classical finite element models accompanied with a compressible hyperelastic material formulation lead to an overestimation of stresses, thus, underestimating the ductility of this special type of connection. This fact is illustrated in Fig. 2, which presents the experimental and numerical results of an axially loaded point fixing. From Fig. 2, it is obvious that the apparent stress softening effects due to cavitation cannot be simulated utilizing conventional hyperelastic material models. Considering these drawbacks, the design process for thin adhesive glass to metal connections in façades design issues a challenge for structural and façade engineers.
1.2 State of the art
Considerable effort has been put forth analysing experimentally thin, structural silicone adhesives as a bonding material for point fixed connections (Hagl et al. 2012a, b; Drass et al. 2018b). Analytical prediction models based on extensive experimental investigations were proposed by Santarsiero et al. (2016) to describe the tensile resistance. Regarding the numerical modelling of such connections, especially the stress softening under constrained axial loading, only Drass et al. (2017, 2018b) proposed a nonlinear volumetric Helmholtz free energy function and a continuum damage formulation accounting for the degradation of the bulk modulus due to void growth. A modified version of the model of Ogden and Roxburgh (1999) was utilized to calculate isochoric softening due to the Mullins effect (Ioannidou-Kati et al. 2018). Yet still, the proposed models lack either a robust and efficient numerical calculation providing mesh-independent results or are not able to account for stress softening due to cavitation.
Pioneering experimental work focusing on the cavitation effect in rubber-like materials was presented by Busse (1938), Yerzley (1939) and Gent and Lindley (1959). To obtain an overview of ongoing studies on the cavitation phenomenon in an analytical and numerical framework, the authors refer to Fond (2001). Dal et al. (2018) categorized the constitutive description of hyperelastic materials accounting for cavitation into three essential thematic categories. The first subsection splits the Helmholtz free energy function Ψ into an isochoric part Ψiso and a volumetric part Ψvol. Regarding volumetric Helmholtz free energy functions, there exist only a few proposals in literature to describe volumetric deformations under a physical viewpoint (Bischoff et al. 2001; Danielsson et al. 2004; Drass et al. 2018b).
The main focus in the development of the volumetric Helmholtz free energy functions was on an incompressible and nearly incompressible material behaviour, which ensures the element’s stability even under small isochoric stiffness (Bonet and Wood 2008, p. 171). The penalty function method describes a procedure where the strain energy potential is calculated as a sum of an incompressible material plus a penalty term enforcing the incompressibility constraint reading J=1 (Simo and Taylor 1982). Following (Belytschko et al. 2013, p. 253), the penalty parameter K should be chosen large enough to enforce the incompressibility constraint, but not so large that numerical ill-conditioning occurs. An overview on the volumetric Helmholtz free energy function is given in Hartmann and Neff (2003).
Since the present paper utilizes the volumetric–isochoric split to analyse cavitation, the second and third categories in accordance to Dal et al. (2018) are only briefly summarized. The second category analytically analyses the evolution of a single void as it reaches critical stresses in an undamaged medium. Additionally, the kinematics of a macroscopic continuum with an inherent void used as a representative volume element were examined by Ball (1982) and Hou and Abeyaratne (1992). The third category makes use of homogenization schemes accounting for an incompressible medium with a given void fraction. Danielsson et al. (2004) captured the idea of Hou and Abeyaratne (1992) to determine a homogenized Helmholtz free energy function for poro-hyperelastic materials. Li et al. (2007) developed a compressible hyperelastic material law accounting for cavitation and cavity growth using a Voigt-type homogenization.
1.3 Scope and outline
The present study utilizes the Flory-type volumetric–isochoric split (Flory 1961) to develop a constitutive modelling approach accounting for stress softening in structural silicones under triaxial loading. Stress softening due to the Mullin’s effect under isochoric deformation modes is excluded in this paper, but part of the investigations of Drass et al. (2019a). Section 2 provides a short overview on the pseudo-elasticity approach, which is used to account for modelling cavitation. In Sect. 3, the novel pseudo-elastic cavitation model is presented with a detailed derivation of the approach, including single-element tests as benchmark tests and the algorithmic setting. The new model provides an extension of the classical volumetric–isochoric split by adding a coupling term Ψvol,couple.
With this approach, cavitation and the corresponding stress softening effect due to void growth in silicone adhesives can be analysed numerically for heavily constrained axially loaded connections. To validate the present constitutive model, Sect. 4 discusses three experiments from literature that are simulated with the novel constitutive model. Here, three-dimensional finite element calculations are performed simulating a simple uniaxial tension test (Santarsiero et al. 2016), a biaxial tension test in terms of a bulge test (Drass et al. 2018c), and a nearly triaxial tension test (which can be accomplished by testing the so-called pancake test) (Hagl et al. 2012a, b). In addition, pancake tests with two different diameters are simulated to prove the accuracy of the model.
2 General concept of pseudo-elasticity
In the investigations of Fung (1980) on living tissues, it was found that the loading and unloading paths under cyclic loading differ significantly. Each can be described separately by a unique relationship between stresses and strains. Since both load paths were represented independently by two single classical hyperelastic material models or with different material parameters for one hyperelastic material model, but the unloading path is strictly speaking inelastic, this phenomenological concept was termed pseudo-elasticity. Lazopoulos and Ogden (1998) proposed the general concept of pseudo-elasticity by introducing a Helmholtz free energy function Ψ(F,η) that is dependent on the deformation gradient F and additionally on an internal scalar variable η. The extension of Ψ by a continuous or discontinuous internal variable η additionally motivates the designation of this theory as pseudo-elasticity.
For the extended functional Ψ(F,η), the first Piola–Kirchhoff stress tensor P can be calculated through
![]()
assuming an elastic body, which is mapped from the reference to the current configuration by the deformation gradient F. Since the internal variable depends additionally on F, the functional must be differentiated according to η, whereby η must be subsequently differentiated with respect to F. In the absence of body forces the first and at the same time also usual equilibrium equation in the Lagrangian description reads
![]()
where ∇X→⋅(∙) represents the divergence operator with respect to the reference configuration. Lazopoulos and Ogden (1998) formulated an additional equilibrium condition derived from a variational principle (stationary energy principle), which reads
![]()
This equilibrium equation implicitly relates the internal variable η to F and thus continuously modifies the strain energy density function with progressing deformation. Based on these basic equations, Ogden and Roxburgh (1999) defined a pseudo-elastic energy function of type
![]()
where ϕ(η) describes a damage function to describe the Mullin’s effect. The inclusion of η and ϕ(η) offers the possibility to change the form of the energy function during deformation.
According to Dorfmann and Ogden (2003), the damage parameter was assumed to be inactive during loading conditions and active for unloading with η∈[0,1]. The internal variable was explicitly derived by inserting Eq. (4) in Eq. (3), which reads
![]()
Since the damage function ϕ(η) is intended to determine η depending on the state of deformation, ϕ(η) can be chosen arbitrarily. However, Eq. (3) must be fulfilled.
3 Pseudo-elastic cavitation model
A pseudo-elastic Helmholtz free energy function is derived in the following, which takes into account the effective stress softening caused by cavitation in rubber-like materials (Gent and Lindley 1959; Drass et al. 2018a). In contrast to the approach of Ogden and Roxburgh (1999), in which the theory of pseudo-elasticity was used to calculate Mullin’s damage in filled rubbers, here the contribution of the strain energy due to the anisotropic geometrical evolution of inherent cavities in the bulk material for any deformation is determined. The pseudo-elasticity approach in accordance to Ogden and Roxburgh (1999) was deliberately chosen to avoid multi-scale modelling (Dal et al. 2018), homogenization methods (Lopez-Pamies and Castañeda 2007) or even the FE² method (Feyel 2003) for reasons of simplicity and time saving due to the above-mentioned numerically complex calculation methods.
The advantages are that the hyperelastic Helmholtz free energy function can be explicitly described at the macro-scale, the Flory-type volumetric–isochoric split can be used, which is ideal for the separate determination of material parameters, damage and healing effects can be modelled without great effort and the renouncement of time-consuming multi-scale modelling methods. Especially the description of damage and healing effects under cyclic loading can be described very clearly by this type of formulation. A detailed description on the extension of this approach towards cyclic loading is presented in part II of this paper.
3.1 General concept
To define a macroscopic Helmholtz free energy function that calculates the volumetric Helmholtz free energy of a porous rubber-like material under any deformation phenomenologically, the pseudo-elasticity approach according to Lazopoulos and Ogden (1998) is used. In principle, we assume a Flory-type hyperelastic material law with the special feature that the volumetric part of the functional is able to describe isotropic void growth. Drass et al. (2018b) presented a nonlinear volumetric Helmholtz free energy function (see Eq. (43)), which is capable of representing the cavitation effect and thus effective stress softening due to growing voids caused by triaxial loading (see “Appendix A”). Hence, the strain energy density function reads
![]()
The advantages of this formulation lie in the application of the Flory-type volumetric–isochoric split, the possibility of representing stress softening due to cavitation and the adaptability of the volumetric formulation. The disadvantage are described in “Appendix B” for reasons of clarity. However, in summary the main disadvantage lies in the fact that under isochoric loads anomalies can be observed in the structural response that only arise from the application of the Flory-type split of the Helmholtz free energy function. Therefore, the pseudo-elastic formulation is chosen in order to avoid the disadvantage mentioned above.
Nonetheless, to take the benefits of the Flory-type hyperelastic material and the nonlinear volumetric Helmholtz free energy function Ψvol,ND, which is also capable of representing stress softening due to cavitation, an additional strain energy couple term Ψcouple is added. This couple term expresses the amount of the strain energy due to anisotropic geometric evolution of a void in relation to the dissipated energy due to isotropic void growth. Keeping this in mind, the modified Helmholtz free energy function reads
![]()
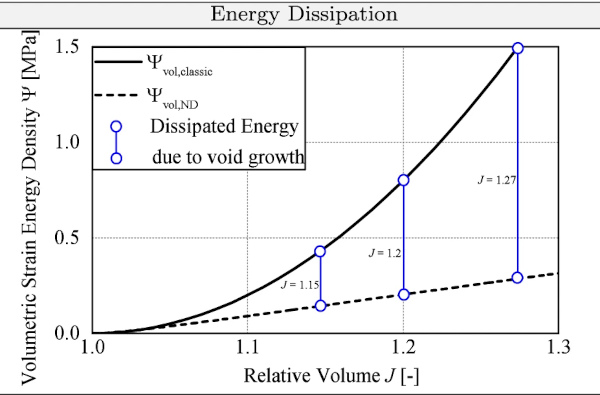
To be more specific, the strain energy coupling term is defined by a shape function Ω∈[0,1] based on the geometrical evolution of a deforming void. The variable Ω has therefore two main objectives. On the one hand, it governs the amount of dissipated strain energy Dcav due to void growth, and on the other hand, it basically decides whether there is a volumetric or isochoric deformation. In the case of a purely volumetric deformation, Ψvol,ND alone is able to calculate the strain energy as a result of void growth, so that the additional dissipated strain energy Dcav due to cavitation must become zero. Consequently, Ω must be zero for a volumetric load. Looking at isochoric deformations, Ω must assume values of >0 to compensate for the loss strain energy caused by pore growth, as no significant pore growth is expected under isochoric deformations. The dissipated strain energy Dcav is defined as the difference between an unvoided and voided hyperelastic material under hydrostatic loading. For reasons of simplicity, it is assumed that the dissipated strain energy reads
![]()
which serves as a working hypothesis. In this context, Ψvol,classic represents the classical formulation of the volumetric part of a Helmholtz free energy function which is explicitly defined in “Appendix A” by Eq. (37).
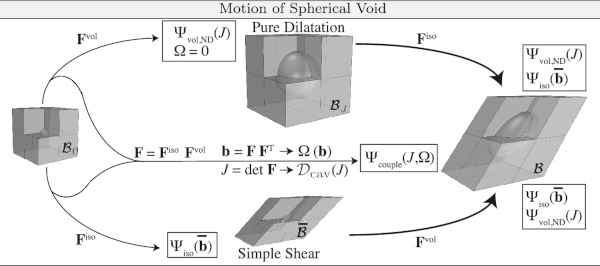
An exemplary illustration of the dissipated strain energy due to void growth is shown in Fig. 3. Since the coupling term depends on the global deformation gradient F, i.e. on isochoric and volumetric deformations, it can be understood as an intermediate configuration between the volumetric and isochoric configurations. To illustrate this, Fig. 4 shows the volumetric, isochoric and intermediate configuration and the associated Helmholtz free energy functions. Since the volumetric deformation gradient is a second order unit tensor weighted with a scalar value, the order of the decomposition of the total deformation gradient is arbitrary. To clarify that the computation of the Helmholtz free energies for the respective configuration is concerned, the undeformed and deformed material bodies (B0, BJ, B¯ and B) including a deforming cavity for the respective configuration are shown.
To be in line with the theory of pseudo-elasticity, a function ϕ depending on Ω must also be added, which serves to implicitly calculate the shape function Ω in terms of the state of deformation. In contrast to the approach of Ogden and Roxburgh (1999), in which ϕ(Ω) was understood as a kind of damage function to describe the Mullin’s effect under cyclic loading of filled rubbers, ϕ(Ω) represents the counterpart of a damage function in this case and thus serves only to determine the shape function Ω. This approach is consistent with the proposed ansatz of Lazopoulos and Ogden (1998), Ogden and Roxburgh (1999) and Dorfmann and Ogden (2003). Accordingly, the entire pseudo-elastic Helmholtz free energy function can be written as

where now the strain energy couple term Ψcouple(J,Ω) is defined as the sum of ΩDcav and ϕ(Ω).
The calculation of the Cauchy stress tensor for a Flory-type hyperelastic material is generally done by
![]()
For the stress calculation of the couple term, Ω must also be considered, since it depends on the macroscopic deformation gradient F or on the left Cauchy Green tensor b respectively. Considering only Ψcouple from Eq. (9), the Cauchy stress tensor is calculated as follows:
![]()
Keeping in mind that Lazopoulos and Ogden (1998) determined an additional equilibrium equation based on equilibrium thermodynamics, which only results from the inclusion of an internal variable in the constitutive model, here Ω, the calculation of the Cauchy stress tensor for the couple term simplifies considerably (Dorfmann and Ogden 2003). Since the additional equilibrium equation
![]()
must be fulfilled according to Lazopoulos and Ogden (1998), the Cauchy stress tensor is calculated after some mathematical manipulations with respect to the pseudo-elastic Helmholtz free energy function of Eq. (9) to
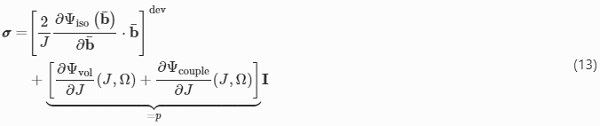
where p represents in general the hydrostatic pressure.
Up to this point the shape function is still unknown, but the constraint equation Eq. (12) implicitly defines the variable Ω. Hence, the pseudo-elastic Helmholtz free energy function is now differentiated with respect to Ω resulting in
![]()
This equation is used in the following to derive the shape function Ω. However, additional constraint equations for ϕ must be defined beforehand. An additional constraint equation according to Ogden and Roxburgh (1999), which must be fulfilled to determine the shape function Ω, reads
![]()
If Ω is inactive, i.e. Ω=0, then the Helmholtz free energy describing isotropic void growth according to Eq. (6) must come out. A third condition is described by
![]()
in particular, intended to provide a softer structural response on the unloading path due to the Mullin’s effect. Since the present material model initially ignores material softening due to cyclic loading, the condition of Eq. (16) is not further considered. A self-evident requirement, which must also be met, is that the shape function is within the limits of Ω∈[0,1].
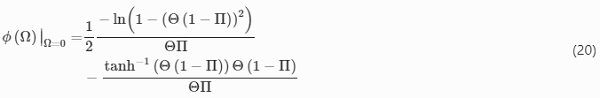
Fulfilling the constraint equations, the choice of ϕ(Ω) is arbitrary. In this case, ϕ(Ω) was chosen in such a way that ϕ′(Ω) reads
![]()
where Θ∈[0,1] and Π∈[0,1] are additional variables that distinguish between volumetric and isochoric deformations or describe the aspect ratio between a deformed to an undeformed cavity. The exact derivation of both variables is described in the following sections.
Returning to the shape function, it can be explicitly described by inserting Eq. (17) into Eq. (14), which leads to
![]()
Since Θ and Π are limited in their functional values, but the dissipated energy Dcav can take any positive values depending on the applied deformation, the value range of the trigonometric function is additionally given with W={tanh(∙)∈[0,1]|∙≥0}. Looking at the right side of Eq. (18), the first term aims for the value one and is monotonically increasing under the condition of increasing isochoric deformation, whereas the second term becomes zero and monotonically decreases. This shows that Ω lies in the range of Ω∈[0,1].
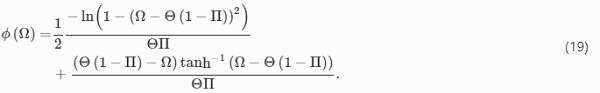
As the shape function is now fully described, the energy function ϕ(Ω) can be determined by integrating Eq. (17) with respect to Ω, which leads to
On the basis of this procedure, the first condition that ∂Ψcouple/∂Ω must be zero is directly fulfilled, since this condition has just determined the shape function. Verifying the second constraint equation according to Eq. (15) by inserting Ω=0 gives
To meet this condition, i.e. to obtain a constitutive model that represents isotropic void growth when Ω is inactive, a new condition results for Θ, which governs the shape function Ω. The new condition to fulfill Eq. (15) is that the parameter Θ must be zero at purely hydrostatic load for which ϕ achieves the limit value zero. In contrast, it should take the value one for isochoric loads, so that this parameter can be described using a Heaviside step function, for example. Since the general concept of the Flory-type pseudo-elastic material model was presented, the parameters Ω and Θ of the shape function are defined more precisely in the following.
3.2 Isoperimetric inequality
As described in the general concept of the pseudo-elastic cavitation model, there is a shape function that governs the strain energy due to the anisotropic geometric development of a deforming void in relation to the dissipated strain energy due to isotropic void growth. For this purpose, a scalar quantity must be found which defines the geometric evolution of a deforming cavity via a shape parameter within the limits zero and one. To do so, one of the fundamental problems in the classical calculus of variations is employed, which is to find the geometric figure with maximum area at a given perimeter (Zwierzynski 2016). The proposed problem can be described by formulating a so-called isoperimetric inequality
![]()
defined in the Euclidean space R². The isoperimetric inequality holds if a simple closed curve s of length Ls, enclosing a region of the area As, is a circle. Thus, ϑ describes the deviation between a deformed closed curve s and a circle. The classical formulation of the inequality ϑ is defined in R² with ϑ∈[0,1]. To obtain a stricter criterion describing the deviation between a deformed closed curve s and a circle, the inequality can be provided with an exponent n, which reads then
![]()
N represents the set of natural numbers. Since the present phenomenological pseudo-elastic approach is intended to model cavitation in rubbers and rubber-like materials, it is decisive to describe the geometrical evolution of an initially spherical cavity with one criterion. For this purpose, the isoperimetric inequality is converted into three-dimensional space in which ϑ is evaluated in three unique geometrical planes. Since the shape of the spherical cavity changes only due to an external deformation, it is obvious to describe the isoperimetric inequality as a function of a macroscopic deformation measure. Therefore the eigenvalues λi with i∈[1,2,3] of the left stretch tensor
![]()
are used to evaluate the isoperimetric inequality. The geometrical planes, in which ϑ is evaluated, are uniquely defined by the cross product of the eigenvectors n→ of the left stretch tensor v, which reads P→i−j=n→i×n→j with i≠j∈[1,2,3]. Duplicate planes are excluded in the following considerations. For reasons of simplicity, a geometric mean value is calculated to evaluate the isoperimetric inequality for the three geometric planes (ϑ1−2, ϑ2−3 and ϑ3−1), i.e.
![]()
This simplification is permissible, since for the present pseudo-elastic Helmholtz free energy function, on the one hand, the strain energy contribution through anisotropic pore growth is considered purely phenomenologically and, on the other hand, a smeared isotropic material behavior is assumed. Both assumptions are merely working hypotheses that can be improved by integrating structural tensors to describe anisotropic material behavior.
As an example, the isoperimetric inequality is determined for the P→1−2 geometrical plane. Within this plane, the surface area of a cut void simply reads As,1−2=πλ1λ2, whereas the perimeter can only be calculated using an approximation. Utilizing the approximate solution in accordance to Ramanujan (Villarino 2005), the perimeter can be calculated with
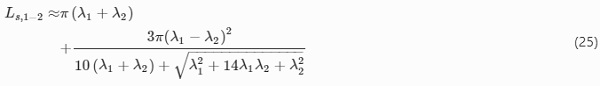
To obtain the values for As and Ls for all other principal stretch planes (1–2, 2–3 and 3–1), the indices of the principal axis have to be interchanged cyclically without considering duplicates. Consequently, the isoperimetric inequality can easily be calculated with respect to Eq. (22) depending on the desired principal stretch plane (1–2, 2–3 and 3–1).
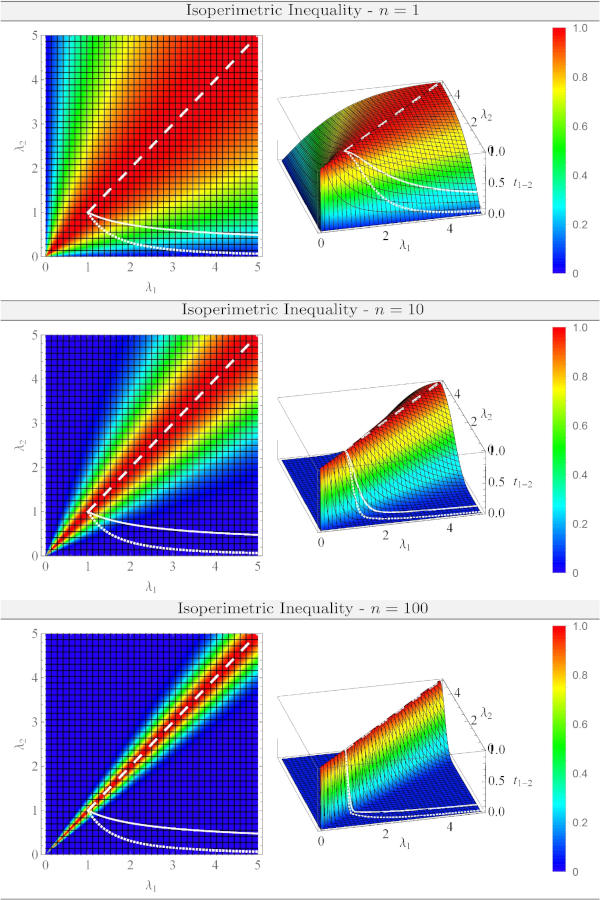
To better understand the behavior of the isoperimetric inequality Π, a three-dimensional representation of it is shown in Fig. 5 depending on the exponent n. In addition, deformation paths according to uniaxial, biaxial and hydrostatic loading conditions are added in this plot to clearly show the dependency between Π and the applied deformation. It is obvious that the inequality assumes the value one for the reference configuration regardless of the deformation applied. Following the hydrostatic loading path, the inequality is always fulfilled and remains at the value one, even if the pore grows spherically. If the isochoric loading paths are followed, the value moves from one to zero for the inequality with increasing deformation. This behavior can be enhanced rapidly by increasing the exponent n.
3.3 Equivalent void growth measure
In this section, an equivalent void growth measure Θ is introduced that distinguishes between isochoric and volumetric deformations in terms of a scalar value. To differentiate between these deformations, a so-called void growth criterion εeqn formulated in Hencky strain space according to Drass et al. (2018b) is used and mathematically modified, so that Θ takes the value zero for volumetric deformations, whereas it becomes one under isochoric loading. The requirement that the criterion equals zero for volumetric deformations results from Eq. (15), which means that the pseudo-elastic Helmholtz free energy function degenerates to Eq. (6). That is, the Helmholtz free energy function is able to represent stress softening due to cavitation under pure hydrostatic loading.
Returning to the void growth criterion, it is defined by
![]()
where I₁,ε, I₂,ε and I₃,ε describe the first, second and third invariants of the Hencky strain tensor ε with
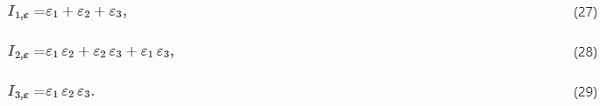
As already mentioned, the equivalent void growth measure is a kind of Heaviside step function, which is generally defined by
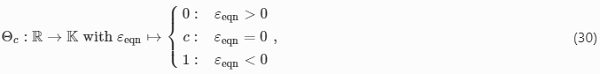
where [0,1,c=0]∈K. Keeping this in mind, the equivalent void growth measure can be fully described by
![]()
This special formulation shows that Θ=1 applies to isochoric deformations since εeqn<0 or takes a value of Θ=0 for the reference configuration and for purely volumetric deformations since εeqn>0 .
3.4 Constitutive modelling and algorithmic settings
The calculation of the Cauchy stress tensor for the pseudo-elastic material model has already been presented in Sect. 3.1 and is summarized in Eq. (13). Due to the additional equilibrium equation resulting from the inclusion of an internal variable in the constitutive model according to Lazopoulos and Ogden (1998), the calculation of the stress tensor could be significantly simplified.
For reasons of completeness the spatial tangent stiffness will be additionally derived in the following. As already shown in the derivation of the Cauchy stress tensor, the components of the additional strain energy coupling term depend on J and b, but only the components of the derivative with respect to J are included in the final equation of the Cauchy stress tensor due to the additional equilibrium equation of ∂Ψcouple/∂Ω=0. Therefore, only the derivation terms according to J are described below. According to the proposal of Holzapfel (2000, p. 265), the volumetric spatial tangent of the strain energy couple term cccouple can be written directly in the Eulerian configuration by
![]()
where I⊗I represents the dyadic product of two second order identity tensors and I describes a fourth-order identity tensor. Based on the simplifications due to the additional equilibrium equation of Eq. (12), the hydrostatic pressure of the strain energy couple term reads
![]()
Since pcouple is now defined by Eq. (33), the parameter scouple must be also computed. It describes the second order derivative of Ψcouple with respect to J, which reads
![]()
Keeping in mind that Ω was already defined in Eq. (18), the calculation of scouple can be simplified to
![]()
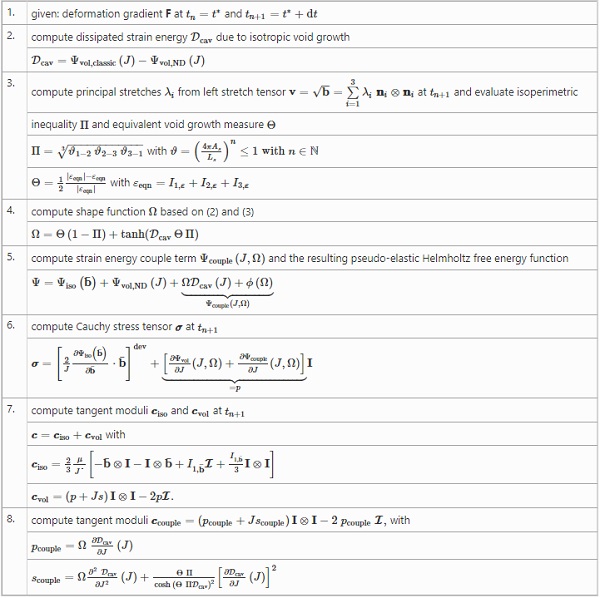
An algorithmic box for the numerical treatment is given in Table 1.
Table 1 An algorithmic box of the FE procedure during numerical simulations for the pseudo-elastic cavitation model - Full size table
3.5 Parameter studies of isoperimetric extension of volumetric Helmholtz free energy function
To get more insight into the function of Ω or Θ and Π, and to understand how the algorithm behaves with any deformations, reference Fig. 6. Here Ω, Θ and Π are shown under different deformation modes with respect to the principal stretch λ1. In this context, λ1 is displayed on a logarithmic scale to investigate the behavior of Ω or Θ and Π at small deformations. For this purpose, a single element test under uniaxial, biaxial and hydrostatic load is numerically investigated. Since Ω, Π and Θ depend only on the principal stretches λi and an acceleration parameter n, the results displayed depend on the deformation λ1 and n. As mentioned at the beginning, the parameter n controls how fast one moves from the initial value of ϑ=1 of the isoperimetric inequality to the value zero due to an isochoric load. However, to obtain the classical isoperimetric inequality, n must be set to one.
To evaluate the described parameters Ω, Π and Θ numerically, a normalized Neo-Hooke material model with μ=1MPa is used. The parameters of Ψvol,ND are selected as examples to perform the numerical calculations of the single-element benchmark tests (κ0=0.02181, κ1=0.67900 and κ2=0.09791).
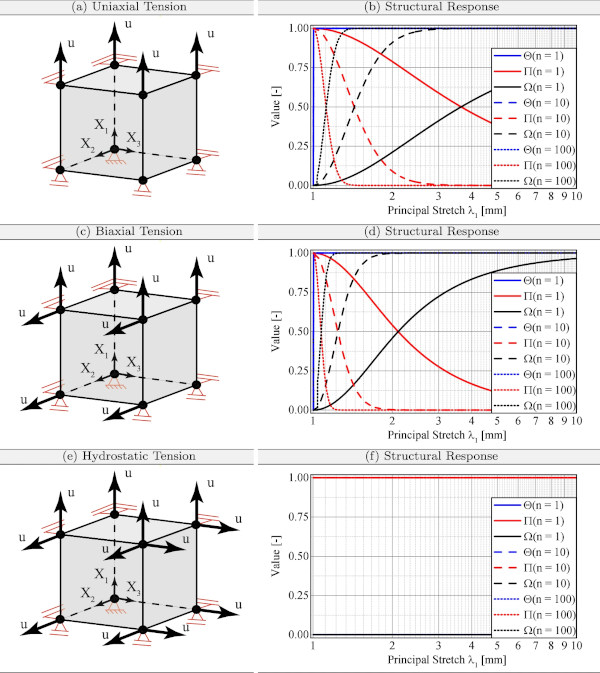
As shown in Fig. 6, Θ starts at Θ=0 and very quickly reaches Θ=1 for isochoric deformations (UT, BT). In contrast, for triaxial loading, Θ=0 with the result that only Ψvol,ND is active during numerical calculation. It should also be noted that the equivalent void growth measure Θ starts at a value of Θ=0 for zero deformations. The structural reaction of the isoperimetric inequality Π starts at zero deformations (λ1=λ2=λ3=1) with a value of Π=1. For the homogeneous hydrostatic load state, Π=1 for the entire deformation regime, while for isochoric deformations the isoperimetric inequality decreases from one to zero depending on the parameter n. By increasing the parameter n, the proposed constitutive model converges to the classical formulation of Ψvol,classic much faster, as the influence of Ψvol,ND is reduced significantly.
In summary, in this section the volumetric Helmholtz free energy function proposed by Drass et al. (2018b) was successfully transferred into the context of pseudo-elasticity in order to prevent anomalies in structural behaviour, especially in isochoric deformation (see “Appendix B”). Therefore, the volumetric component of the model was equipped with the nonlinear Helmholtz free energy function that accounts for isotropic void growth under hydrostatic loading. An energy coupling term was then added that numerically explicates strain energy under isochoric deformation, while also guaranteeing physical material behaviour. The energy contribution is calculated internally by analysing the geometric evolution of inherent voids. On the basis of one-element tests at any deformation, parameter studies were carried out to confirm the physical behaviour and to analyse the influence of individual parameters.
4 Numerical validation of constitutive model
This chapter aims at the validation of the proposed material model. First of all, the quasi-static uniaxial tensile test and the bulge test are investigated with the pseudo-elastic cavitation model presented in Sect. 3. To show the general validity of this model, pancake tests with three different diameters are numerically calculated and compared with the experimental ones. Since, according to literature (Dal et al. 2018), it has not yet been possible to validate cavitation material models over full-scale small component simulations, this is presented here for the first time.
4.1 Transparent structural silicone adhesive
The product DOWSIL™ TSSA, a transparent structural silicone adhesive, promises however due to its material properties, its high resistance to external environmental influences and its transparent appearance a higher application of silicones in this industry (Drass et al. 2019b). An interesting behavior can be observed when this material is exposed to isochoric or hydrostatic loading conditions. Under such loading conditions, the initially transparent silicone shows an increasingly opaque or white appearance, which usually is taken as an indicator of material softening.
The micro-structure of TSSA consists of polydimethylsiloxanes (PDMS) and a high amount of nano-silica particles (ca. 20–30%). The nano-silica particles form aggregates, where one nano-silica particle has a diameter of approximately 1 nm (Drass et al. 2019b). At the boundaries of these aggregates a multitude of nanocavities can develop due to the manufacturing process, which may lead to an increased porosity or also called finite porosity. In addition, the initially constant porosity can increase during deformation, when vacuoles arise at the boundaries of the nano-silica surfaces during stretching due to weak or non-existing filler-matrix interaction. Especially in flat-bonded transparent silicone adhesive joints under axial load, the so-called cavitation effect is present, in which a very dominant effective stress softening can be detected due to strong void growth under hydrostatic tensile load. In experimental investigations on the cavitation effect on TSSA, which are usually carried out in so-called pancake tests, the effect of the white coloring was detected and analyzed by Drass et al. (2018b). In the pancake test, flat-bonded steel cylinders are pulled axially. As a result of the hindered lateral contraction, a triaxial stress state is generated in the material, which leads to excessive void growth.
4.2 Simulation of dumbbell-shaped tensile test
Dumbbell-shaped tensile tests, also known as uniaxial tensile tests, are the most common tests when analyzing the structural behavior of any materials, since they are relatively simple to perform. To proof that the pseudo-elastic cavitation model of Sect. 3 is able to approximate this behavior correctly—not leading into a non-physical behavior due to disproportional void growth—a full-scale simulation of the dumbbell-shaped tests presented by Drass et al. (2018c) is performed.
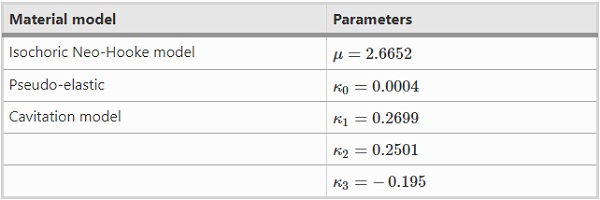
Since the present constitutive model only considers isothermal processes at a constant strain rate of , this study investigates the stress-strain behavior under a constant temperature of T=23∘C and a quasi-static displacement rate vUT=5mm/s. Based on the results of Drass et al. (2018c), TSSA exhibits a non-linear elastic behavior until fracture occurs—a characteristic property for rubber-like materials—however, TSSA does not exhibit strain stiffening due to locking stretches of the macro-molecules in the polymer matrix. Consequently, when considering isochoric deformations, simple isochoric constitutive models, like the Neo-Hookean model, can be used for TSSA (Drass et al. 2018d). The parameters of the pseudo-elastic cavitation model were obtained using inverse numerical optimization methods. Since the focus of this work is not on determining the parameters, reference is made to the work of Drass et al. (2017) to determine them. The material parameters used to characterize TSSA are given separately in Table 2 for the isochoric and volumetric Helmholtz free energies. The parameters have been determined simultaneously based on the uniaxial, biaxial and pancake tests. Since the meaning of the shear modulus is simple, the fully metric material parameters of Ψvol,ND are described vividly in “Appendix C” in order to better understand and illustrate their meaning.
Based on the determined material parameters for the pseudo-elastic cavitation model, the critical hydrostatic pressure pcr at which cavitation ensues is reached for a critical relative volume of Jcr=1.041. During the uniaxial tension test the deformations are mainly volume-constant because the voids drastically change shape but not in volume. This means the numerical calculation of the test should not give way to substantial void growth.
Table 2 Optimised material parameters for TSSA for pseudo-elastic cavitation model - Full size table
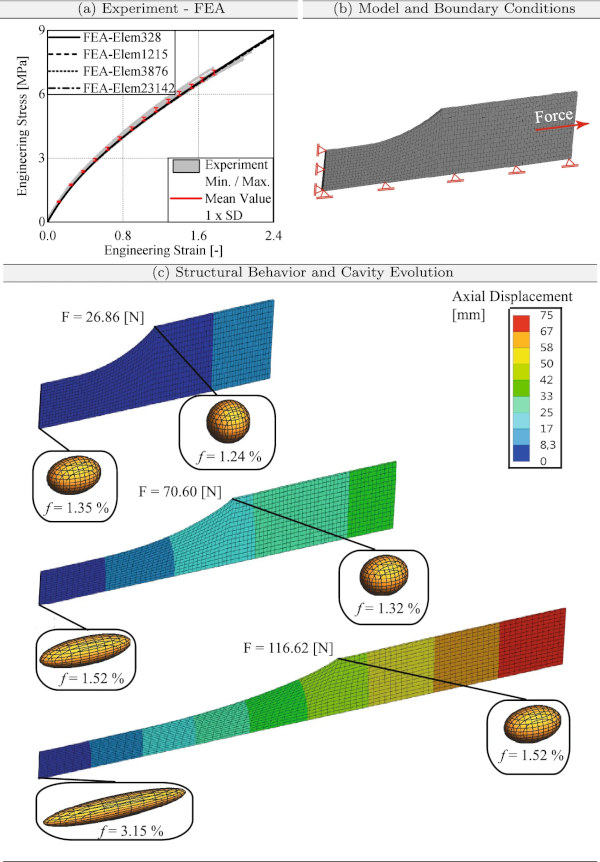
This can be confirmed regarding Fig. 7, where the results of the numerical calculation are visually compared with the experimental results. Figure 7 a compares the structural response of both the experiment and the finite element calculations. The min. / max. values of the experiments are gray curves, the mean values are red circles and the standard deviation (1 x SD) is an error bar. All numerical calculations were performed with an increasing amount of finite elements (328–23,142 Finite Elements) to analyze a potential mesh dependency. The results show no mesh-dependency for the simulations of the uniaxial tensile tests.
The numerical model in Fig. 7b displays the boundary conditions at a constant mesh density. Since three-dimensional numerical calculations were performed, three-dimensional, higher-order volume elements with purely quadratic displacement behaviors were used. A solid element consists of 20 nodes with three degrees of translational freedom. In order to shorten the calculation time, three symmetry axes were used to analyze one eighth of a sample. A displacement of u=75.00mm was applied incrementally to the top of the numerical model. Thus, the simulation was carried out displacement-controlled. The numerical results of the pseudo-elastic cavitation model and the experimental structural response calculations correspond well.
Since the constitutive approach takes void growth and the geometric evolution of cavities into account, the cavity evolution at various positions and load-steps can be seen in Fig. 7c. The geometrical evolution of the cavities is calculated by evaluating the isoperimetric, volumetric shape function Ω(Π,Θ). Based on numerically calculated values of the equivalent void growth measure Θ and the isoperimetric inequalities t1−2, t2−3 and t3−1, the geometric evolution of an initially spherical cavity is calculated and visualized. Figure7c illustrates how the initially spherical cavities deform with minimal change in volume: they actually morph into a “cigar-like” shape. This is confirmed by evaluating the actual void fraction f in the current configuration. The void fraction f can be calculated by
![]()
The relative volume J is calculated at each Gaussian point and at each load step. TSSA has an approximate initial pore content of approximately f0≈3.0% (Drass et al. 2019b).
Figure 7 demonstrates that when a compressible hyperelastic material is loaded isochoric, there is a slight increase of void fraction, especially at large strains. This is natural, since the bulk modulus is not infinite for the analyzed material. Stress softening due to excessive void growth is not observed in the experiment or in the simulation. Consequently, the presented constitutive modeling approach, where an isochoric Neo-Hookean material model was coupled with the pseudo-elastic cavitation model from Sect. 3, is able to validate a simple tensile test without leading to non-physical results.
4.3 Simulation of bulge-test
So-called bulge tests on TSSA were presented by Drass et al. (2018c), where the foil-like TSSA was inflated in a balloon shape using a special test device. In order to measure local strains, a stochastic speckle pattern was applied to the material to be tested. By this experimental set-up, a strain state near equi-biaxial tension can be examined.
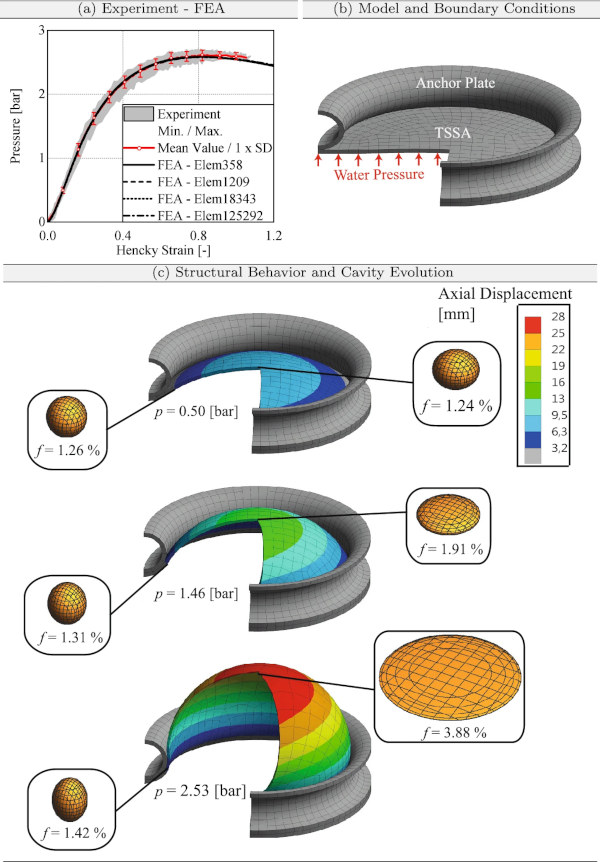
The numerical model of the bulge tests was build up according to the test set-up. Rotational symmetries in the test set-up were employed to reduce the calculation time (see Fig. 8b). In accordance with Sect. 4.2, higher order, three-dimensional solid elements were used to calculate the three-dimensional numerical model of the bulge test. The anchor plate and the edge of the TSSA were fixed supported. A pressure p was applied to the bottom of the TSSA film to inflate it like a balloon. The finite element calculation was accomplished force-controlled. As a result of the force-controlled simulation of the bulge test, an instability problem occurs at very large deformations, so that the arc length method must be applied in the simulation. With increasing deformation, the TSSA film leans against the anchor plate so that a contact formulation must be used in the numerical model. The normal Lagrangian detection method was utilized for contact modeling The contact formulation defines a surface contact that can only be open or closed, and the normal Lagrangian formulation closes all gaps and eliminates penetration between the contact and target surfaces. The investigation of the effects of friction determined that the coefficient of friction has no influence on the force-displacement behavior. Therefore, the contact algorithm is formulated with a frictionless approach.
Figure 8a compares the structural response between the bulge test and the finite element analyses. Here it becomes clear that the structural responses of the numerical models lie within the standard deviation of the experiment. This proves that the novel constitutive model approach is ideally suited to take biaxial deformations into account. The increasing mesh density shows no significant deviation between the structural responses of the finite element calculations.
Figure 8c references the cavity evolution during biaxial deformation. According to the results of the uniaxial tensile tests (see Fig. 7c), the initially spherical cavities deform under almost volume constant conditions. This is obvious, since the bulge test is supposed to represent a nearly isochoric deformation. Softening in the experimental and numerical structural responses is a typical phenomenon for the bulge test. However, the observed softening has nothing to do with stress-softening due to cavitation. This can be explained by the void volume’s lack of change, even at large deformations. Due to the isochoric, biaxial deformation during the bulge test, the spherical cavities deform into a penny shape. As already mentioned, stress softening due to cavitation can be excluded when analysing the bulge test. Considering Fig. 8c the actual void volume is shown at different positions and at different load steps. Here, a slight increase in void volume can be seen at very large deformations, but this is primarily due to the compressible material formulation and not to cavitation.
4.4 Simulation of pancake tests
In this section numerical simulations of pancake tests from literature (Hagl et al. 2012a, b; Drass et al. 2018b) are carried out. Starting with the simulation of the pancake tests with a diameter of 20 mm based on the investigations by Hagl et al. (2012a, b), two flat-bonded steel cylinders were loaded in axial tension. Due to the lack of lateral contraction in the experimental set-up and the almost incompressible material behavior, large volumetric deformations occur in the adhesive layer. These conditions lead to the cavitation effect, and consequently to severe stress softening in the structural behavior.
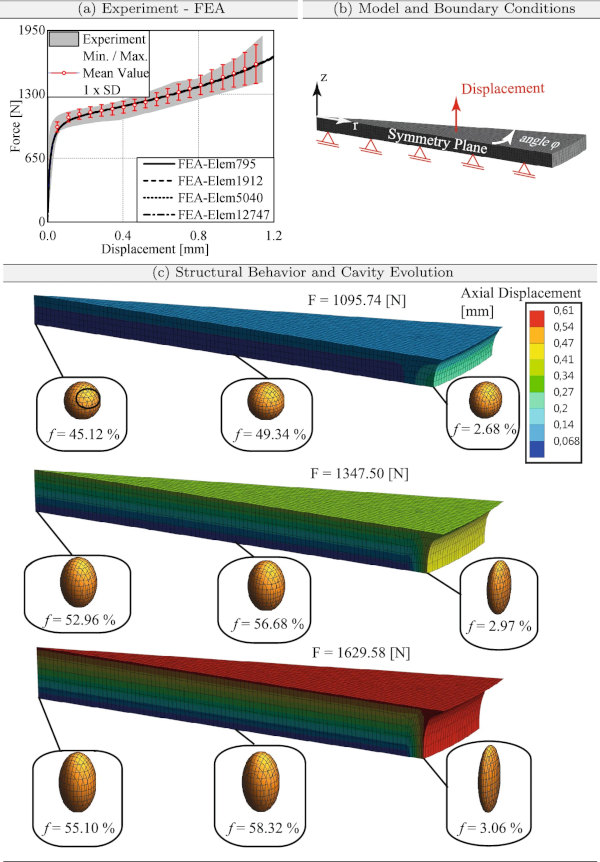
The aim of this study is to numerically reproduce the structural response of the pancake test including the pronounced cavity growth that leads to a strong softening of the material. Symmetry boundary conditions were used to numerically model an angle ratio φ between a full cylindrical model and a specific section (see Fig. 9b). The lower surface of the numerical model is only supported in the z-direction. Because of this, r and φ are free in their deformation. The radial and tangential degrees of freedom (r and φ) were fixed for the upper side of the numerical model, while an axial displacement corresponding to the deformation of the pancake test was applied in the vertical z-direction. As a result, the finite element calculation was controlled by a continuous increase of the displacement. In accordance with the three-dimensional models for the uniaxial tensile test and the bulge test, the pancake test was also modeled three-dimensionally with three-dimensional volume elements. Since the structural response of the numerical model and the experimental results agree, the novel constitutive modeling approach can adequately represent the strongly nonlinear structural behavior of the pancake test (see Fig. 9a). Furthermore, no mesh-dependent results are observed in the numerical analyses.
Due to the initially almost incompressible material behavior, void growth must be taken into account for the numerical analysis of the pancake test. Cavity evolution is easy to prove: The initially spherical cavities begin to grow in both axial and lateral directions, and a closer look at Fig. 9c reveals that the void volume inside the adhesive increases significantly because of the constrained axial loading. At the edge of the adhesive, where the disability of lateral contraction is not very pronounced, the void volume increases only slightly. This demonstrates that there is a clear softening inside of the material due to excessive void growth, while the marginal areas are not influenced by the cavitation effect. Therefore, the deformation of the pancake test is not comparable with the almost volume-preserving deformation of uniaxial tensile tests and the biaxial tensile test.
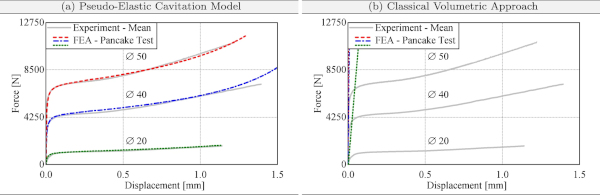
Since it has already been shown that the pseudo-elastic cavitation model is well suited to approximate the pancake tests performed by Hagl et al. (2012a, b), additional pancake tests with other diameters are simulated in the following. All simulation models are provided with the same set of material parameters, which are summarized in Table 2. The simulation results for three different diameters are shown in Fig. 10a. It is obvious that the pseudo-elastic cavitation model is very well suited to approximate the behavior of TSSA in the pancake test for different diameters. The model is able to represent the increase in initial stiffness for larger diameters of the pancake test specimen. Furthermore, the occurrence of the cavitation effect and the associated strong material softening is well approximated. With increasing deformation, the load can be increased, which can also be modeled by the new model.
In order to further show that the classical formulation of the volumetric Helmholtz free energy function Ψvol,classic, which is generally implemented by default in commercial FE codes, is not sufficient to represent the material softening in the pancake test, these were simulated again with the classical formulation (Fig. 10b). Here, only the initial stiffness can be approximated, which is not sufficient to represent the stress softening and accordingly the ductility of the bond.
5 Conclusions
This paper analyses cavitation in rubber-like materials, commonly understood as sudden cavity growth under hydrostatic stress. The experimental, analytical and numerical treatment of this phenomenon is an integral part of materials and mechanics research. However, many numerical approaches lack a user-friendly environment in terms of finite element calculations and numerical robustness. This paper presented a novel constitutive modeling approach for cavitation in rubbers and rubber-like materials, in which the volumetric part is equipped with a strongly non-linear Helmholtz-free energy function (Drass et al. 2018b), which is responsible for isotropic void growth under hydrostatic loading conditions.
The classic formulation of Ψvol,ND was extended to a generalized form (see Eq. 43) so that the set of volumetric material parameters can be controlled by the running index n. Furthermore, an extension of the classic volumetric–isochoric split was carried out, where the addition of a coupling term Ψvol,couple makes it possible to consider the cavitation effect in numerical calculations using a simple approach. The coupling term creates the consideration of cavitation in the form of stress softening under volumetric loads. However, if isochoric deformations occur, such as uniaxial or biaxial tension, the coupling term prevents extreme pore growth and consequently material softening due to pore growth. The key element of this constitutive modeling approach is the geometric analysis of the development of initially spherical cavities under any deformations. For this purpose, Ω was defined as an isoperimetric volumetric form function that takes into account whether a void grows and how the void grows geometrically. Since Ω must explain if and how a void grows, it was constructed as a function of equivalent volumetric strain and isoperimetric inequality.
To validate the novel constitutive model approach, three experiments from the literature were simulated with the novel model. Three-dimensional finite element calculations were then performed on a simple uniaxial tensile test and a biaxial tensile test (in the form of a bulge test) Drass et al. (2018c) to validate the material law for isochoric deformations. The numerical analyses presented that the material behavior, as well as the evolution of inherent voids, could be well approximated. Furthermore, it was shown that the new material model does not soften the material due to void growth in isochoric deformations, in accordance with physical behavior. In contrast to the isochoric tests, the so-called pancake test was also modeled numerically, in which two flat-bonded steel cylinders are pulled axially (Hagl et al. 2012a, b). Due to the almost incompressible material behavior in the heavily constrained tensile test, large volumetric deformation occurs due to void growth, which leads to an enormous material softening. The experimental structural response as well as the geometry evolution of inherent pores could be simulated very well with the novel material model. Furthermore, the new material model made it possible to calculate material softening, which was previously not possible with commercial FE codes.
Future work will deal with an extension of the developed model with respect to the viscoelastic and temperature-dependent behavior in that direction that the models can be applied for structure calculation of thin silicone adhesive joints in high temperature environments such as the Middle East.
Abbreviations
References
Acknowledgements
Open Access funding provided by Projekt DEAL. We would like to gratefully thank The Dow Chemical Company (“DOW”) for their support during our studies. Additionally, we would like to thank Julia Schultz and Joseph Yost for the help with the linguistic fine-tuning of the paper.
Author information
Authors and Affiliations
Institute of Structural Mechanics and Design, Technische Universität Darmstadt, Franziska-Braun-Str. 3, 64287, Darmstadt, Germany - M. Drass & J. Schneider
Alzenau, Germany - P. A. Du Bois
Institute of Mechanics and Materials, Technische Hochschule Mittelhessen, Wiesenstraße 14, 35390, Giessen, Germany - S. Kolling
Corresponding author
Correspondence to M. Drass.
Appendices
*****