Authors: Cenk Kocer, Antti Aronen, Richard Collins, Osamu Asano & Yumi Ogiso
Source: Glass Structures & Engineering | https://doi.org/10.1007/s40940-022-00182-0
Abstract
Non-uniformities in the heat flow through the support pillars in vacuum insulating glass (VIG) can lead to significant errors in the measurement of the thermal insulating properties of these devices. This paper discusses these errors in instruments for which the measurement area is in direct thermal contact with the glass sheets. The spatial non-uniformities of the heat flow in different VIG designs are modelled using the finite element method. For measuring areas with large dimension compared with the separation of the support pillars, the errors are unacceptably large for all practical designs of VIG when using guarded hot plate instruments. These errors are less for heat flow meter instruments due to the construction of the heat flux transducer.
Introduction
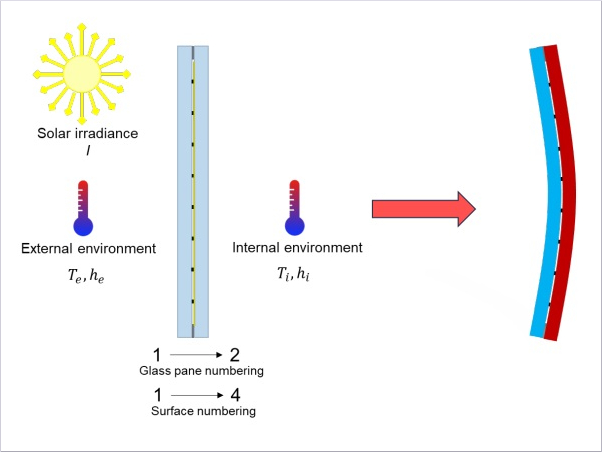
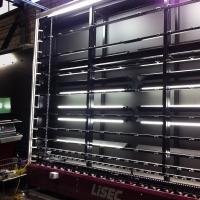
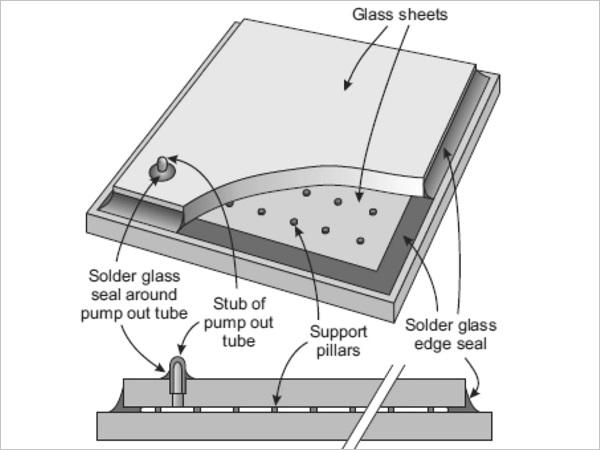
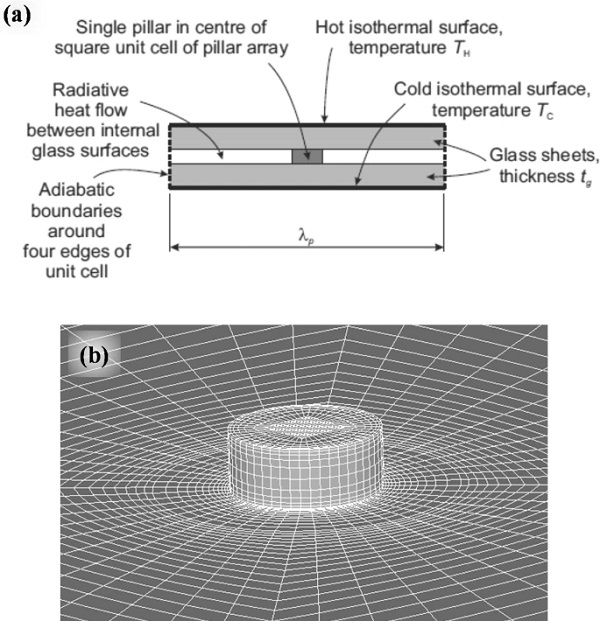
Vacuum insulating glass (VIG), shown in Fig. 1, is a thermally insulating glazing consisting of two sheets of glass that are hermetically sealed together around the edges, with a thin highly evacuated internal space (Collins and Robinson 1991; Collins and Simko 1998; Collins et al. 1995). The separation of the glass sheets under the forces due to atmospheric pressure is maintained by an array of small support pillars. The pillars are placed on a square grid separated by λp. We define a unit cell of the pillar array as a square area of dimensions λp×λp, with sides oriented parallel to the rows of pillars and a single pillar at the centre.
Several processes contribute to the heat flow through a VIG specimen: thermal conduction through the support pillars, radiation between the internal surfaces of the glass sheets, thermal conduction through residual gas, and thermal conduction along the glass sheets in the vicinity of the edge seal. We define the heat flux as the heat flow per unit area at any point, with units W m⁻². The highly localised heat flow through the pillars, and the heat flow along the glass sheets near the edge seal, result in significant spatial non-uniformities in the heat flux across the external surfaces of the glass sheets of the VIG.
Since 1989, the University of Sydney has undertaken a comprehensive program of research and development on VIG science and technology (Collins and Robinson 1991; Collins and Simko 1998; Collins et al. 1995; Ashmore et al. 2016). An essential part of this program is the ability to characterise the heat flow through VIG specimens. This is done using custom built guarded hot plate instruments in which the dimension of the measurement area is small compared with the separation of the support pillars (Collins et al. 1993; Dey et al. 1998). The separate contributions to the heat flow due to individual pillars, and radiation between the glass sheets, are combined to give the total heat flow. Data obtained with these instruments have been validated by measurements on large area specimens in conventional calibrated guarded hot box instruments (Simko et al. 1999).
Unfortunately, the small area guarded hotplate is not a commercial instrument that is readily available. Standard commercial guarded hotplate and heat flux instruments typically measure contributions from many pillars. With such instruments, the measured heat flow through a VIG specimen is, in general, dependent on the position of the measuring area relative to the pillar array.
This is the first (Part 1) of two papers that discuss the measurement of the thermal insulation properties of VIG specimens using large area instruments in regions remote from the edges. This paper deals with configurations in which the measuring area of the instrument is in direct thermal contact with the glass sheets of the VIG. In this situation, the heat flowing into the measurement area can differ significantly from the average heat flow through the VIG over an equivalent area because of the pillars, leading to errors in the measurements.
The second paper (Part 2) considers a configuration in which the spatial non-uniformities in the heat flux entering the measurement apparatus are reduced by inserting slabs of thermally insulating material, referred to as buffer plates, between the glass sheets and the apparatus. It is shown that, for square measurement areas large enough to contain at least several unit cells, highly accurate estimates of the average heat flow through the VIG can be obtained for a wide range of specimen properties and area dimensions. However, the buffer plates cause effects associated with heat flow through the VIG edges to spread across the surface of the VIG. The measurement area must be positioned far enough from the edges for such edge effects to be negligible.
Background material
Use of thermal conductances and resistances
In the following, we use the convention of labelling the external glass surface of the VIG on the cold side as 1 and the external glass surface on the hot side as 4, with the internal surfaces facing the vacuum gap labelled 2 and 3 in sequence.
To a good approximation, at points remote from the edges, the average total heat flow Q through a large area A between the glass sheets of a VIG is proportional to A and to the difference between the average surface temperatures T4 and T1 of the glass sheets over that area (Wilson et al. 1998):
![]()
The term hv in Eq. (1) is referred to as the thermal conductance and has units W m⁻² K⁻¹.
The separate contributions to the heat flow due to the pillars and radiation can be characterised by similar relations, with thermal conductances written hp and hr respectively. In well made VIGs, heat flow due to residual gas is negligible, and is not considered further in this paper. Should significant gas conduction occur, however, it has the same effect as increasing the thermal conductance due to radiative heat flow.
In all cases of practical interest, the heat flows due to pillars and radiation can be considered independently (Wilson et al. 1998). The total thermal conductance hv between the glass sheets of the VIG can then be written:
![]()
The heat flow Q through area A between the surrounding internal hot and external cold environments at temperatures TH and TC and the surfaces of the glass sheets is also characterised (American Society of Testing Materials 1991) by thermal conductances hi and he respectively (also referred to as the heat transfer coefficients):
![]()
The heat flow through the VIG unit from the environment on the hot side to the environment on the cold side can then be characterised by an overall heat transfer coefficient, hH−C, (also referred to as the U-value of the glazing), where:
![]()
In this paper, U-values are calculated using values of he and hi of 23 and 8.3 W m⁻² K⁻¹, respectively (International Organisation for Standardization 1994).
It is also convenient to define the thermal resistance of a unit area R (with units m² K W⁻¹) associated with individual or combined physical heat transfer processes as the inverse of the relevant thermal conductance:
![]()
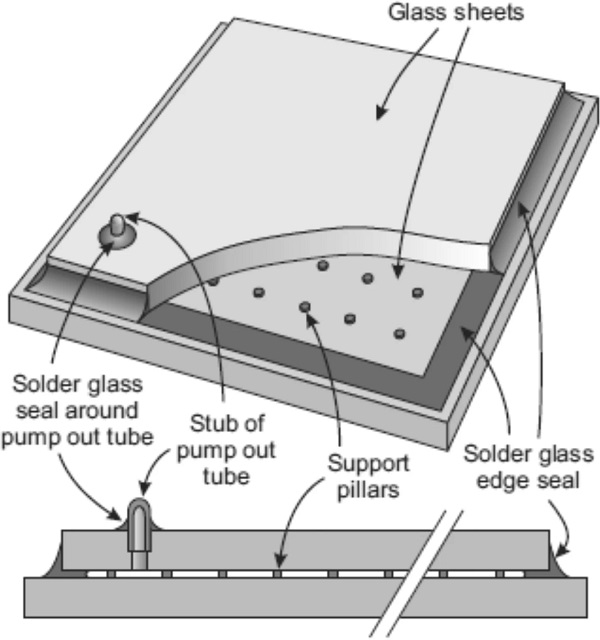
The thermal equivalent circuits in Fig. 2a and b illustrate the relationships in Eqs. (1) to (5).
Figure 2c shows a more complete thermal equivalent circuit that includes the thermal resistances of the glass sheets on the hot and cold sides: 1/hgi and 1/hge, respectively. In all practical cases, these thermal resistances are less than 0.5% of that due to radiative heat flow and can be ignored at this level of analysis.
In the measurement configuration discussed in Part 2, the buffer plates positioned between the external surface of each glass sheet of the VIG and the adjacent isothermal surface are assumed to be identical plane parallel slabs of material, with thickness tb and thermal conductivity kb. For such buffer plates, the heat transfer coefficients he and hi in Eqs. (3) and (4) are replaced by the heat transfer coefficient of the buffer plate hb:
![]()
The thermal resistances Rb and Rv associated with the heat flow through a unit area of the buffer plates and between the glass sheets are, respectively:

![]()
Mechanisms for heat flow through a VIG
In most practical VIG designs, the pillar acts as a local thermal short circuit between the glass sheets. The magnitude of the heat flow through each pillar is therefore determined almost entirely by the spreading resistance associated with the heat flow in the glass sheets very close to the pillar. In addition, the pillar diameter is very small (typically ≲0.5 mm) compared with the thickness of the glass sheets (typically ≳3 mm). The volume of glass adjacent to each pillar for which significant temperature non-uniformities exist is thus very small compared with the total volume of glass, and the temperature non-uniformities on the external surfaces of the glass are quite small. This justifies the characterisation of the heat flow due to the pillars in Eqs. (1) and (2) using a thermal conductance and average temperatures T1 and T4 of the glass sheets.
In most practical VIG units the magnitude of the heat flow (in W) through a single highly conducting support pillar Qonepillar can be written (Wilson et al. 1998):
![]()
where rp is the radius of the pillar, kg is the thermal conductivity of the glass.
For this total heat flow, it is convenient to define the specific thermal resistance of a pillar, ζonepillar:

For some designs of VIG, the material of the pillar itself can also have a small, but measurable effect on the heat flow. In this case, to a very good approximation the thermal resistance associated with the heat flow through a single pillar is the sum of the spreading thermal resistance given in Eq. (10) and the thermal resistance associated with uniform heat flow through the pillar itself (Collins and Fischer-Cripps 1991). In this approximation, for a pillar of height Hp made from material of thermal conductivity kp, Eq. (10) then becomes:

For VIGs with metal pillars, the thermal resistance of the pillar material itself is negligible compared with the spreading resistance in the glass sheets and is ignored in the following discussion.
To a good approximation the heat flow through each individual pillar is independent of the heat flow through all the other pillars (Wilson et al. 1998). The heat flow through area AA due to the pillar array Qpillararray can thus be written:
![]()
We can therefore write the thermal conductance of the pillar array hp as:
![]()
To a good approximation, the radiative heat flow between plane parallel surfaces of area A and hemispherical emittances εhot and εcold at temperatures Thot and Tcold is given by Zhang et al. (1997):
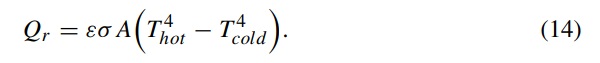
In this expression, σσ is the Stefan-Boltzmann constant (5.67 × 10⁻⁸ W m⁻² K⁻⁴), and εε is the effective emittance of the two surfaces, given by:
![]()
As mentioned, in all practical VIG designs, the non-uniformities in the temperatures due to the pillars are spatially limited and have negligible effect on the overall radiative heat flow (Wilson et al. 1998). Also, as noted above, the thermal resistance for heat flow through the glass pane is negligible compared with that due to radiative heat flow, so the external surface temperatures can be used to obtain a good approximation of the radiative heat flow between the glass panes. We can therefore define the mean temperature Tm of the internal glass surfaces as:
![]()
To first order we can then write:
![]()
The thermal conductance associated with radiative heat transport hr can thus be written:
![]()
Practical limits on VIG design parameters
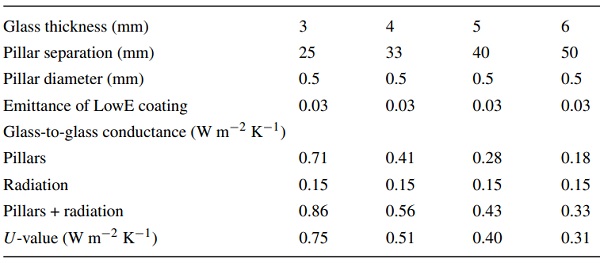
The absolute and relative magnitudes of the spatial non-uniformities in the heat flux through VIGs are greater for thinner glass sheets, more widely separated pillars, larger diameter pillars, and lower emittance coatings. A detailed discussion of the process for designing VIG is beyond the scope of this paper. However, the designs of current commercial VIG products, and results of earlier design studies (Collins and Simko 1998; Kocer 2011; Collins et al. 1999), can be used to make reasonable estimates of the maximum pillar separation for different glass thicknesses. For each glass thickness, VIGs with these maximum separations have the lowest possible thermal conductances and exhibit the largest heat flux non-uniformities. The designs and performance of these VIGs with 0.5 mm diameter pillars, and low emittance coating on one internal surface only, are shown in Table 1.
Table 1 Design parameters that lead to the largest non-uniformities in the heat flux in practical VIGs - Full size table
Measurement and modelling of heat flow
Measuring heat flow: available equipment and measurement procedures
The thermal insulation properties of uniform, plane parallel slabs of material are conventionally measured in a guarded configuration (International Organisation for Standardization 1991b). In this type of equipment, the specimen is positioned between two isothermal surfaces at hot and cold temperatures TH and TC, respectively. In the measurement, the heat flow through an area near the centre of one or both plates is detected. The isothermal plates in the region beyond the measurement area, referred to as the guard region establish approximately plane, parallel isotherms in the insulating slab, resulting in nearly uniform heat flow over the measurement area.
The two different guarded configurations that have been used to measure the heat flow through VIGs are the guarded hot plate apparatus and the heat flow meter, shown in Fig. 3.
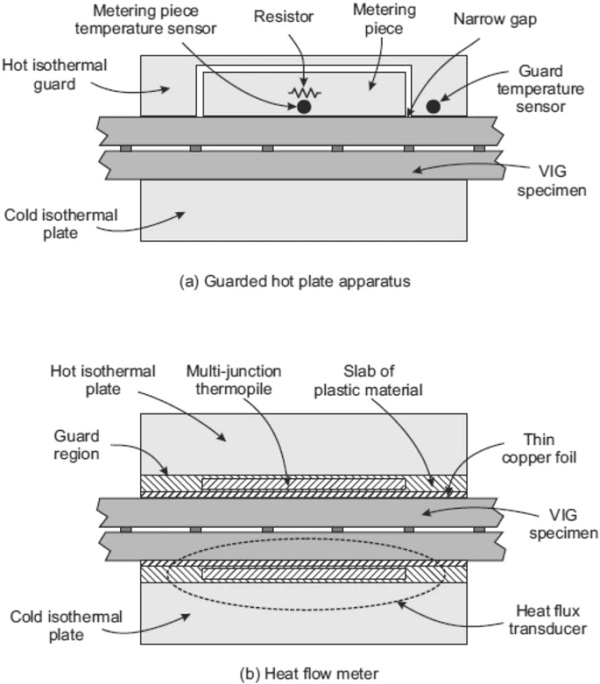
In the guarded hot plate apparatus (International Organisation for Standardization ISO 8302, 1991a) (Fig. 3a), the hot isothermal surface is separated into two regions ‒ a central metering piece and a surrounding isothermal guard that is maintained at the constant hot temperature. The coplanar faces of both pieces are separated by a small gap and contact the hot glass sheet of the VIG specimen. These two pieces are relatively well thermally isolated apart from the thermal contact through the specimen at the gap. The outer surface of the other glass sheet is in good thermal contact with a second isothermal surface at the cold temperature.
Heat flow occurs directly from the hot guard through the specimen, and from the guard to the metering piece and then through the specimen. This causes the temperature of the metering piece to be slightly less than that of the guard. Power is dissipated in the metering piece increasing its temperature. When the temperatures of the guard and metering piece are precisely equal, the heat that flows between them is zero, and all the dissipated power flows through the sample. An absolute estimate of the thermal insulating properties of the specimen can be obtained by assuming that the effective area of the metering piece is defined by the middle of the gap. The effective area of the metering piece can be estimated to higher accuracy by measuring a calibration sample.
In heat flow meter instruments (International Organization for Standardisation ISO 8301, 1991b) (Fig. 3b), each side of the specimen being measured is in good thermal contact with a heat flux transducer. In the following, the dimensions and properties of the transducers are typical of those in some commercial instruments. Each transducer consists of a ~ 1 mm thick plane parallel slab of plastic material of thermal conductivity ~ 0.25 W m⁻¹ K⁻¹. The slab has an embedded thermopile with many junctions that are distributed over a well-defined area.
The side of each transducer contacting the specimen is covered with a thin (~ 30 μm) copper foil. The respective sides of the transducers remote from the specimen are in good thermal contact with hot and cold isothermal plates. The same heat flow occurs through the specimen and transducers. The temperature difference across the specimen is slightly less than the total hot-to-cold temperature difference and is determined from the measured temperatures of the copper foils. The output of each thermopile is proportional to the heat flow through it, and therefore to the heat flow through the specimen. These measured data can be used to determine the insulating properties of the specimen by measuring a calibration sample.
When these two types of instrument are used to determine the thermal insulating properties of a VIG, the measured heat flow depends on the position of the measurement areas relative to the pillar array. In the guarded hot plate apparatus at the null condition, the contacting metering piece and guard are at the same temperature. The spatial non-uniformities in the heat flux through the metering piece and guard are therefore the same as when the external surfaces of the glass sheets are isothermal. When using a heat flow meter, the spatial distribution of heat flux in the glass sheets is very similar because the temperature difference across the heat flux transducers is a very small proportion of the total temperature difference. However, significant lateral heat flow occurs in the copper foils due to the high thermal conductivity of this material. As a result, the lateral variations in the heat flux in the thermopile regions of the transducers are significantly less than at the copper-glass interface.
The practical significance of this result is that the maximum position-related errors in the measurement of a VIG with a heat flow meter are less than for a guarded hot plate apparatus. The extent to which these errors are reduced depends on the detailed design of the heat flux transducer, which is in general commercially confidential. These two papers are therefore primarily concerned with the maximum possible measurement errors that could occur with a guarded hot plate due to the localised heat flow through the support pillars in VIGs.
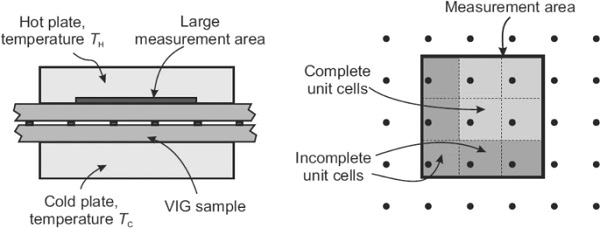
Figure 4 illustrates the origin of the errors when determining heat flow through a VIG with a square measuring area A of dimension w that is significantly larger than λp.
In both types of instrument, contributions to the measured heat flow associated with heat flow through the VIG edge seal must be negligible. When the glass sheets are in good thermal contact with isothermal surfaces (Fig. 4), this occurs if the closest point of the measuring area is at least 5 glass thicknesses (~ 20 ‒ 30 mm) away from the edges. In heat flow meters, the heat flux transducer causes the edge effect to spread slightly further across the surface of the glass sheets. Part 2 presents analytic and finite element modelling procedures for determining the spreading of the heat flow through the edges when buffer plates are used. These procedures can be applied to the geometry of the heat flux transducer to show that the effect of this spreading is negligible when the measuring area is at least ~ 40 mm from the edges. In contrast, the measurement area must be much further away from the edges of the VIG in the measurement configuration with buffer plates, as discussed in Part 2.
It is convenient to write w in terms of the pillar separation λp as
![]()
where n is an integer and 0<δ<1.
In this case, in area A there are n² complete unit cells of the pillar array that contribute a heat flow that is equal to the average of the heat flow through the VIG. At the edges of A, heat flow occurs from (2n+1) incomplete unit cells. The magnitude of the combined heat flow through these incomplete cells is, in general, different from the average heat flow through an equivalent area of the VIG. This can lead to errors in the measurement.
Finite element modelling of heat flow
Finite element modelling is used to determine the spatial distribution of heat flux in the VIG. As noted, to a very good approximation the thermal conductance hv (Eq. 2) of a VIG remote from the edges is the sum of the separate thermal conductances associated with heat flow through the pillars hp and radiation through the evacuated space hv. It is important to highlight that only the heat flux through the pillars varies significantly with position in the VIG. However, radiative heat flow reduces the magnitude of the relative variations in the total heat flux to values obtained by multiplying the relative variations due to the pillars obtained from modelling by the factor hp/(hp+hr). Although the model discussed here can include radiative heat flow if desired, most of the modelling data presented are for the spatial distribution of this heat flux related to heat flow through the pillars alone.
In this work the ANSYS 18.0 FEM platform was used to perform simulations. The element types SOLID70/SOLID90 and SOLID182/SOLID183 were employed to model thermal behaviour, with the CONTA174 and TARGE170 elements employed to model the thermal contact between the glass panes and the pillars. The classic Ansys Parametric Design Language (APDL) was used to define the modelling process where the scripting language enabled an efficient parametric study. The scripts were executed on a High Performance Computing (HPC) cluster, with 7,636 cores (CPUs), 45 TB of RAM, 378 TB of storage, using a 56 Gbps FDR InfiniBand network.
In regions remote from the edge seal of a VIG, the spatial dependence of the heat flux is periodic. Except when including the edge seal contribution, it is therefore sufficient to use a 3D model of the square unit cell of the pillar array with adiabatic boundary conditions around all 4 sides of the cell. The heat flux is retrieved from the FEM models at each node of interest. Since the mesh dimension is a constant size of 0.5 mm × 0.5 mm, the heat flow at each node is proportional to the heat flux over the element area. The heat flow is obtained by multiplying the node heat flux by the element area. Appropriate weighting is applied to the contributions to the heat flux at the nodes at the edge and corners of the model. The heat flow is then summed over the defined metering area at each position of the metering area to determine the spatial variation in heat flow with respect to the location of this area over the VIG surface. Figure 5 contains an illustration of the unit cell and an image of the typical mesh layout at a pillar used in the FEM simulation.
In the model, unless otherwise specified, the pillar is a cylinder 0.5 mm in diameter and 0.2 mm high. The thermal conductivity of the pillar material is 20 W m⁻¹ K⁻¹ to simulate the metal commonly used for the pillars in VIGs. The glass sheets are simulated as two parallel square slabs of material of side λp and thickness tg, having thermal conductivity kg of 1.0 W m⁻¹ K⁻¹, and separated by the height of the support pillars. The model incorporates a high density of elements within the pillar and in the adjoining regions of the glass sheets. The element density was optimised to provide good convergence of the model while minimising the required computing time and resource.
When modelling heat flow with a heat flux transducer, additional slabs of material of appropriate thickness and thermal conductivity that represent the heat flux transducer are included in the model between the glass sheets and the isothermal plates. In all simulations, the temperatures of the hot and cold exterior boundaries of the model are set at 17.5 °C and 2.5 °C.
The heat flux in the unit cell is maximum directly above the pillar and decreases in the adjacent region with near-circular symmetry. There are four saddle points in the heat flux distribution at the midpoints of the edges of the unit cell, and four minima in the heat flux at the corners of the unit cell. To illustrate the greatest variation in the heat flux, the data presented in this Section are plotted along a diagonal of the unit cell.
In all practical VIGs, the pillar diameter is very small relative to the glass thickness. The spatial distribution of the heat flux at the external surfaces of the glass sheets is therefore essentially independent of pillar diameter. Changing the pillar separation λp and the glass thickness tg by the same factor does not affect the proportional variations of the external heat flux with respect to relative position across the unit cell. Modelling was performed for values of λp/tg between 3 and 10 to cover all current and possible future situations of practical interest.
Figure 6 shows typical modelling data for the heat flux along the diagonal of a unit cell with pillar separation of 20 mm, and different glass thicknesses. In all cases, the non-uniformities remain significant even for glass sheets that are much thicker than would be used in practical VIGs.
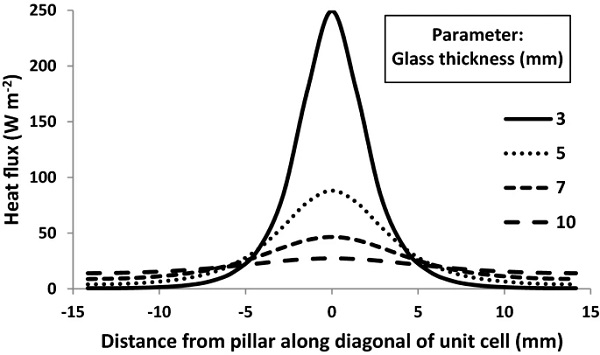
Consistent with earlier modelling and experimental measurements (Collins and Simko 1998), this modelled heat flux is essentially independent of the pillar diameter and agrees closely with the analytic result in Eq. (9). The spatial distribution of the modelled heat flux over the external surfaces of the glass sheets also agrees very well with previous modelling data (Wilson et al. 1998), and with measurements reported in the literature (Collins et al. 1993; Dey et al. 1998). These results provide strong validation of the model used in this work.
Variations in the heat flow for large measuring areas
Variations in the measured heat flow with position of the measuring area
This Section presents data for measured heat flow as a function of the position of a square measuring area relative to the pillar array in VIGs. The VIGs have specific values of λp and tg chosen to represent the range of values of the parameter λp/tg in practical specimens. The data are expressed in dimensionless form as a multiple of the heat flow through a unit cell.
The largest and smallest possible heat flows through a square measuring area of dimension w occur when there are respectively the largest and smallest number of pillars inside that area. As illustrated in Fig. 7, for odd values of the integer n defined in Eq. (19), the minimum heat flow occurs when the centre of the measuring area is directly above a support pillar, and the maximum heat flow is when the centre of the measuring area is mid-way between 4 pillars. Figure 7 also shows that these positions are reversed when n is an even integer.
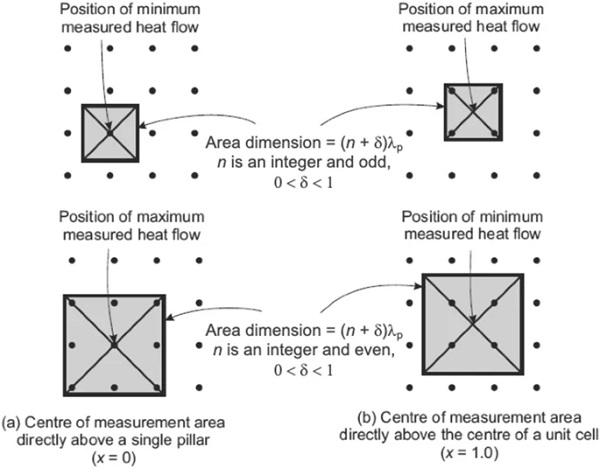
The data presented are scans of the modelled heat flow as the centre of the measuring area is moved along a straight line between the positions of maximum and minimum heat flow. The position of the centre of the area along each scan is given in dimensionless form, with x=0 directly above a pillar, and x=1 in the centre of four pillars, as shown in Fig. 7. The dimension w of the measurement area is expressed in dimensionless form as a multiple (n+δ) of the pillar separation λp, as in Eq. (19).
Figures 8, 9 and 10 show scan data for VIGs with the specified values of λp and tg. Each figure contains three sets of scans, corresponding to values of n in Eq. (19) equal to 1, 2 and 3. Each set has four scans corresponding to values of δ in Eq. (19) equal to 0, 0.25, 0.5 and 0.75. Obviously, greater heat flow in each set of four scans occurs for larger values of δ. In each set of data, the solid circles indicate the positions of the centre of the measuring area when the measured heat flow is equal to the average heat flow through the VIG.
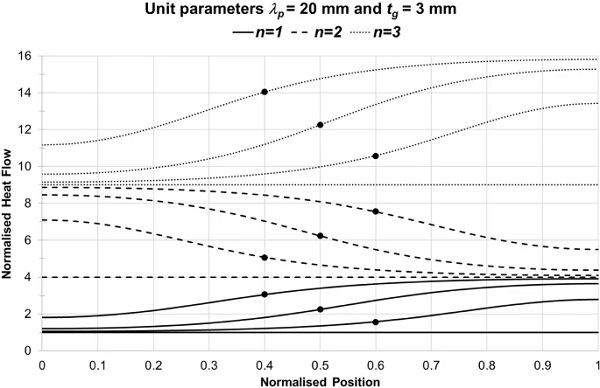
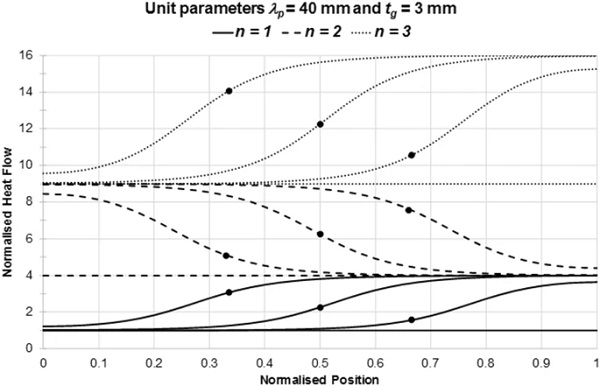
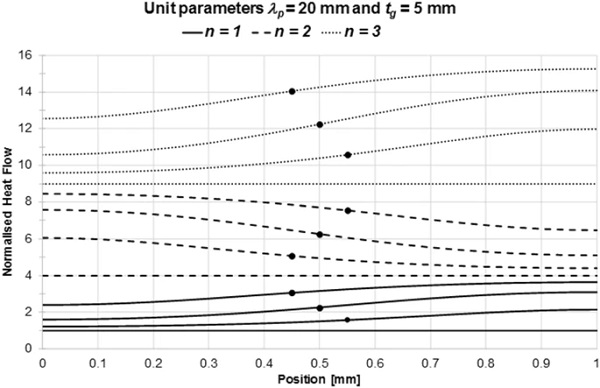
For these normalised quantities, the accurately characterised heat flow through each measurement area is equal to (n+δ)². Clearly, for given values of λp, tg and δ, the positions of the centre of the measuring area when the measured heat flow is equal to the average heat flow are the same for all values of n.
The data in Figs. 8, 9 and 10 show that large variations occur in the measured heat flow as the measurement area is moved relative to the pillar array. In general, there is no simple way of positioning the area so that it will measure the average heat flow. There are, however, two specific situations for which an accurate measurement can be made. Firstly, the measured heat flow is obviously independent of position when the dimension of the measuring area is an integral multiple of λp [δ=0 in Eq. (19)]. Secondly, when the dimension of the measuring area is w=(n+0.5)λp, the heat flow through the measurement area is equal to the average heat flow when the centre of the area is midway between the two extreme positions.
Predicted errors in the measured heat flow
As noted, the largest and smallest heat flows through the measurement area occur when the centre of the area is at the ends of each scan in Figs. 8, 9 and 10. These maximum and minimum heat flows can be combined with the accurately characterised normalised heat flow for each measurement area to calculate the largest positive and negative proportional errors that could occur in any VIG design. Figure 11 shows these errors for the cases presented in Figs. 8, 9 and 10 up to large values of n.
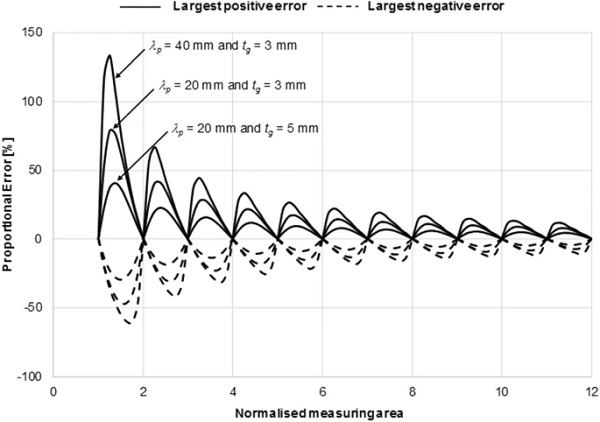
The data in Fig. 11 between sequential integer values of n are smooth curve fits to values calculated for 8 evenly spaced values of δ in Eq. (19) over the range from zero to 0.875. For even values of n, the largest positive errors occur when the centre of the measuring area is above a pillar, and the largest negative errors are when the centre is mid-way between 4 pillars. This situation is reversed for odd values of n.
The data in Fig. 11 show that the magnitude of the errors decreases approximately inversely with the dimension of the measuring area. However, significant errors can occur when measuring VIGs for all practical dimensions, even for large measurement areas. For example, for a VIG with 3 mm thick glass sheets and a pillar separation of 20 mm, the maximum errors are > 17% for areas ~ 100 mm square (n=5 in Eq. (19)), and > 12% for ~ 200 mm square measurement areas (n=10). The data in Fig. 11 for a VIG with 5 mm thick glass sheets and a pillar separation of 20 mm show that these errors are still significant when the glass sheets are much thicker than commonly used in practice.
When radiative heat flow between the glass sheets is included, the maximum possible errors are less and are obtained by multiplying the values in Fig. 11 by the factor hp/(hp+hr). The magnitude of this factor depends on the detailed design of the VIG. In some cases, radiative heat flow may be large enough to reduce the measurement errors to acceptable levels. However, these results show that the large area guarded hot plate configuration illustrated in Fig. 3a is, in general, not suitable for making accurate measurements of the heat flow through a VIG.
As mentioned, the construction of the heat flux transducers in heat flow meters significantly reduces the non-uniformities in the heat flux due to the pillars in VIG. These reductions are reflected in smaller possible measurement errors with these instruments. The magnitude of these reductions depends on the detailed design of the transducers. Figure 12 gives an example of the maximum positive and negative errors in the measured heat flow for a VIG with pillar separation λp = 20 mm and glass thickness tg = 3 mm. These data are for a heat flux transducer having the design parameters discussed in Sect. 3.1 (1 mm thick plastic layer and 30 μm thick copper foil).
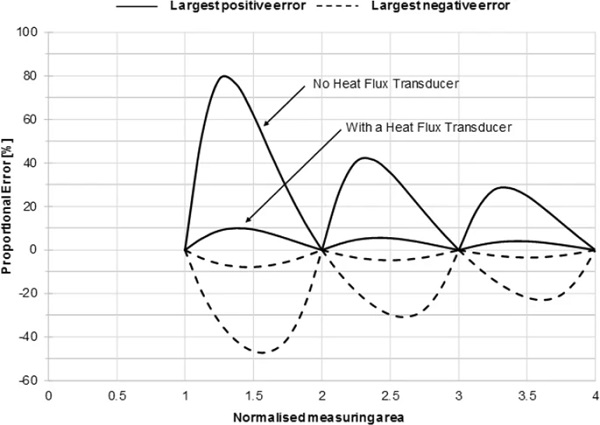
The data in Fig. 12 show that the heat flux transducer reduces the magnitude of the errors by a factor of about 8 for a VIG with pillar separation of 20 mm. These reduction factors are less for more widely spaced pillars, with values of approximately 4 and 3 for VIGs with pillar separations of 30 mm and 40 mm respectively. The reduction factors are essentially independent of glass thickness. These reduced possible measurement errors may still be significant, even for large measurement areas and when the effects of radiative heat flow are included. Work on this matter is continuing.
As noted earlier, design data of the heat flux transducers in commercial heat flow meter instruments are not usually publically available. In general, it is therefore not possible to make an a priori judgement of whether such an instrument will reduce the errors discussed above to acceptable levels. This can be determined experimentally, however, simply by using the instrument to measure the heat flow through the VIG specimen at the two extreme positions ‒ with the centre of the measuring area above a pillar, and mid-way between 4 pillars.
Conclusion
The localised heat flow through the support pillars in VIGs can lead to significant variations in the measurement of the thermal insulating properties when using large area instruments that directly contact the glass surfaces. The maximum and minimum heat flows occur (not necessarily respectively) when the centre of the area is directly above a pillar, and directly above the centre of a unit cell.
These variations can lead to errors in the measured heat flow. In general, there is no simple way of positioning the measuring area relative to the pillar array so that it measures the average heat flow through the specimens. There are, however, two exceptions to this. Firstly, the errors do not occur if the dimension of the square measuring area is an integral multiple of the pillar separation. Secondly, the errors are zero if the centre of a measuring area of dimension equal to (n+0.5) times the pillar separation (n an integer) is located midway between the positions of minimum and maximum heat flow.
The magnitude of the errors decreases approximately inversely with the dimension of the measuring area due to the proportionally larger number of complete unit cells that contribute to the heat flow. The errors are also less for heat flow meters than for guarded hot plates due to lateral heat flow in the heat flux transducers. The extent of this reduction depends on the specific design of the heat flux transducer in this instrument. The errors may be acceptably small for VIGs with thick glass sheets and closely spaced pillars, and for very large area heat flow meter instruments. It can be determined experimentally if this is the case by measuring the maximum and minimum heat flow through the specimen.
Abbreviations
- A : Area [m²]
- D : Distance [m]
- d : Diameter [m]
- H : Height of pillar [m]
- h : Heat transfer coefficient [W m⁻² K⁻¹]
- k : Thermal conductivity [W m⁻¹ K⁻¹]
- n : Integer [-]
- Q : Heat flow [W]
- R : Thermal resistance [m² K W⁻¹]
- r : Pillar radius [m]
- s : Separation [m]
- T : Temperature [K or °C]
- t : Glass thickness [m]
- U: Unit cell
- U : U-Value [W m⁻² K⁻¹]
- w : Dimension of measuring area [m]
- x : Position coordinate [m]
- δ : Fraction [–]
- Δ : Change [–]
- ε : Emittance [–]
- λ: Separation of pillars [m]
- ζ : Specific resistance of one pillar [K W⁻¹]
- σ : Stefan Boltzmann constant [W m² K⁻⁴]
- C: Cold
- e : External
- g : Glass
- i : Internal
- H: Hot
- m: Mean
- p: Pillars
- r : Radiation
- v : Vacuum
- 1, 2, 3, 4: Identifying surfaces of glass sheets
Acknowledgements
The authors acknowledge the Sydney Informatics Hub and the University of Sydney’s high-performance computing cluster Artemis for providing the high-performance computing resources that have contributed to the research results reported in this paper.
Funding
Open Access funding enabled and organized by CAUL and its Member Institutions.
Author information
Authors and Affiliations
School of Physics, A28, University of Sydney, Sydney, NSW, 2006, Australia
Cenk Kocer, Antti Aronen & Richard Collins
Nippon Sheet Glass Co., Ltd., 6 Anesaki-Kaigan, Ichihara, Chiba, 299-0107, Japan
Osamu Asano & Yumi Ogiso
Corresponding author
Correspondence to Cenk Kocer.