This paper was first presented at GPD 2019 by James Griffith, Sophie Moore, Ingrid Chaires, Alexej Goehring and Felix Weber from Arup, San Francisco, USA.
Insulated glass units with gas filled cavities are commonplace in the United States. Climatic pressures should be considered to assess pillowing in flat units and the utilization of glass and edge silicone seals in curved and small units.
However, the only internationally codified values for climatic loads parameters, presented in the DIN 18008 standard, are derived from climate data from Munich, Germany. United States climates are significantly more extreme, providing a wider range of loads which should be considered for design. The lack of any agreed design values for the United States poses a challenge for designers and the wider industry
This paper explores the statistical basis and methodology for the derivation of the Munich climatic load parameters, applying it to climate data for each ASHRAE climate zone in the United States. The result is a set of proposed design values for climatic temperature and barometric pressure variations which are calibrated to, and aligned with, the DIN methodology. A study of North American glass suppliers provides the basis for altitude change design values for each ASHRAE representative city.
1. Introduction
During the fabrication of insulated glass units (IGUs), the glass plies and edge seal capture a defined volume of gas in the cavity. This gas volume exists at a pressure and temperature determined by the atmospheric conditions at the time and location of manufacturing. However, this internal cavity pressure is not constant. The difference in altitude from fabrication to installation causes an effective pressure change in the cavity. Additionally, daily temperature and barometric pressure variations in service conditions cause the cavity gas pressure to fluctuate. These pressure changes are known as climatic loads in IGUs.
Climatic loads can cause aesthetic and structural problems. For typical flat IGUs, they can cause the inner and outer glass to bow to alleviate the pressure change. This phenomenon, known as pillowing, causes unwanted distortions in reflections (Figure 1). However, with curved glass and small spandrel units, the glass has much higher geometric stiffness, restricting the bowing of the units. Instead, much high pressures can build up, potentially overstressing the edge seal, or cracking the glass (Figure 2).
![Figure 1 (left): Climatic Loads Causing Pillowing Figure 2 (right): Curved Glass Breakage from Climatic Loads [2]](/sites/default/files/inline-images/Fig1%2C2.jpg)
Figure 2 (right): Curved Glass Breakage from Climatic Loads [2]
Currently no design guidance for establishing climatic loads exists in the United States. The only codified values exist in the DIN 18008 [1]; based on weather data for Munich. While some regions of the United States are aligned with the environmental conditions of Germany, many other climatic regions exist. As such, the applying the DIN climatic load parameters in the United States may be ill-advised.
2. Existing Methodology
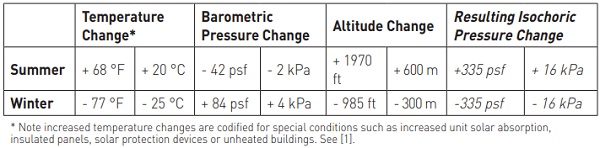
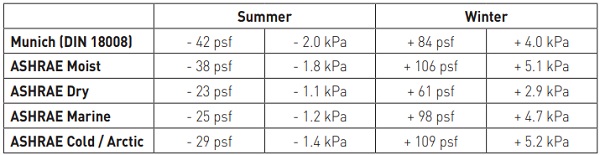
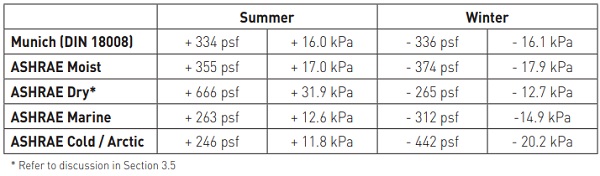
The German DIN 18008 provides the world’s only codified values for means of assessing climatic loads in insulated glass units. These are reproduced in Table 1. Annex A of DIN 18008 provides further information regarding the assumptions.
The exact statistical basis for the selection of these parameters is unclear. Feldmeier [3] considers a 10-month period of barometric pressure data across Europe and assumes production and installation temperatures combined with Munich solar radiation. Munich is the highest major city in Germany at 1700 ft (520 m), meaning the + 1970 ft (600 m) summer altitude change could be conceptualised as IGU fabrication near sea level and installation on a building 270 ft (80 m) tall. The basis for the winter altitude change is unclear; fabrication at 300m and installation at sea level.
3. United States Climatic Data Methodology
3.1 Loading
The ASCE 7-16 [4] provides the basis for all structural loading of buildings in the United States. Unlike with imposed loads, for which mean recurrent intervals are specified, loads which are considered ‘self-straining,’ such as thermal expansion or climatic loads, do not require consideration of upper bound values. Instead, a realistic assessment of the most probable values should be calculated.
3.2 ASHRAE Climate Zones
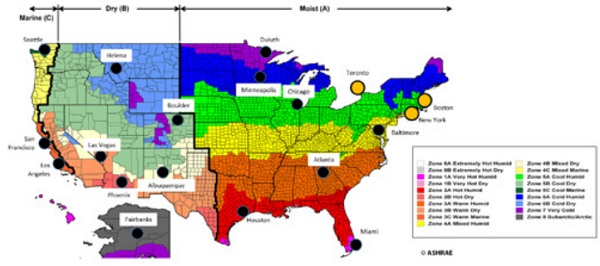
The American Society for Heating, Refrigeration and Air-Conditioning Engineers (ASHRAE) specifies 8 climate zones for the United States (Figure 3). Each climate zone is characterised by a single city, for which a typical meteorological year (TMY3) weather file is created. This file contains hourly data for a concatenation of representative months of weather data, constructed from 20 years of climate data in that zone.
Although New York, Boston and Toronto are not considered representative cities, they have also been included in this study for the purposes of adding value for glass designers. For comparison, Munich is designated Zone 5A (equivalent to Chicago).
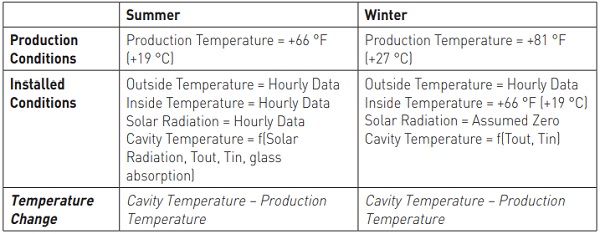
3.3 Temperature
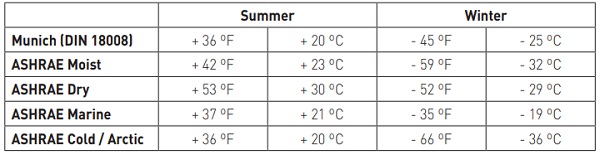
To establish values for temperature changes in the insulated glazing unit cavity, this paper aligns assumptions with those presented in Annex A of DIN 18008. The values of IGU energy absorption (30%), U-Value (1.8 W/m²K), summer internal and external surface resistance (0.12 m²K/W), winter internal and external surface resistance (0.13 m2K/W and 0.04 m²K/W respectively), production temperatures in summer and winter (+27 °C and +19 °C respectively) are kept constant. The calculation methodology is summarised in Table 2.
The temperature change values for each city are calculated hourly for vertical and horizontal glass. To ensure Munich data aligns with the codified DIN values, the 99.5th percentile of summer temperature changes and 1st percentile of winter temperature changes are taken.
For Munich, situated at a latitude of 48ºN, the DIN assumption of considering an incident solar radiation angle of 45º is reasonable, and avoids the need to calculate the different effects of horizontal or vertical glazing. However, the larger land area of the USA means variations in latitude from 25ºN (Florida) to 48ºN (Seattle) or 65ºN (Fairbanks Alaska). As such the orientation of the glass should not be neglected.
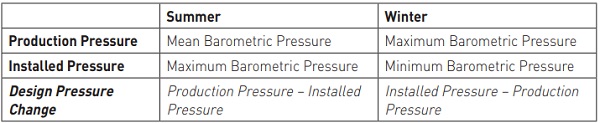
3.4 Barometric Pressure
Barometric pressure changes between production and installed conditions are calculated for each hour of the typical year. For summer, mean production pressures are considered; for winter, maximum barometric pressures. This approach follows the DIN methodology, which should be reviewed for alignment with the United States codes. The methodology is summarised in Table 3.
Once calculated for each ASHRAE climate region, the 90th percentile (summer) and 91st percentile (winter) have been taken; to align the Munich calculations to the DIN pressure values.
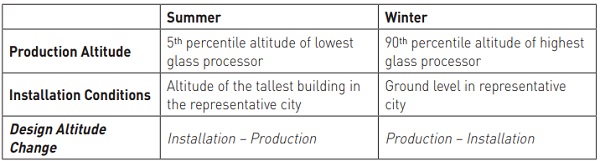
3.5 Altitude
The change in height from production facility to installed condition causes a variation in IGU cavity pressure, causing a permanent pressure change in the unit.
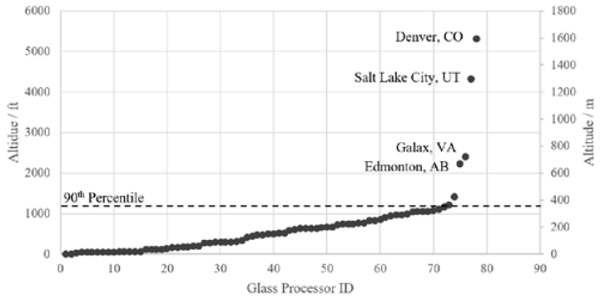
To establish reasonable values for altitude change, the altitudes of 79 major glass processors in North America was investigated. When plotted on Figure 4, all but 4 processors are situated below 1400 ft. Notably, the highest altitude processors occur in Denver, Colorado and Salt Lake City, Utah. For the purposes of this study, the 90th percentile of all the glass processor altitudes is taken as an upper bound design value, corresponding to an altitude of 1100 ft (335 m). A 5th percentile value of 35 ft (11m) is taken as a lower bound of production altitude.
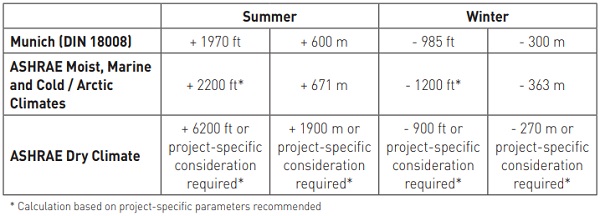
For each climate zone, the altitude of the representative city and the height of city’s tallest building were found. This provides a reasonable estimate of the height at which an IGU could foreseeably be installed. The difference between fabrication and installation then provides the altitude change for design (Table 4).
4. Results and Discussion
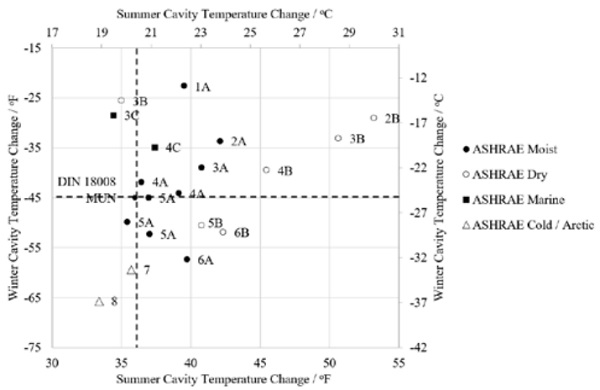
4.1 Cavity Temperature Change
The summary of cavity temperature changes for both summer and winter conditions, for each climate zone, is presented in Figure 5 for vertical glass. The DIN envelope and proposed USA envelope have been annotated on the graph. Summary envelope values are presented in Table 5.
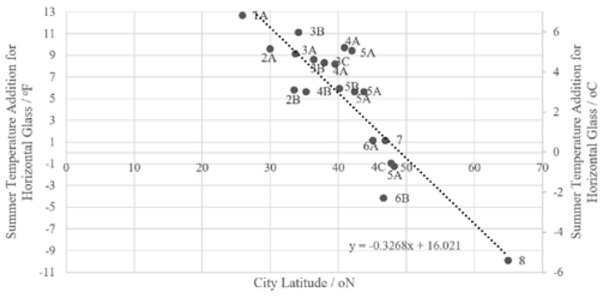
When horizontal glass is considered, up to a ± 7 oF (± 4 oC) temperature increase should be considered for summer conditions due to the change in incident solar radiation angle and increased exposure to diffuse radiation. This is illustrated in Figure 6.
It is noted that allowances for increased temperature changes for glass solar absorption greater than 30%, shading devices, insulation, or unheated buildings (all present in DIN 18008) have not been considered in the scope of this study but should be considered for any future US design guidance.
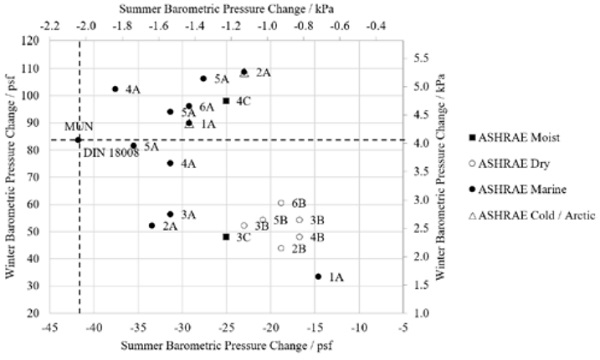
4.2 Barometric Pressure Change
The summary of barometric pressure changes for both summer and winter conditions is presented in Figure 7, together with the DIN envelope and proposed USA design envelope. These are summarised in Table 6.
These findings indicate that all United States climate zone barometric pressure differences fall within the DIN summer parameters, but some winter pressure variations exceed the DIN values.
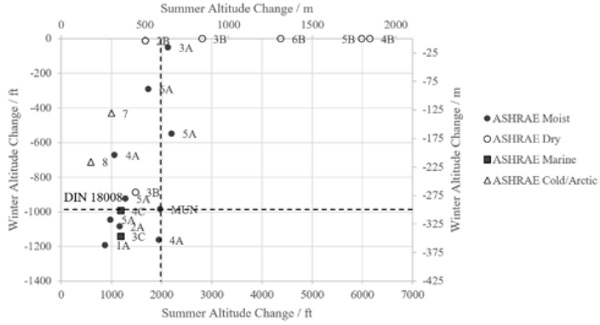
4.3 Altitude Change
The summary of altitude changes for use in summer and winter climatic load calculations are presented in Figure 8, and summary envelopes presented in Table 7. When compared to the DIN values, there can be significant increases in altitude change, as the installed altitude (particularly in Dry climate zones) can exceed 5000 ft (1500 m).
The +2200 ft altitude change presented above serendipitously aligns with the recommendations provided by the Glass Association of North America’s Glazing Manual [5], which recommends pressure equalisation or capillary tubes are applied when an altitude of 2200 ft is exceeded. Other guidance, such as Insulating Glass Manufacturer’s Alliance [6], suggests a 2000 ft limit.
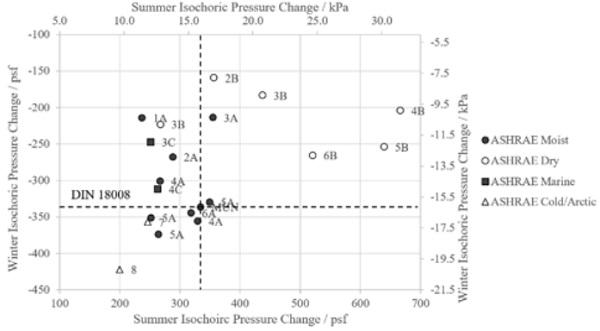
4.4 Isochoric Pressure
To consider the combined effects of the cavity temperature, barometric pressure and altitude changes on the isochoric pressure in the IGU cavity, the summer and winter isochoric pressures for each city are calculated and plotted in Figure 9.
These illustrate that with a 40 psf (1.8 kPa) envelope expansion of isochoric pressure beyond the DIN, all ASHRAE Moist and Marine climates can be covered. ASHRAE Dry and Cold / Arctic regions require special consideration in relation to altitude variation and winter cavity variation respectively.
5. Conclusions and Further Research
This paper puts forward a methodology which aligns with, and is calibrated to, the climatic load values found in the DIN 18008. This consistent methodology allows comparison across the varied climate zones of the United States and could be applied more widely around the world.
For the United States ASHRAE climate zones, differences in isochoric pressure changes and its constituent parts are well characterised by the climate type; Moist (A), Dry (B), Marine or Cold / Arctic. The envelope of ASHRAE Moist (A) and Marine (C) climate zones is within 40 psf (1.8 kPa) of Munich’s isochoric pressure values. For ASHRAE Dry (B) and Cold / Arctic, special consideration is required due to the high altitudes present and extreme cold respectively. This may cause high pressure buildup in the cavity of the insulating glass unit which greatly exceeds the values specified in the DIN 18008. Such pressure may require on-site pressure equalisation or continuous breather systems.
Design guidance for isochoric pressure variation in IGUs should be incorporated into future codes and standards. In addition to developing the work published in this paper, further guidance should consider:
- Establishing a clear statistical basis and methodology for calculating the climate data for all components (cavity temperature, barometric pressure and altitude variation) of climatic loads;
- Setting appropriate recurrence intervals for events;
- Aligning calculations with the design methodology of ASTM E1300 and the latest glass and structural design codes;
- Investigating the distribution of climatic loading in triple glazed units.
6. References
[1] DIN 18008-1:2010-12, Glass in Buildings – Design and Construction Rules – Part 1: Terms and General Bases, December 2010
[2] Thieme, S., Influence of Climatic Loads on the Design of Curved Double Glazed Units, Diploma Thesis, RWTH Aachen University, 2004
[3] Feldmeier, F., Development of a simplified method for the consideration of the climate load in the dimensioning of insulating glass in overhead glazing, Fraunhofer IRB Verlag, T 2676, March 1995
[4] ASCE 7-16, Minimum Design Loads and Associated Criteria for Buildings and Other Structures, American Society of Civil Engineers, 2017
[5] Glass Association of North America, GANA Glazing Manual, 2004
[6] TR-3401-96, Preventing Glass Breakage During IG Design, Manufacture, Transport, Installation and Use, Insulating Glass Manufacturers Alliance, 2003
[7] TRLV 2006, Technical Rules for the Use of Glazing with Linear Supports, 2006
[8] Draft prEN 16612, Glass in Building – Determination of the Load Resistance of Glass Panes by Calculation and Testing, European Committee for Standardization, 2013
[9] Feldmeier, F., Insulating Units Exposed to Wind and Weather – Load Sharing and Internal Loads, GPD, 2005
[10] Griffith, J. et al, Optimisation of Curved Insulated Glass, GPD, 2015
[11] Dobbel, F. et al, Verification of Insulated Glass Units in Modern Curtain Wall Facades, GPD, 2017.