First presented at GPD 2019
This information, coming directly from the on-line quality control of the tempered glass, reflects the actual production quality and is an optimal complement, which can be used next to the pre- adjustments of the regular furnace control.
Having the measurement results was the first step. The furnace supervisor could now use his / her experience for a good interpretation of this additionally gathered information to optimize the furnace processes.
The second step is now to use the results taken from the glass on the furnace bed and match it to the furnace structure (heating elements or quench etc.). Having this information, a much quicker response with a higher accuracy for improving furnace parameters will become possible. And with that the delivery quality.
The final step will be the closed loop between the measurement results and the furnace control for a direct readjustment of the sensitive furnace parameters.
Introduction
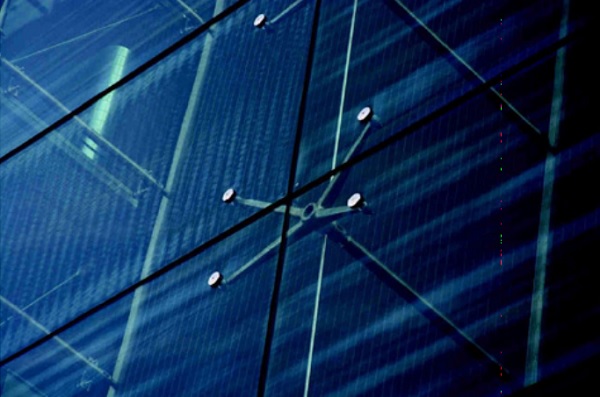
For a long time, the call of architects and facade planners was to be heard that anisotropies or white haze, being optical phenomena disturbing the clear appearance of a glass, have to be avoided completely.
Of course, both phenomena are related to the production procedure and, depending on the furnace technology and settings, can´t always be avoided.
To this day, the definition and differentiation of anisotropy and white haze effects poses enormous problems for customers and partners of the glass processors. Most of them are not able to differentiate between these two effects and lump both into one “pot”, as both anisotropy and white haze can form spots or stripes under certain light conditions. Of course the expert can differentiate both phenomena, but the reality is that at the building itself there is a lack of such experts. Therefore it is unluckily for the glass processor that both effects are always considered together.
Anisotropies are resulting from different tension relations inside the glass. Therefore, they mainly can be found in tempered glass. Most of the producers see anisotropies as process inherent and unavoidable when heat strengthening the glass, because up to the last 2 years there were no online measurement systems available. Furthermore, norms or standards do not describe any qualitative restrictions but only specify the anisotropy effects that occur during production.
But times are changing. On-line measurement devices are available since 2016 and help to significantly improve the quality of the glass products in term of anisotropic effects and white haze and raise them to a high quality level. Of course, the maximum achievable quality level depends on factors such as glass thickness or coating.
At the same time, in 2018 groups were formed in the USA and Europe, working to define norms and standards for anisotropy and white haze effects. These new quality standards are based on the results of the available On-line measurement methods and will define the minimum of acceptable anisotropy effects and include a definition for white haze requirements.
On-Line Anisotropy and White Haze Measurement Methods
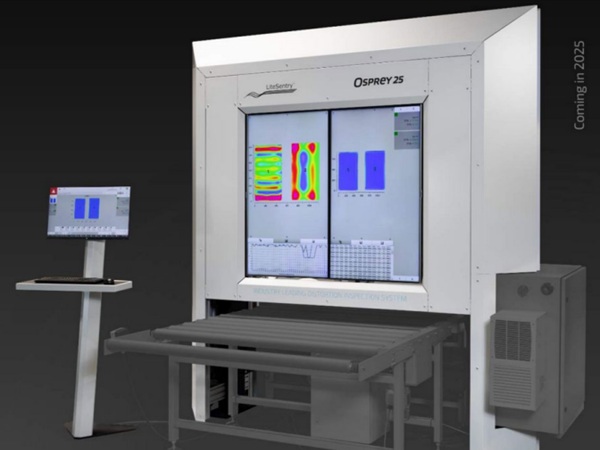
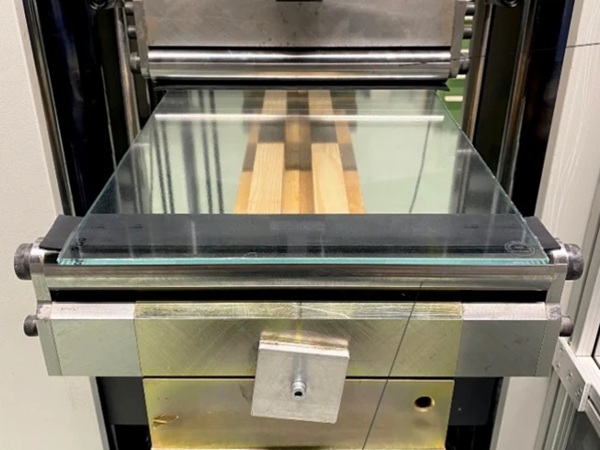
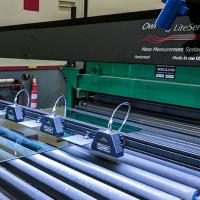
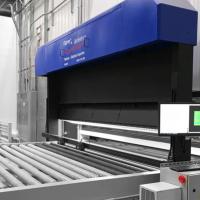
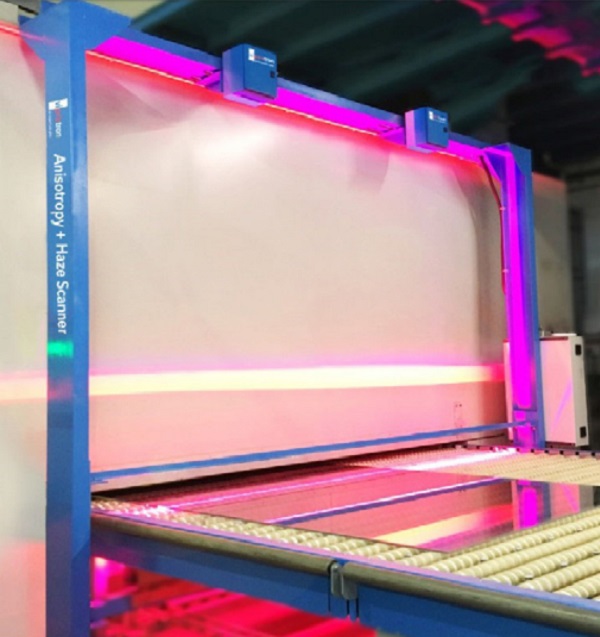
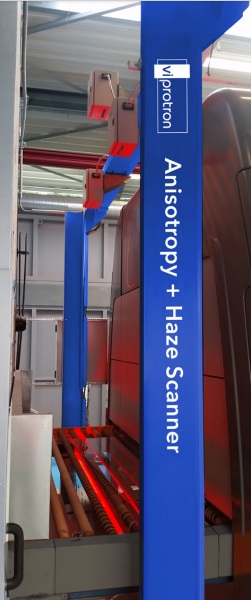
Positioned directly at the outlet of the furnace the Viprotron Anisotropy Scanner controls the exiting glasses and provides exact online measurements of the anisotropy effect and at the same time it detects White Haze effects of each glass of the furnace load. The measurement is independent of transport speeds, glass thicknesses, coating types or other product-specific influences.
Although the Anisotropy and White Haze effects cannot usually be separated from each other by facade planners, architects and end customers and are therefore often mixed up, in reality they are completely separate phenomena. Both can only be detected with different illumination methods and thus can only be measured safely and reliably online with different physical approaches. For this reason, both effects will be described separately in the further course of this article, even though they are integrated together in one inspection system.
On-Line Anisotropy Measurement and Evaluation
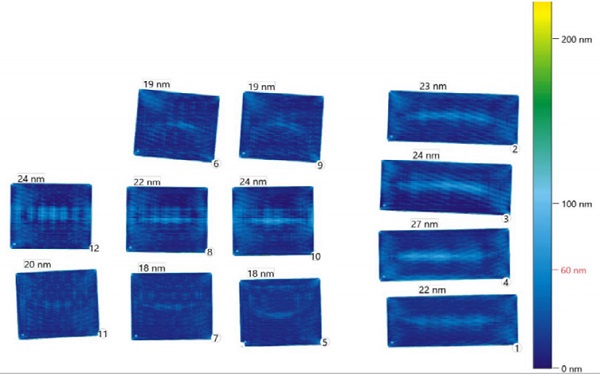
Simultaneously the localization and measurement of the anisotropy intensity in optical retardation takes place. To ensure the measurement results are consistent and reliable, a sophisticated calibration procedure is used to work reliably with the system. Using these methods, the measurements for optical retardation are independent of decisive influences such as glass coatings, glass transmissions, glass thickness or product type. Thus, a physically measurable basis can be achieved by which the anisotropy quality of a glass can be evaluated.
The most important factor now is to define at which level of optical retardation Anisotropy effects become visible to humans. Although initial investigations have already been carried out by various companies, scientifically basics are not yet available, but are already underway. From today’s point of view it has been shown that from a retardation level of 50nm to 60 nm, corresponding effects become visible. Also, by usage of the Anisotropy scanner with different glass processors, it has been shown that these are values that can be kept within a reasonable range in terms of production technology.
How to define Anisotropy quality?
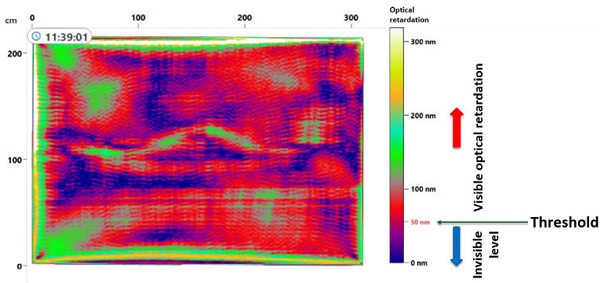
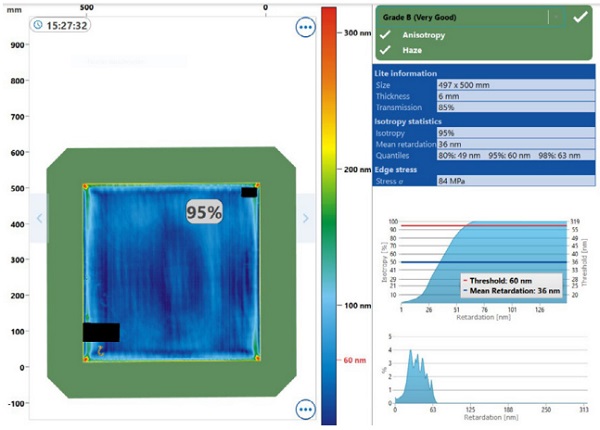
Based on the measurement in optic retardation and by defining a certain level from which the retardation becomes visible, different statistical quality parameters are calculated.
Based on a method published from a glass fabricator.
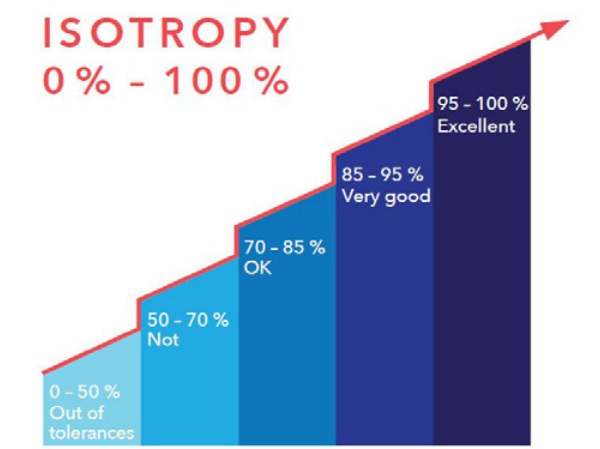
A few years ago a glass fabricator published together with enormous marketing activities a method, with which they proposed to be able to produce 95% anisotropy free glass. Although this definition was totally useless, because it did not specify the fundamental optical retardation basics on which this isotropy level is calculated, this method has been established in the industry until today.
Compared to these “old days” however, today this level can be physically clearly defined and calculated. It is the level of isotropy with a maximum allowed (threshold) optical retardation of X. Whereby, as shown in the picture above, the X is practically set at about 60nm.
This clearly defines a quality level, e.g. at 95% which means that 95% of the glass has a retardation of less than X=60nm. Or to put it another way, 95% of the glass shows no or hardly noticeable anisotropic effects.
Of course, a large number of further statistical values can be calculated based on the retardation image, which can also be used for quality assessment. Some glass manufacturers, for example, specify as a quality definition of their products, the average retardation of the entire glass instead of the isotropy level.
Also different quantiles at 98%, 95% and / or 80% can be used to evaluate the quality of the glass. It is not yet clear which evaluation methods will be finally used in the planned standardization procedures or whether there will be combination of several of these numbers. However, in current practice, these two methods have so far crystallized as accepted guidelines in the definition of glass quality for certain façade projects:
- Level of Isotropy at a max. allowable retardation of Xnm
- Mean Retardation of the whole glass
In-line detection and classification of White Haze
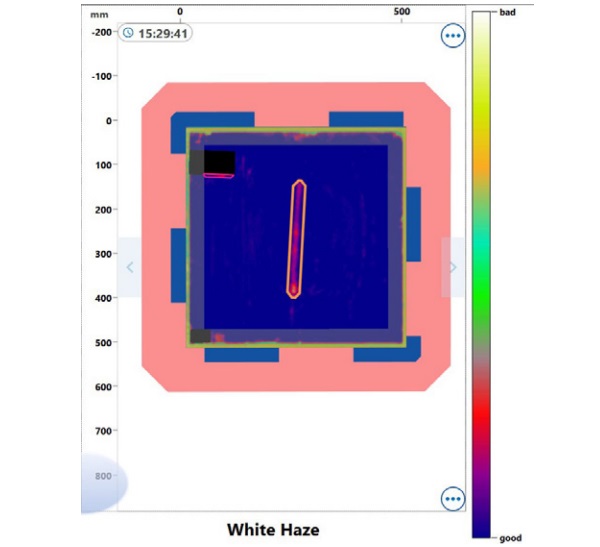
The White Haze detection channel is also integrated directly after the furnace, so that the results are available as soon as the glasses has to be unloaded. This Haze detection approaches takes into account that the glass after the furnace is not “clean” and therefore they can efficiently filter out the stains and roller marks to ensure White Haze is explicit separated at the end.
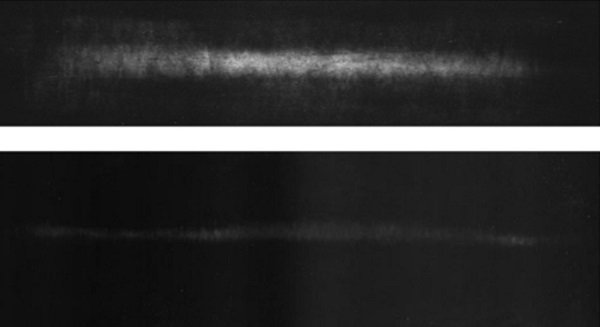
This means that the operator at the furnace immediately has a precise indication of which glass contains White Haze, its position and its visual intensity. Of course, exact quality specifications can also be defined in order to meet the customer’s requirements.
From a purely technical point of view, the White Haze detection is an inspection channel that is physically completely separated from the anisotropy measurement.
This separate channel has its own camera and lighting unit, independent of any polarization filters, in order to make the Haze effect visible efficiently.
Only with such a clear physical separation of the two types of measurements, a reliable detection / measurement as well as a distinction of the Haze and anisotropy effects can be achieved.
It is also important for the detection of White Haze, that it can be avoided during production if the correct parameters of the furnace are used. However, this requires that the White Haze stripes are first made visible during the production process before the furnace can be optimized.
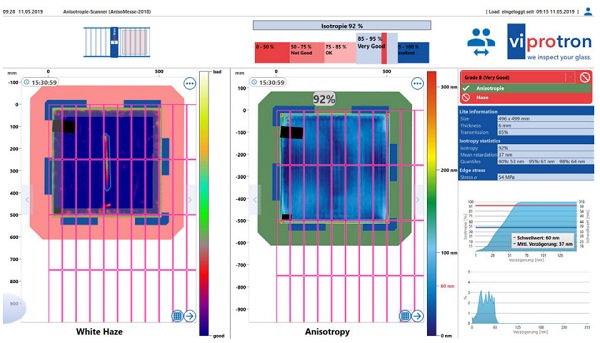
The White Haze channel is integrated in the same structure as the Anisotropy scanner. The user interface is also combined so that both results can always be seen at the same time.
Thus, for the operator it is a single system which reliably implements both tasks. Of course, both channels can also be operated separately.
This makes sense especially for glass fabricators that are mainly active in the residential market or interior construction. In their glass applications anisotropy phenomena are visible in the rarest cases, whereas White Haze is often complained of as a white stripe that cannot be removed. For such companies a single Haze scanner is highly recommended.
Is it possible to improve the quality of the glass after tempering?
After tempering it’s impossible to change anything on the Anisotropy effect, because its mainly based on the stress level inside the glass.
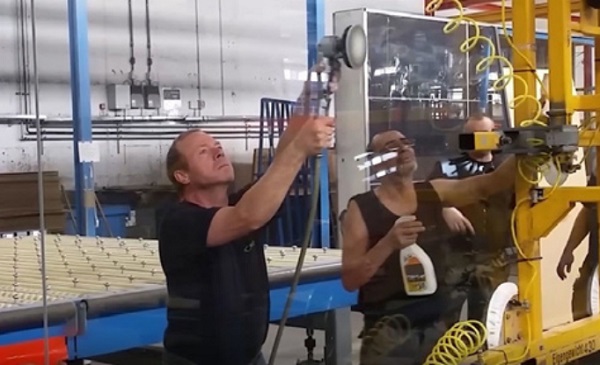
But white Haze can be removed after tempering. Glass fabricators producing large glass dimensions, e.g. for facades or expensive glass / coating combinations, are usually polishing the glass in the area of the detected White Haze stripe.
But whatever you do after tempering, the main goal always remains in avoiding both effects!
How to improve furnace quality when receiving In-line results for Anisotropy and Haze
First of all, the furnace optimization according to the results of Anisotropy and White Haze measurement is possible and is today used intensively and successfully by all glass fabricators that have installed such Viprotron technologies to produce high level glass quality. Different installations shows that both new and old furnaces can achieve good quality using these on-line measurement techniques.
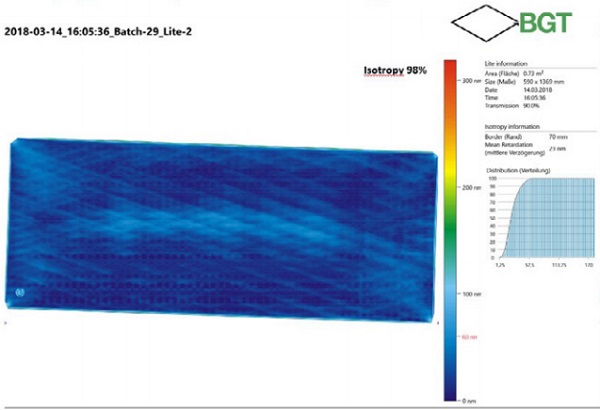
Citation from Manuel Dany, Production manager tempering at Bischof Glastechnik in Germany: “Since 2016 we have been working intensively with our Anisotropy + Haze scanner and can therefore achieve a super quality today. With the help of the Anisotropy and Haze scanner the right furnace parameters can be optimized quickly and effectively, in order to influence the quality in a very targeted way. Thus, the Anisotropy + Haze scanner is an important and valuable tool to ensure the required qualities permanently”.
The scanner helps to optimize the furnace by visualizing the results of Anisotropy and White Haze and visualizing the positions of the heating elements as well as the position of the blowers in the quench. If the operator at the furnace entrance has a separate screen available, he can use these tools to identify exactly which furnace parameters he has to change to achieve improvement.
In the beginning, this process naturally takes place according to the Try and Error principle, but since the effects of his efforts are immediately demonstrated with the next load of the Anisotropy + Haze scanner, the furnace operator very quickly acquires the necessary know-how to manipulate the furnace in a precise manner. Thus, in the end he is always able to achieve and document the required quality.
The experience by the multitude of installations of Anisotropy + Haze scanners shows, that immediately after the installation qualities are documented which are completely unacceptable concerning Anisotropy (ranges from 60% to 70% at 60nm).
However, after only one week of intensive use of the device, these values reach 90% and more. The same applies to White Haze. Often after installation glass fabricators are surprised, being confronted again and again with Haze on their own products. But the Anisotropy + Haze Scanner helps to eliminate this effect as far as possible after only a few days.
Summary
With modern technologies for Anisotropy + White Haze measurement directly after the furnace, the glass qualities in regards to anisotropy and white haze appearances can be reliably measured and documented in-line. Thus, the Glass fabricator can define exactly in which quality ranges his tempered glass products move and can also easily document and verify this. If White Haze is detected, it is still possible for the glass fabricator to polish it away after it has been detected by the scanner.
By using special display tools on the Anisotropy + Haze Scanner, the glass fabricator can continue to directly influence its glass qualities. With the help of the detailed visualization results as well as the use of special display tools, he can influence his furnace parameters quickly and very specifically. In addition, in a very short time the glass fabricator is able to produce an excellent quality permanently. Thus, the Anisotropy + Haze Scanner technology puts the glass fabricator in the fortunate position of only documenting good quality!